Upgrade to Pro — share decks privately, control downloads, hide ads and more …

Dietary Approaches to Stop Hypertension - class presentation

Rafaelwh
April 09, 2013

Dietary Approaches to Stop Hypertension - class presentation

Rafaelwh

April 09, 2013
Tweet

Other Decks in Science

Transcript

  1. Diet  Blood Pressure Change
    a
    Randomized Clinical Trial
    Dietary Approaches to Stop Hypertension
    (DASH)
    Intisar Ghleilib
    Rafael Widjajahakim
    CI 790 Spring 2013

    View Slide

  2. Blood Pressure (BP)
    • The force of blood pushing against 
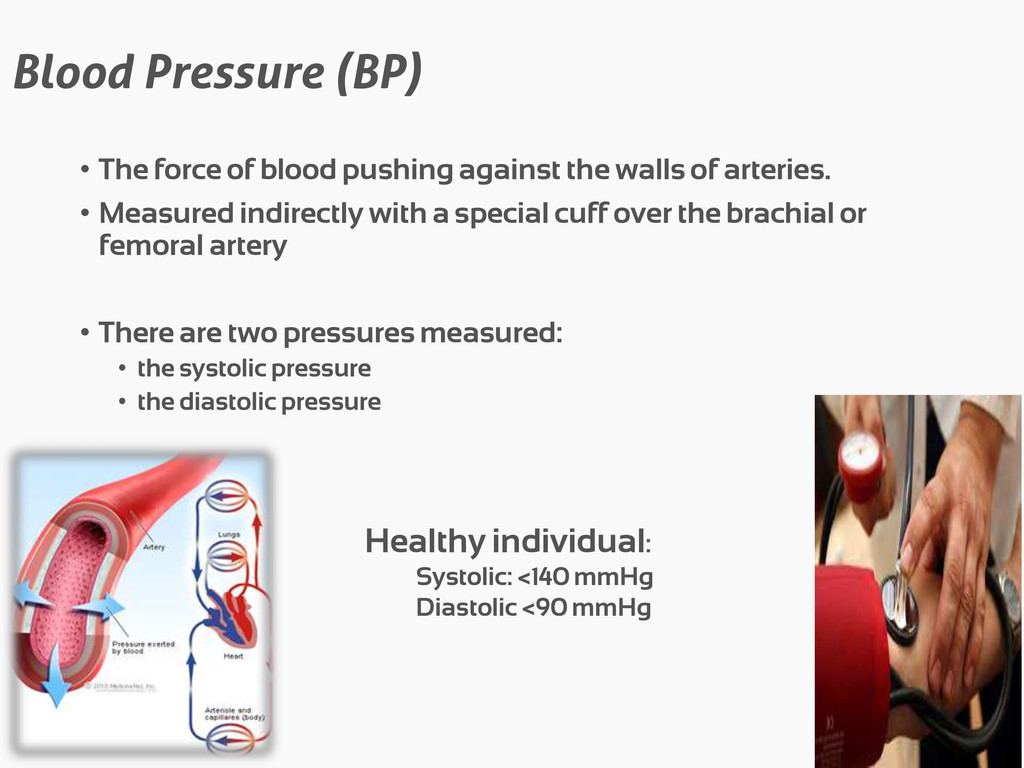
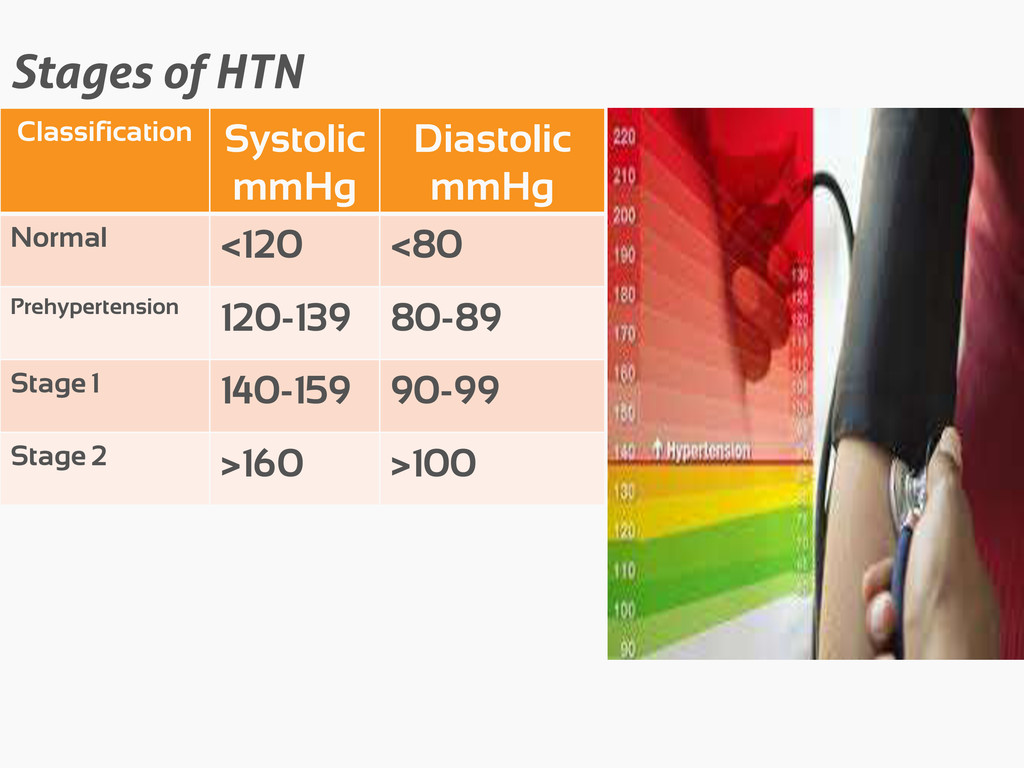
the walls of arteries.
    • Measured indirectly with a special cuff over the brachial or
    femoral artery
    • There are two pressures measured:
    • the systolic pressure
    • the diastolic pressure
    Healthy individual:
    Systolic: <140 mmHg
    Diastolic <90 mmHg

    View Slide

  3. Normal Blood Pressure Control
    sympathetic division of the
    autonomic nervous system and the
    kidneys.
     blood volume
     changes in diameter of arteries
     speed and force the heart in
    pumping.

    View Slide

  4. Hypertension (HTN)
    • The American Heart Association
    define the HTN 
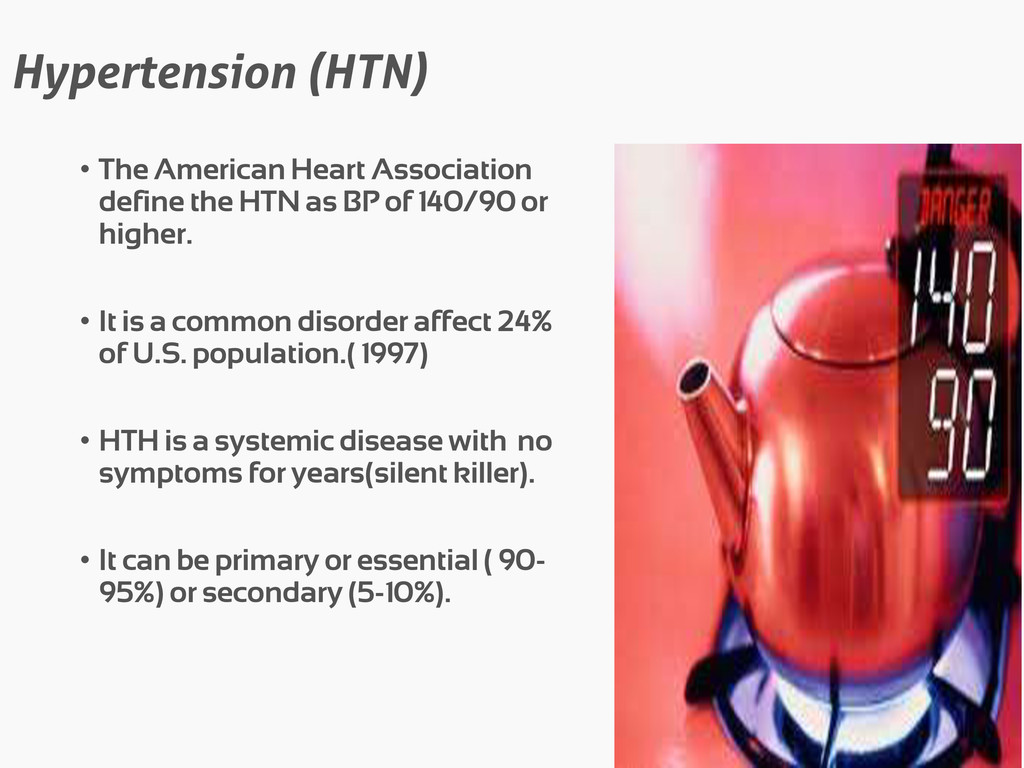
as BP of 140/90 or
    higher.
    • It is a common disorder affect 24%
    of U.S. population.( 1997)
    • HTH is a systemic disease with no
    symptoms for years(silent killer).
    • It can be primary or essential ( 90-
    95%) or secondary (5-10%).

    View Slide

  5. Pathophysiology of HTN
    Overstretch
    vessels
    Weak
    vessels
    Tear &scars
    Block
    vessels
    Clot
    formation
    Stroke , heart
    attack,& end
    organ damage

    View Slide

  6. Stages of HTN
    Classification Systolic
    mmHg
    Diastolic
    mmHg
    Normal <120 <80
    Prehypertension 120-139 80-89
    Stage 1 140-159 90-99
    Stage 2 >160 >100

    View Slide

  7. Risk factor of HTN
    • Over 45 years old
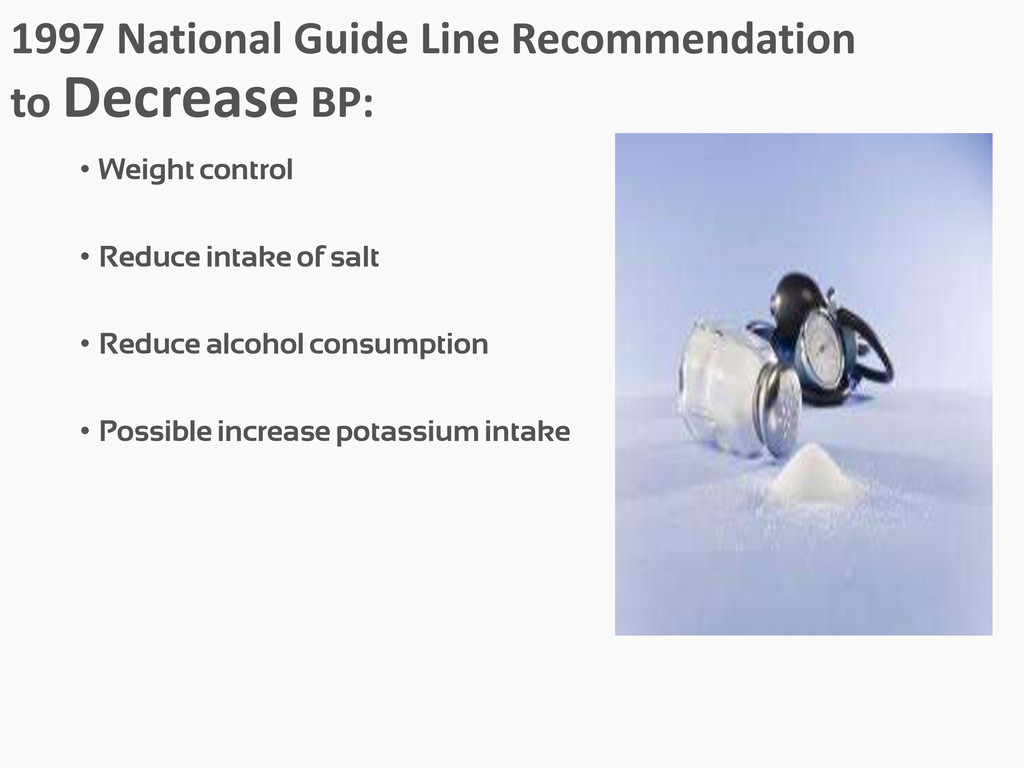
    • Overweight
    • African American
    • Family History
    • Eat a diet high in salt
    • Drink too much alcohol
    • Smoke
    While some of these risk factors can
    not change, but the others can change.
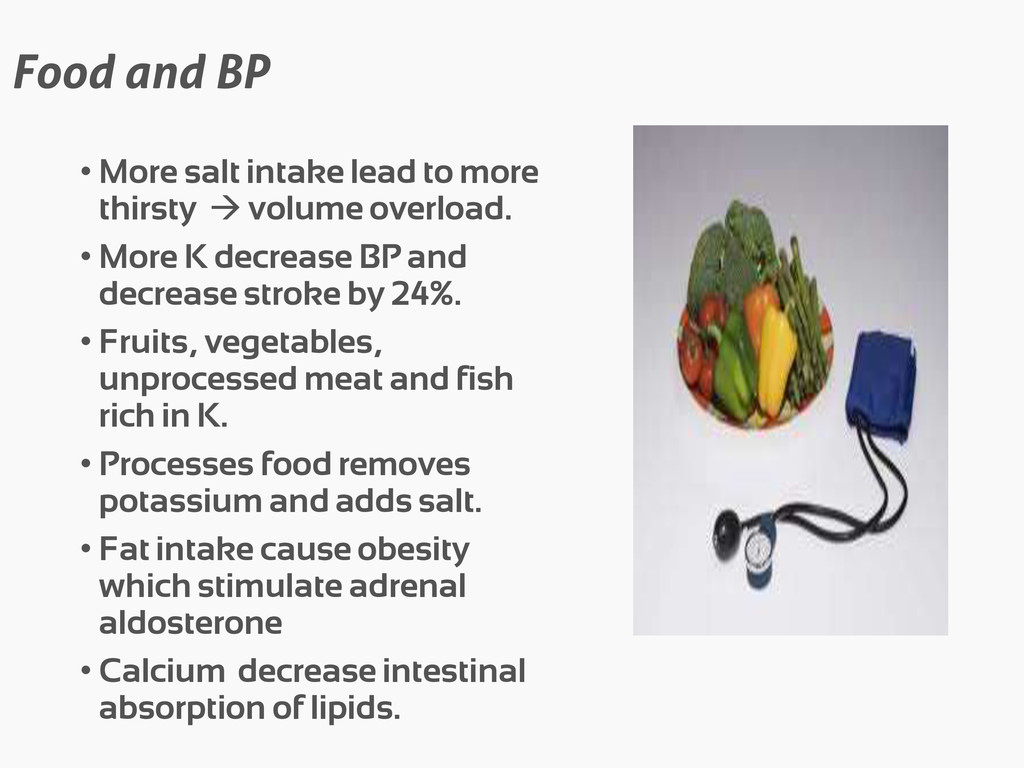
    View Slide

  8. 1997 National Guide Line Recommendation
    to Decrease BP:
    • Weight control
    • Reduce intake of salt
    • Reduce alcohol consumption
    • Possible increase potassium intake

    View Slide

  9. Food and BP
    • More salt intake lead to more
    thirsty  volume overload.
    • More K decrease BP and
    decrease stroke by 24%.
    • Fruits, vegetables,
    unprocessed meat and fish
    rich in K.
    • Processes food removes
    potassium and adds salt.
    • Fat intake cause obesity
    which stimulate adrenal
    aldosterone
    • Calcium decrease intestinal
    absorption of lipids.

    View Slide

  10. Previous studies
    Observational
    Study
    • Vegetarians were
    observed to have 
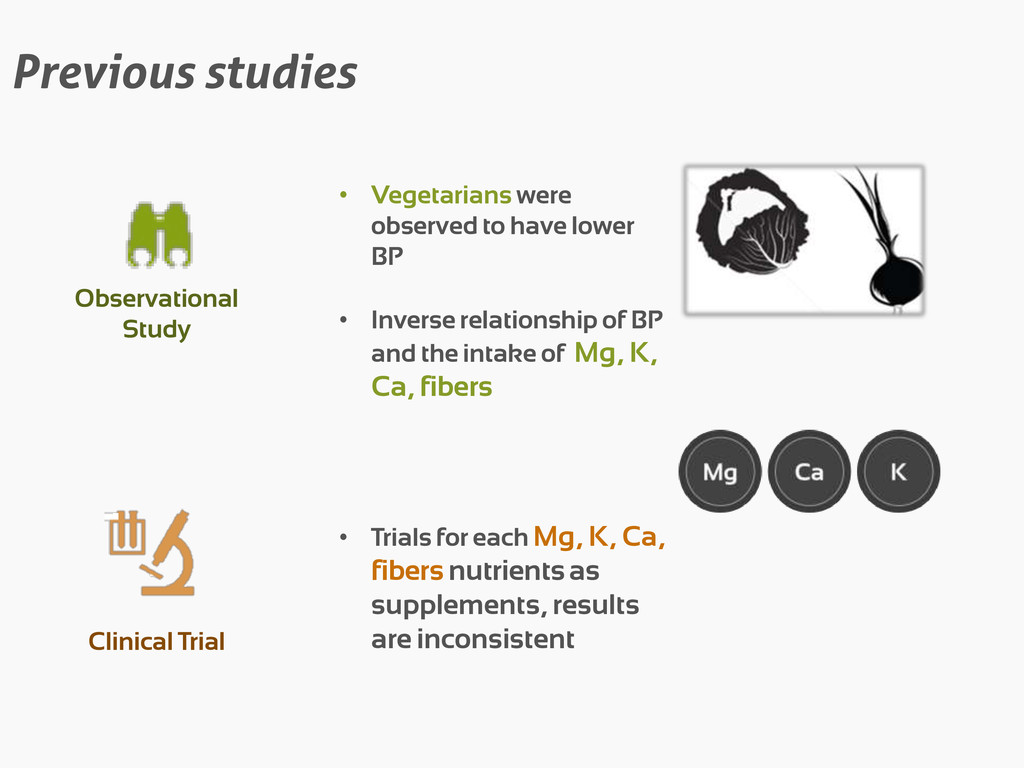
lower
    BP
    • Inverse relationship of BP
    and the intake of Mg, K,
    Ca, fibers
    Clinical Trial
    • Trials for each Mg, K, Ca,
    fibers nutrients as
    supplements, results
    are inconsistent

    View Slide

  11. Dietary Approaches to Stop Hypertension
    (DASH)
    • Started from 1993
    • 1st group: Sept. 1994
    • Funded by
    • NHLBI
    • Office of Research on Minority Health
    • National Center for Research Resources of the National
    Institutes of Health
    • Design: Clinical trial
    Clinical center :
    Baltimore
    Baton Rouge
    Durham
    Boston
    John Hopkins University
    Louisiana University
    Brigham and Women’s Hospital
    John Hopkins University
    Recruitment strategy
    - Mass mailing
    - Work-based
    - Community-based
    Targeted to have 2/3
    participants as
    minority

    View Slide

  12. DASH
    -the idea behind the design
    • Effects of a 
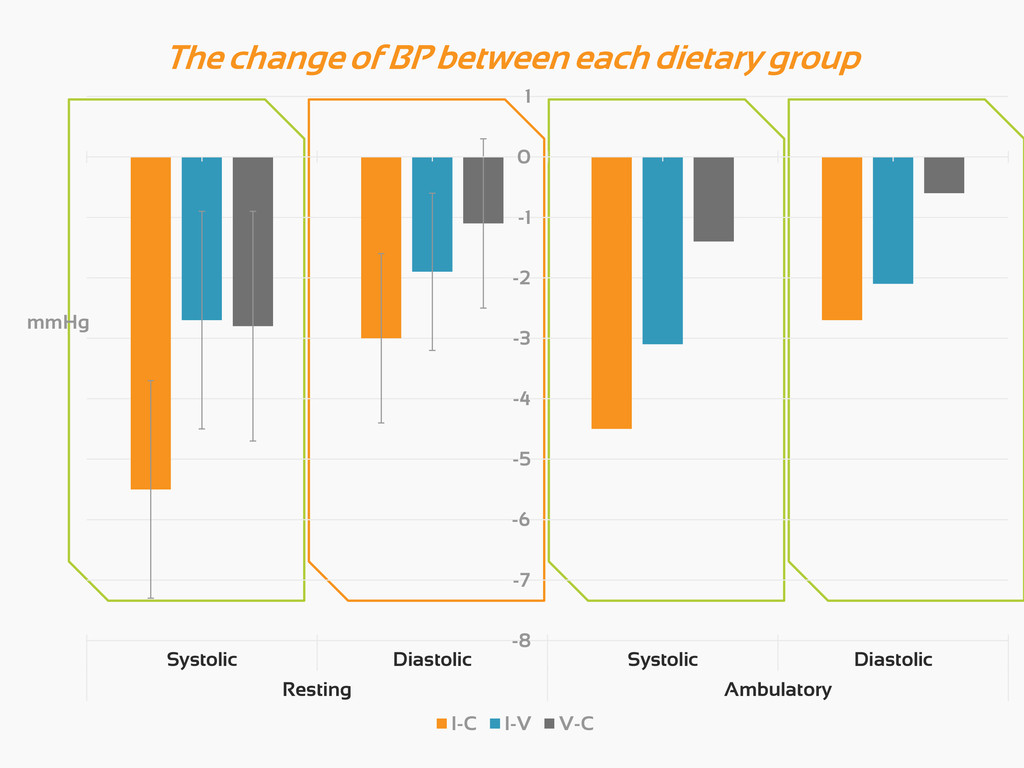
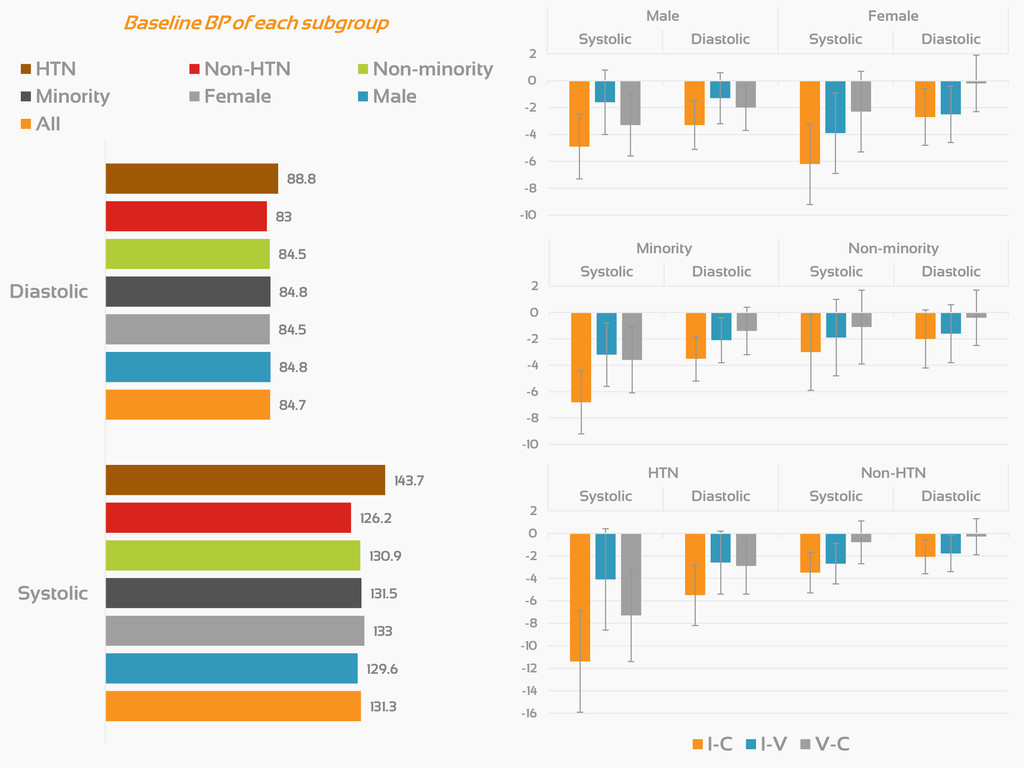
single molecule is hard to detect
    • Combining all nutrients = observable effects
    • Unknown nutrients/molecules
    • Unknown interactions
    • Natural > artificial
    The study also investigates the
    effects of the dietary
    interventions on changes in
    levels of serum lipids, renin,
    ionized and calcium.
    Also explores the effects of
    several baseline characteristics,
    Outcomes
    Ambu
    -latory
    Rest
    Systolic
    Diastolic
    Systolic
    Diastolic
    1⁰
    2⁰
    2⁰
    2⁰
    What is the effect of 3 different dietary
    pattern on the blood pressure in persons
    with high-normal and mild HTN?
    Study Question

    View Slide

  13. Choice of Diets
    Control diets
    • Typical American
    diets
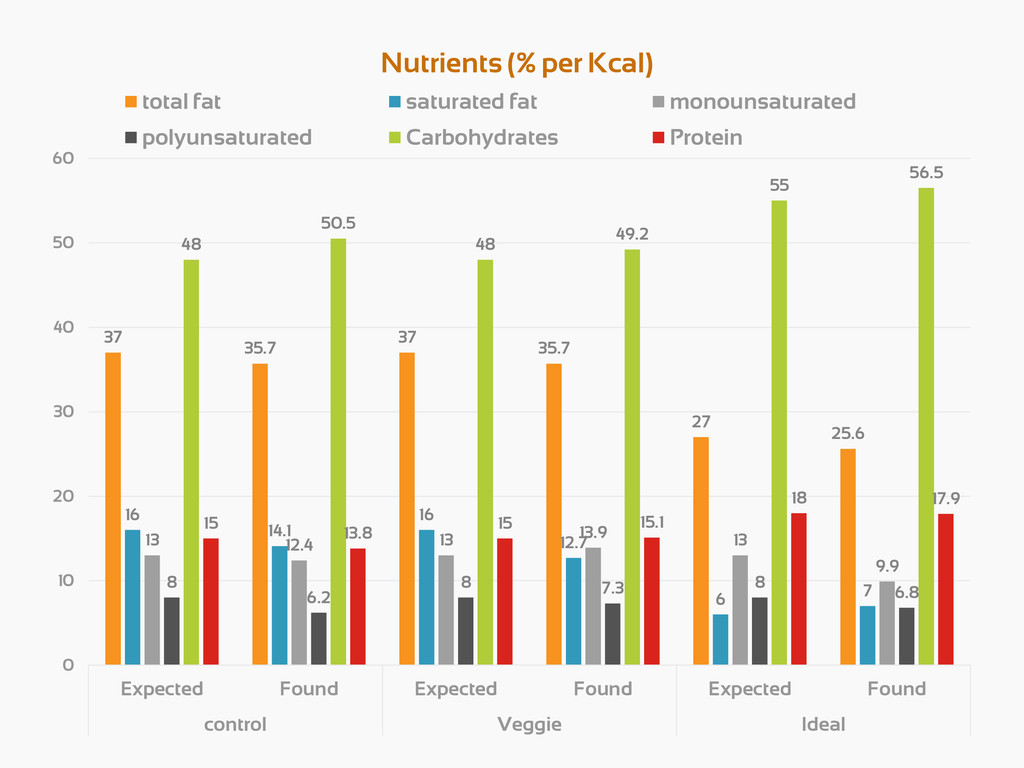
    • Follow average
    American diet
    composition
    • Keep K+, Mg++, and
    Ca++ similar (25th
    percentile)
    37
    48
    15
    Total Fat Carbohydrates Protein
    Combination diets
    • Rich in fruits and
    vegetables
    • Lower total fat and
    cholesterol
    composition
    • Higher fiber and
    protein
    • K+, Mg++, and Ca++
    (75th percentile)
    27
    55
    18
    Total Fat Carbohydrates Protein
    Fruits and
    Vegetables diets
    • Primarily fruits and
    vegetables
    • Fat, carbohydrates
    and protein are
    similar to control
    • K+, Mg++, and Ca++
    (75th percentile)
    37
    48
    15
    Total Fat Carbohydrates Protein

    View Slide

  14. 37
    35.7
    37
    35.7
    27
    25.6
    16
    14.1
    16
    12.7
    6 7
    13 12.4 13 13.9 13
    9.9
    8
    6.2
    8 7.3 8
    6.8
    48
    50.5
    48
    49.2
    55
    56.5
    15
    13.8
    15 15.1
    18 17.9
    0
    10
    20
    30
    40
    50
    60
    Expected Found Expected Found Expected Found
    control Veggie Ideal
    Nutrients (% per Kcal)
    total fat saturated fat monounsaturated
    polyunsaturated Carbohydrates Protein

    View Slide

  15. 1700
    1752
    4700
    4101
    4700
    4415
    165
    176
    500
    423
    500
    480
    450
    443
    450
    534
    1240
    1265
    3000
    3028
    3000
    2816
    3000
    2859
    EXPECTED FOUND EXPECTED FOUND EXPECTED FOUND
    CONTROL VEGGIE IDEAL
    Nutrients (mg/day)
    K⁺ Mg⁺⁺ Ca⁺⁺ Na⁺

    View Slide

  16. Controlled feeding
    4 Caloric levels
    • 1600
    • 2100
    • 2600
    • 3100
    7-day menu cycle (21 meals)
    Commonly available forms/variety
    • Fresh
    • Frozen
    • Canned
    • Dried
    Standardization: - Same brand
    - Prepared on the center kitchen
    Procedure: • On-site: lunch (weekdays)
    • Off-site: breakfast and dinner
    - provided with cooler and meal during visitation
    - Meals for weekend (received on Friday)
     Recording beverages and salt intakes; non-study foods
     Provided with 2 salt/day
     Weight measured/weekday

    View Slide

  17. Hypotheses and their inferences
    If Then
    Ideal > Veggie > 
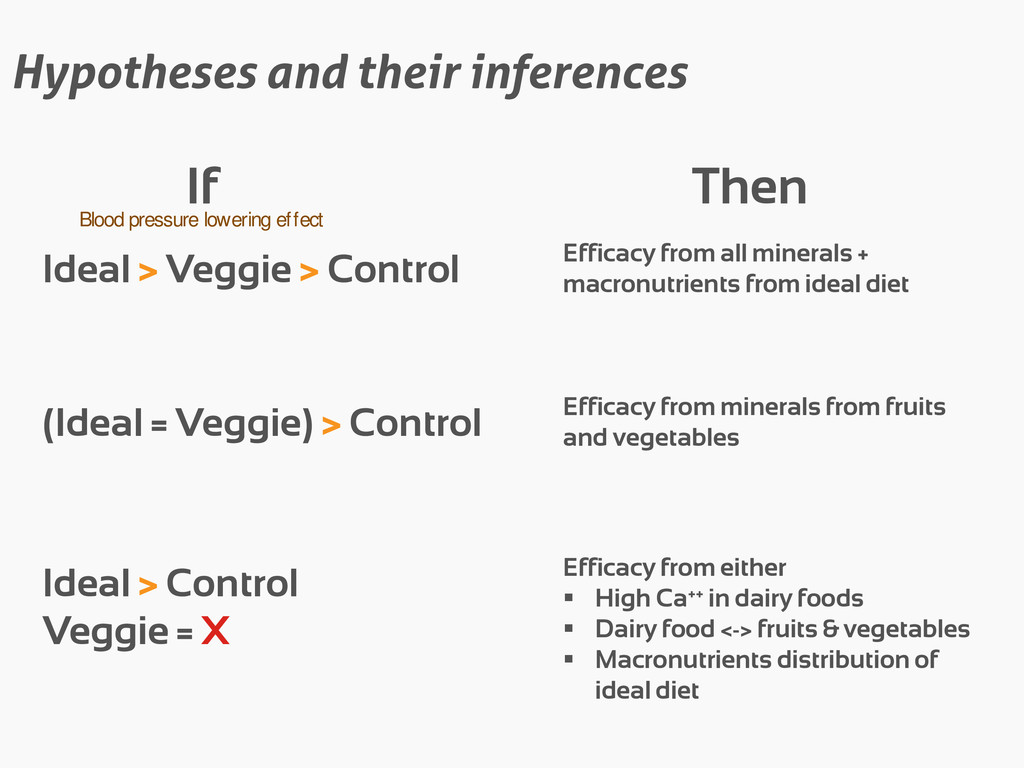
Control Efficacy from all minerals +
    macronutrients from ideal diet
    (Ideal = Veggie) > Control Efficacy from minerals from fruits
    and vegetables
    Ideal > Control
    Veggie = X
    Efficacy from either
     High Ca++ in dairy foods
     Dairy food fruits & vegetables
     Macronutrients distribution of
    ideal diet
    Blood pressure lowering effect

    View Slide

  18. 3 weeks 8 weeks
    3 Visits
    (1 week in between)
    Within 4 mo. immediately
    Screened= 8813 Run-In= 502
    Randomized=
    459
    Control= 154 147
    Veggie= 154 150
    Ideal= 151 149
    Ineligible= 8311
    Non-adhered=
    43

    View Slide

  19. Screening
    Age: ≥22 years
    • Not on anti HTN Medication.
    • Systolic BP: <160mm.Hg
    • Diastolic BP: 80- 95mm.Hg
    Exclusion criteria
    χ Unwillingness or inability to modify current diet.
    χ Significant morbidity.
    χ Uncontrolled DM or hyperlipidemia.
    χ cardiovascular event within previous 6 months
    χ Medication affecting BP
    χ Pregnancy and lactation.
    χ BMI > 35.
    χ Alcoholic-beverage intake > 14 drinks /wk.
    χ Renal insufficiency.
    N screened
    = 8813
    Nstart run-in
    = 502

    View Slide

  20. Screening
    Blood pressure measurement:
    3 visitations - 1 week in 
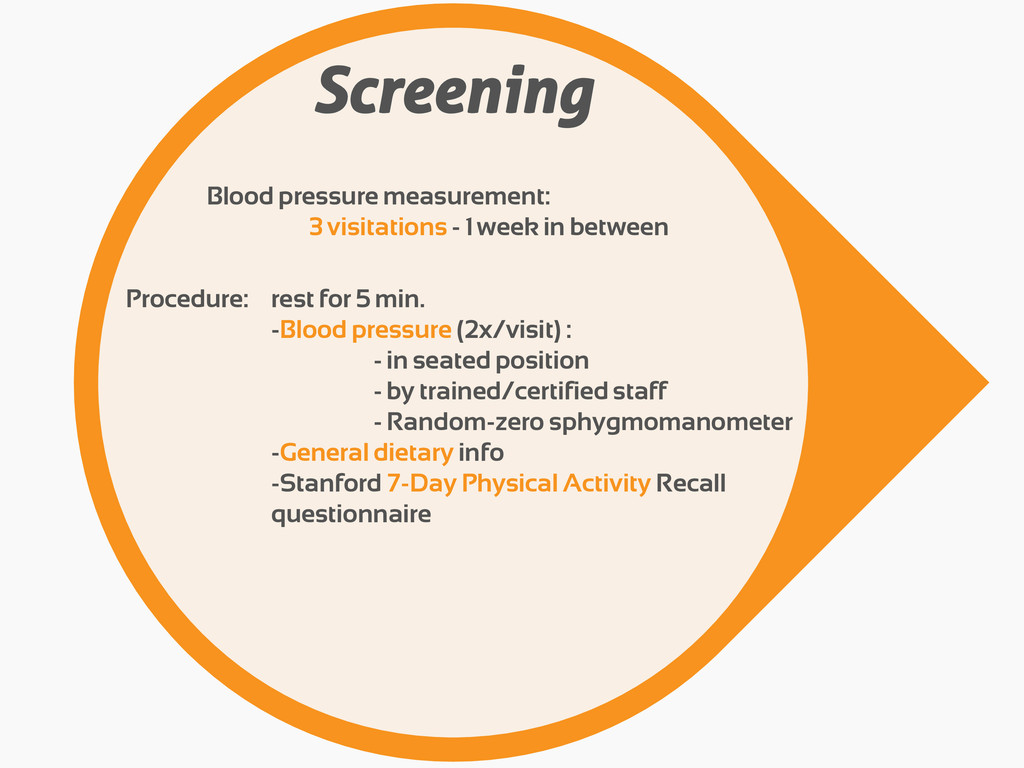
between
    rest for 5 min.
    -Blood pressure (2x/visit) :
    - in seated position
    - by trained/certified staff
    - Random-zero sphygmomanometer
    -General dietary info
    -Stanford 7-Day Physical Activity Recall
    questionnaire
    Procedure:

    View Slide

  21. Run-In
    Measurements :
    • Blood pressure = 4 
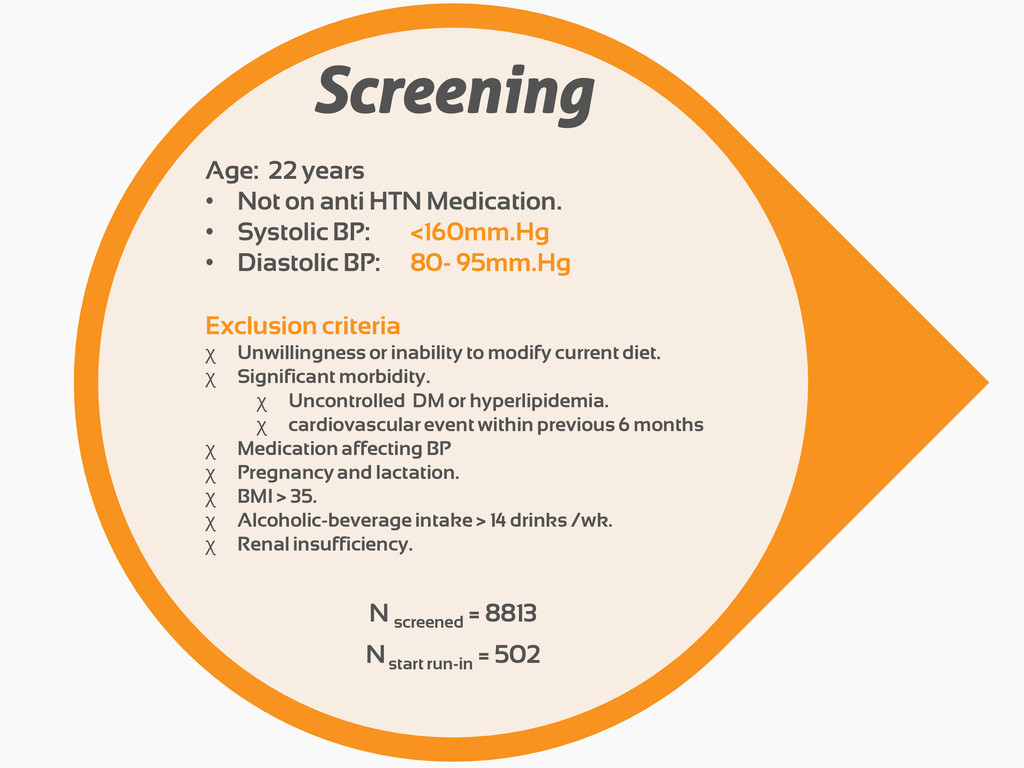
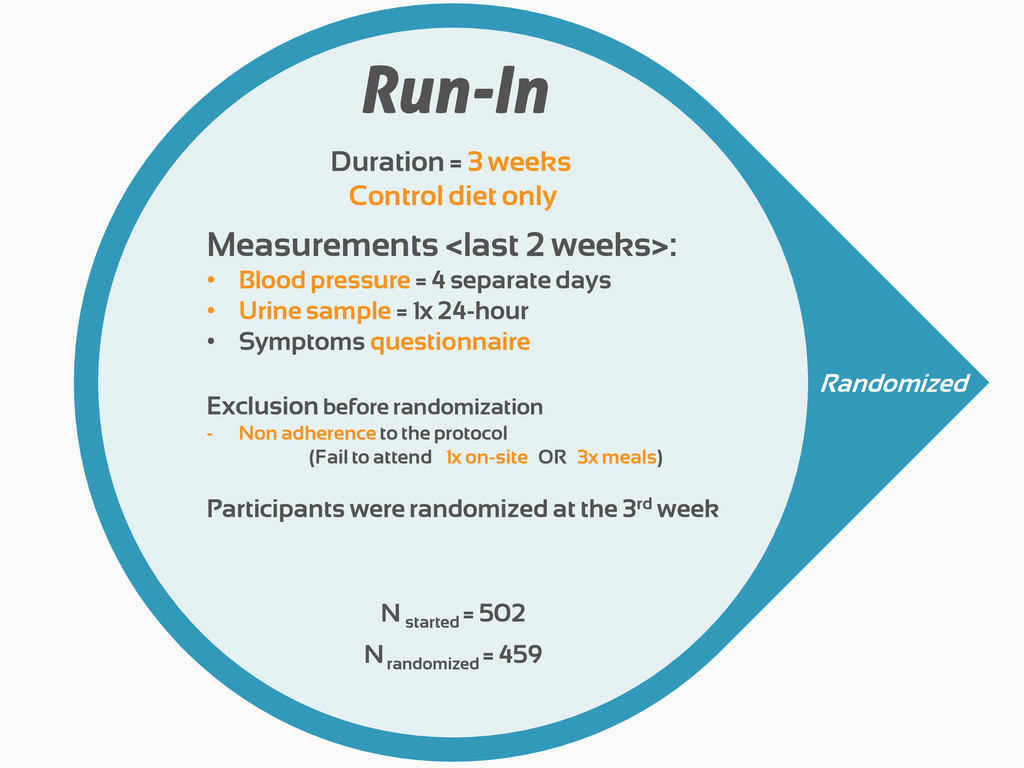
separate days
    • Urine sample = 1x 24-hour
    • Symptoms questionnaire
    Exclusionbefore randomization
    - Non adherence to the protocol
    (Fail to attend 1x on-site OR 3x meals)
    Participants were randomized at the 3rd week
    Duration = 3 weeks
    Control diet only
    N started
    = 502
    Nrandomized
    = 459
    Randomized

    View Slide

  22. Sample population being randomized
    distribution
    0
    10
    20
    30
    40
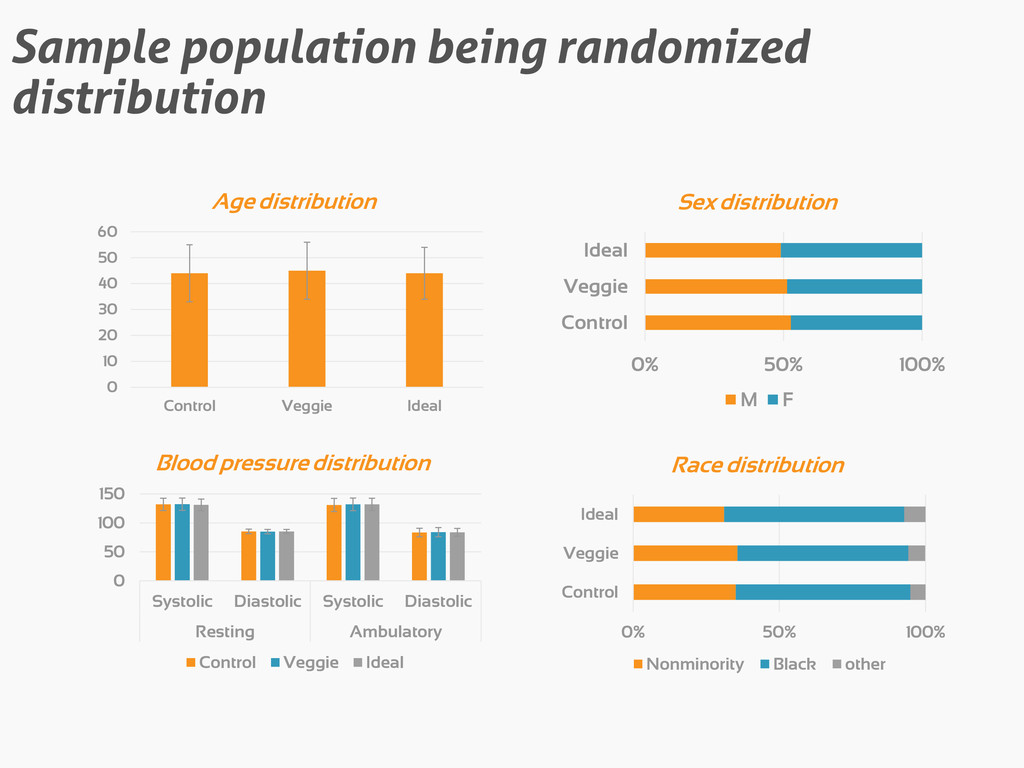
    50
    60
    Control Veggie Ideal
    Age distribution
    0% 50% 100%
    Control
    Veggie
    Ideal
    Sex distribution
    M F
    0% 50% 100%
    Control
    Veggie
    Ideal
    Race distribution
    Nonminority Black other
    0
    50
    100
    150
    Systolic Diastolic Systolic Diastolic
    Resting Ambulatory
    Blood pressure distribution
    Control Veggie Ideal

    View Slide

  23. Duration = 8 weeks
    Control vs. Veggie vs. Ideal
    Total:
    N ITT
    = 459
    NPP
    = 446
    Intervention
    Measurement with staffs blinded
    • 1st 6 weeks:
    • Blood pressure (Rest) = 1x/wk
    • Last 2 wks:
    • Blood pressure = 5 separate days
    • Urine sample = 1x/24-hour
    • 1x questionnaire on symptoms
    • 1x Stanford 7-Day Physical Activity
    Recall questionnaire
    Begin: immediately
    after Run-In period

    View Slide

  24. Duration = 8 weeks
    Control vs. Veggie vs. Ideal
    Total:
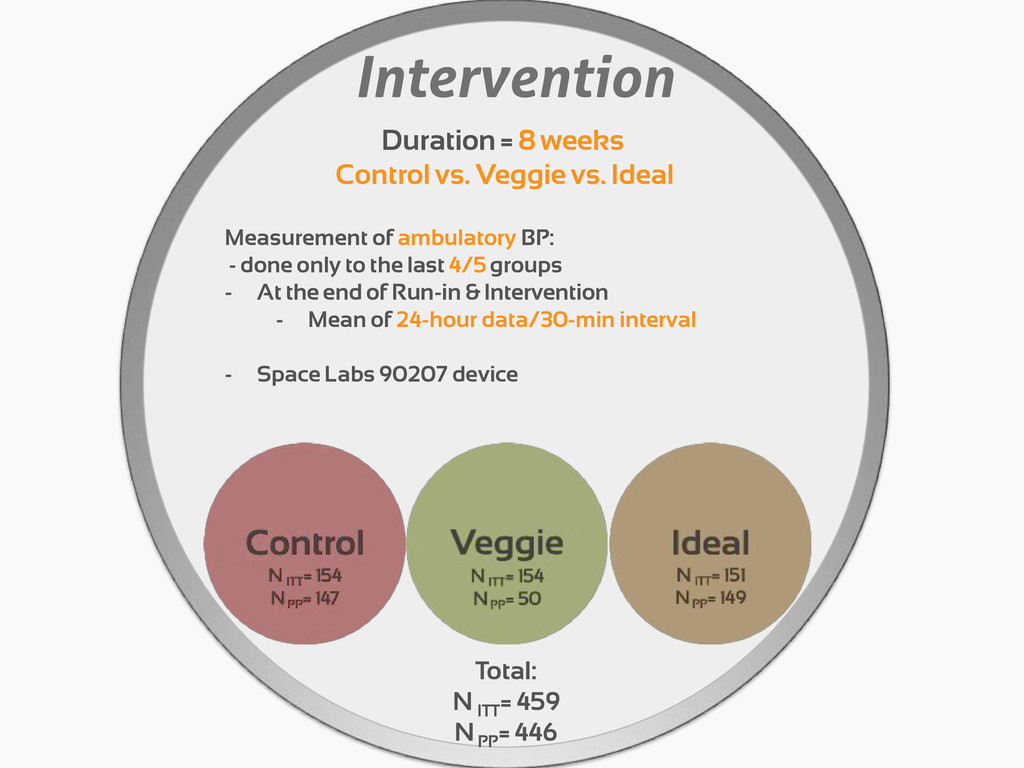
    N ITT
    = 459
    NPP
    = 446
    Intervention
    Measurement of ambulatory BP:
    - done only to the last 4/5 groups
    - At the end of Run-in & Intervention
    - Mean of 24-hour data/30-min interval
    - Space Labs 90207 device

    View Slide

  25. Statistical analysis plan
    H0
    = No difference between all diets
    3 alternate hypothesis:
    1. Ideal ≠ Control
    2. Fruits & vegetables ≠ Control
    3. Ideal ≠ Fruits & vegetables
    Power =85%
    ∆ =2 mm.Hg of Diastolic BP
    Analysis population:
    Statistical test:
    Statistical significance:
    Intention-to-treat
    2-way ANOVA
    at P<0.025 (97.5% CI)
    Test (table 4):
    1. ∆Ideal - ∆Control
    2. ∆Fruits & vegetables - ∆Control
    3. ∆Ideal - ∆Fruits & vegetables

    View Slide

  26. -300
    200
    700
    1200
    1700
    2200
    2700
    3200
    Control Veggie Ideal
    Changes of excreted minerals
    -based on urine samples
    K⁺ Mg⁺⁺ Urea N⁺ Ca⁺⁺ P⁺⁺⁺ Na⁺

    View Slide

  27. -250
    -200
    -150
    -100
    -50
    0
    50
    100
    150
    Control Veggie Ideal
    Changes of excreted minerals
    - Mg, Ca, P, Na
    Mg⁺⁺ Ca⁺⁺ P⁺⁺⁺ Na⁺

    View Slide

  28. -8
    -7
    -6
    -5
    -4
    -3
    -2
    -1
    0
    1
    Systolic Diastolic Systolic Diastolic
    Resting Ambulatory
    mmHg
    The change of BP between each dietary group
    I-C I-V V-C

    View Slide

  29. 131.3
    84.7
    129.6
    84.8
    133
    84.5
    131.5
    84.8
    130.9
    84.5
    126.2
    83
    143.7
    88.8
    Systolic
    Diastolic
    Baseline BP of each subgroup
    HTN Non-HTN Non-minority
    Minority Female Male
    All
    -10
    -8
    -6
    -4
    -2
    0
    2
    Systolic Diastolic Systolic Diastolic
    Male Female
    -10
    -8
    -6
    -4
    -2
    0
    2
    Systolic Diastolic Systolic Diastolic
    Minority Non-minority
    -16
    -14
    -12
    -10
    -8
    -6
    -4
    -2
    0
    2
    Systolic Diastolic Systolic Diastolic
    HTN Non-HTN
    I-C I-V V-C

    View Slide

  30. 120
    122
    124
    126
    128
    130
    132
    Baseline 1 2 3 4 5 6 7&8
    Systolic Control Systolic Veggie Systolic Ideal
    74
    76
    78
    80
    82
    84
    86
    88
    Baseline 1 2 3 4 5 6 7&8
    Diastolic Control Diastolic Veggie Diastolic Ideal
    Progress of BP changes for each diet
    -means of each week

    View Slide

  31. Safety consideration
    Persons whose BP rise to levels necessitating referral are excluded from further
    participation if they are treated with medications.
    If BP:
    Systolic: > 170 mmHg
    Diastolic: > 105 mmHg
    OR
    Systolic: > 180 mmHg
    Diastolic: > 110 mmHg
    OR
    Rechecked:
    next visit (following week)
    Remain above limit:
    Physician referral
    Immediate referral

    View Slide

  32. Conclusion
    • The most effective diet is rich in
    fruits, 
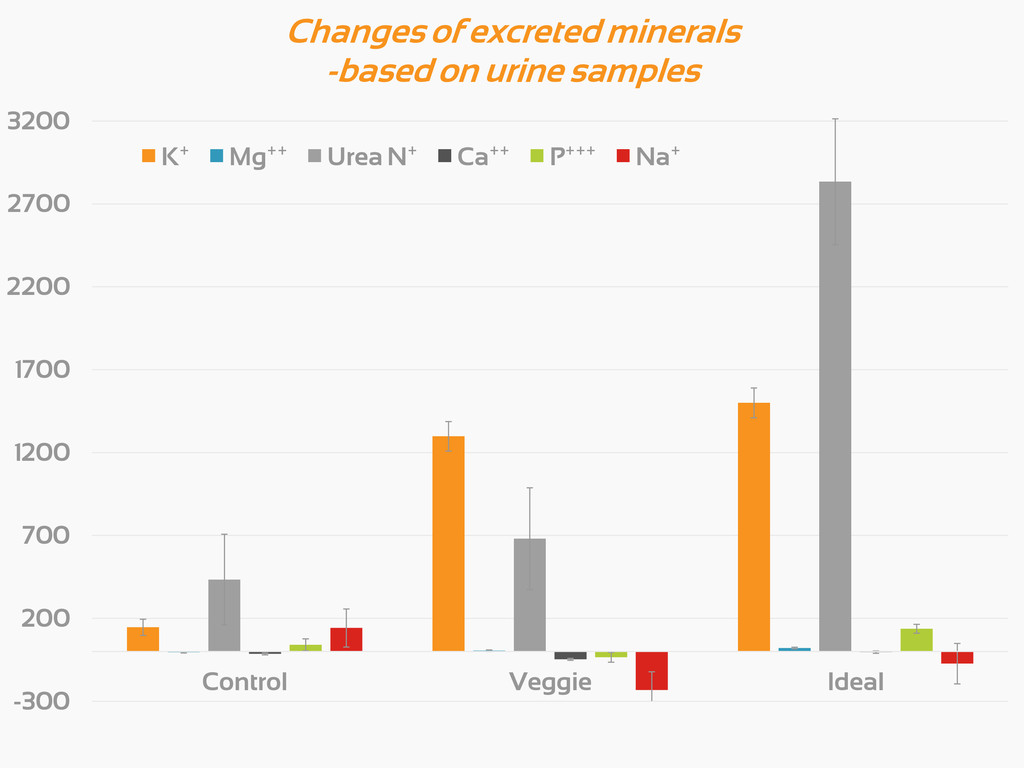
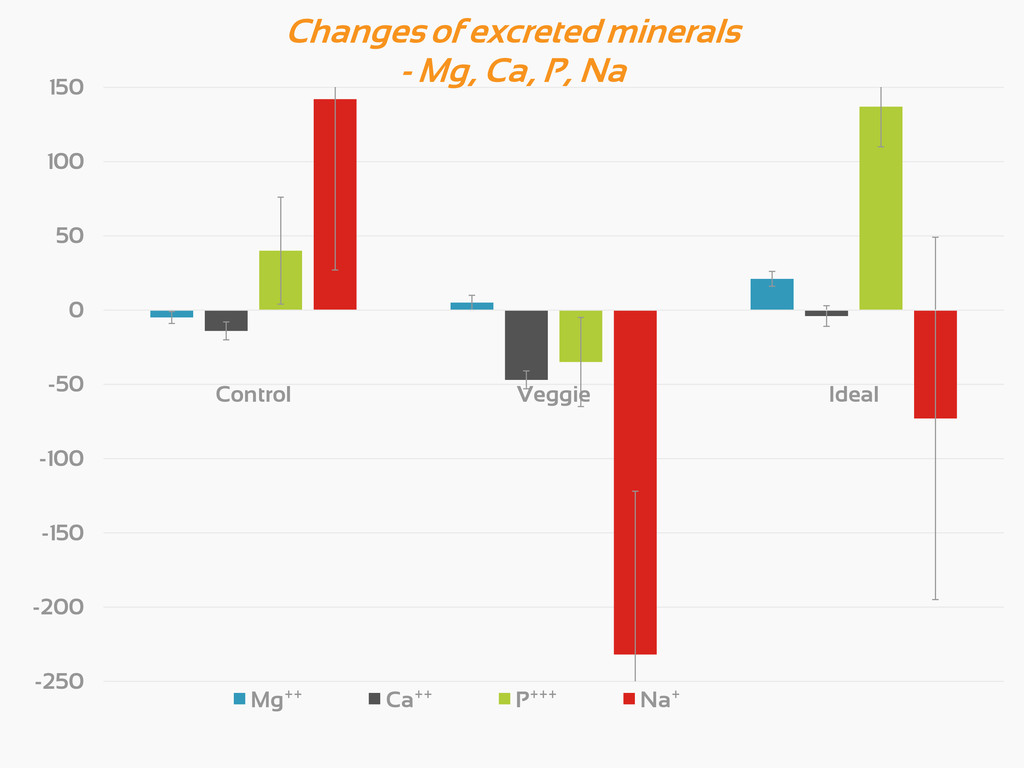
vegetable, low fat dairy,
    less saturated & total fat.
    • Ideal diet has similar effect of
    monotherapy used in mild HTN.
    • Applied for the prevention & treatment
    of HTN.
    • Ideal diet may reduce the occurrence of
    HTN-related cardiovascular diseases.
    Observation
    • Reduction of BP
    • started by 2nd week
    • But varied/increased
    around the last few weeks
    • Why smoking was not
    mentioned?
    • Unexpected Ca++ excretion on Veggie
    and Ideal diets

    View Slide

  33. Strength
    • Multicenter and large number of subjects.
    • Provision 
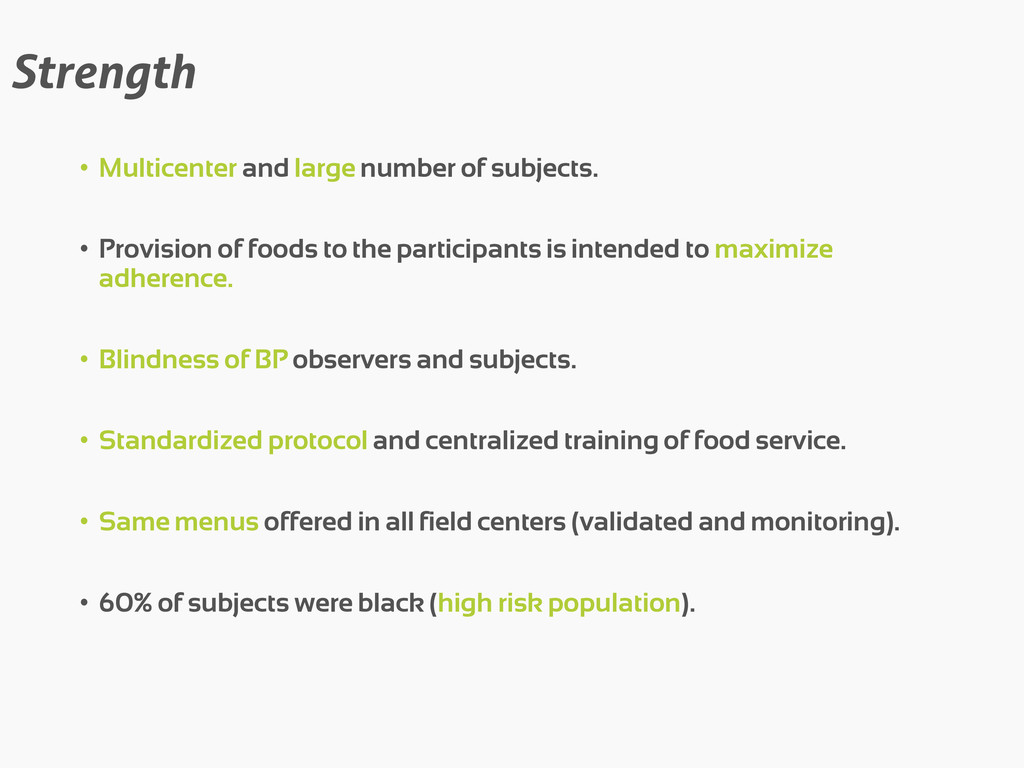
of foods to the participants is intended to maximize
    adherence.
    • Blindness of BP observers and subjects.
    • Standardized protocol and centralized training of food service.
    • Same menus offered in all field centers (validated and monitoring).
    • 60% of subjects were black (high risk population).

    View Slide

  34. Strength, cont.
    • Study the effect of the 3 different 
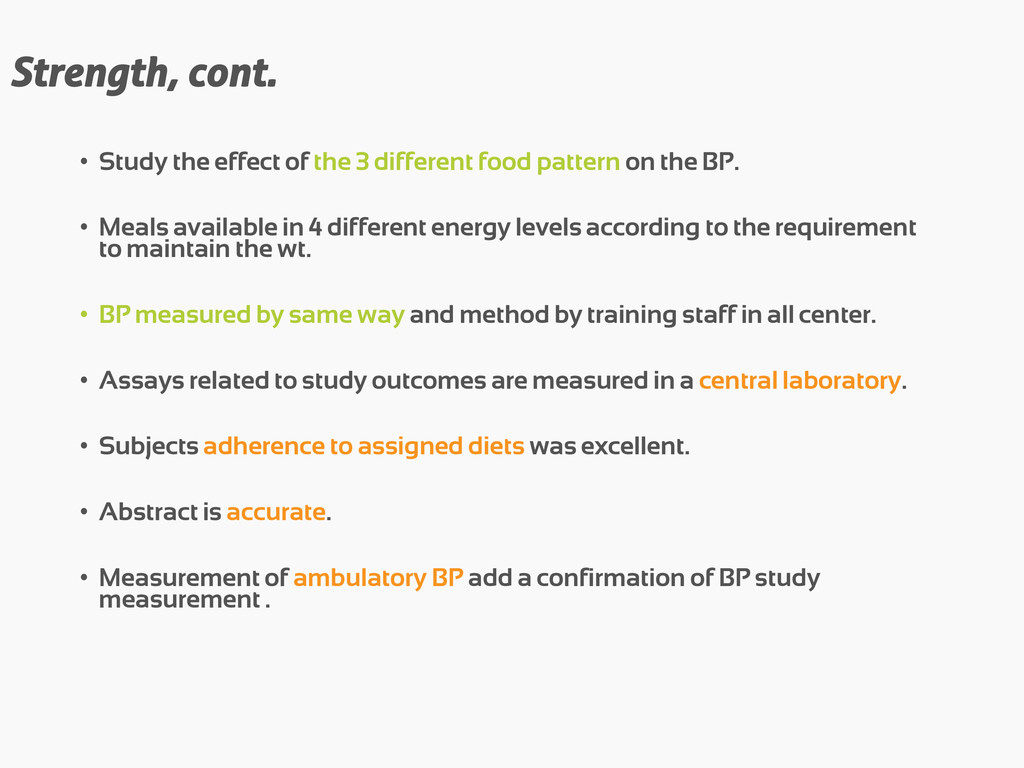
food pattern on the BP.
    • Meals available in 4 different energy levels according to the requirement
    to maintain the wt.
    • BP measured by same way and method by training staff in all center.
    • Assays related to study outcomes are measured in a central laboratory.
    • Subjects adherence to assigned diets was excellent.
    • Abstract is accurate.
    • Measurement of ambulatory BP add a confirmation of BP study
    measurement .

    View Slide

  35. Limitation
    • the participants do have to make some life-style 
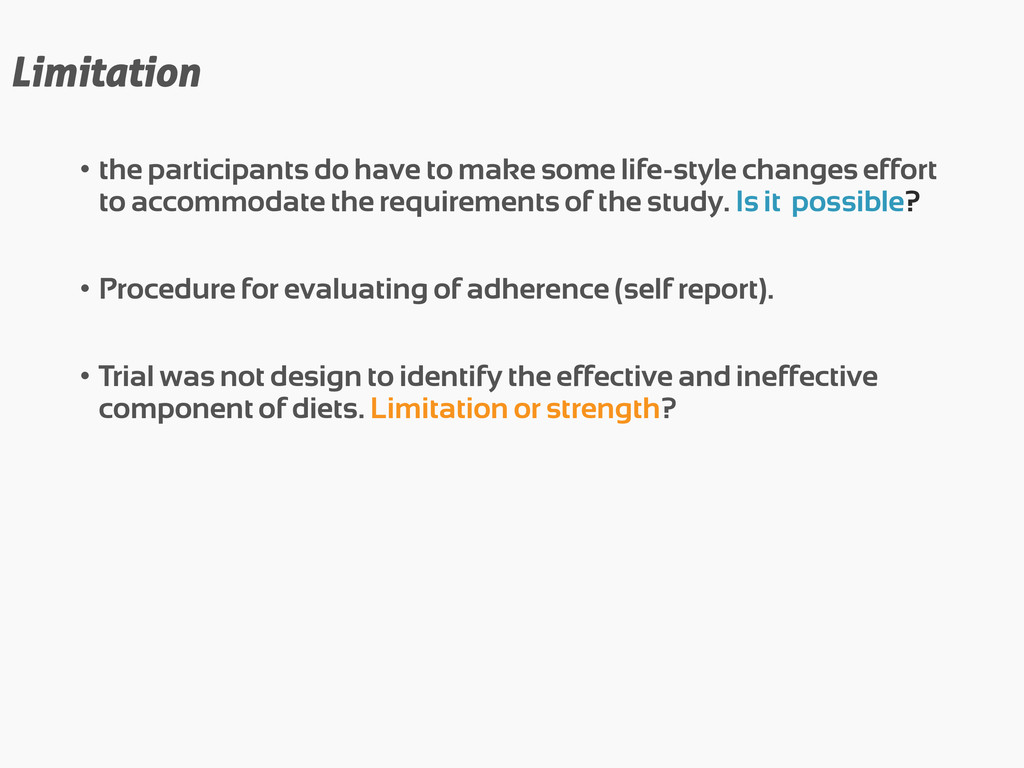
changes effort
    to accommodate the requirements of the study. Is it possible?
    • Procedure for evaluating of adherence (self report).
    • Trial was not design to identify the effective and ineffective
    component of diets. Limitation or strength?

    View Slide

  36. Weakness
    • Generalizability.
    • No control of smoke.
    • 8 weeks intervention study is short period.

    View Slide

  37. Future plan
    • Assess the affect of the diets on 
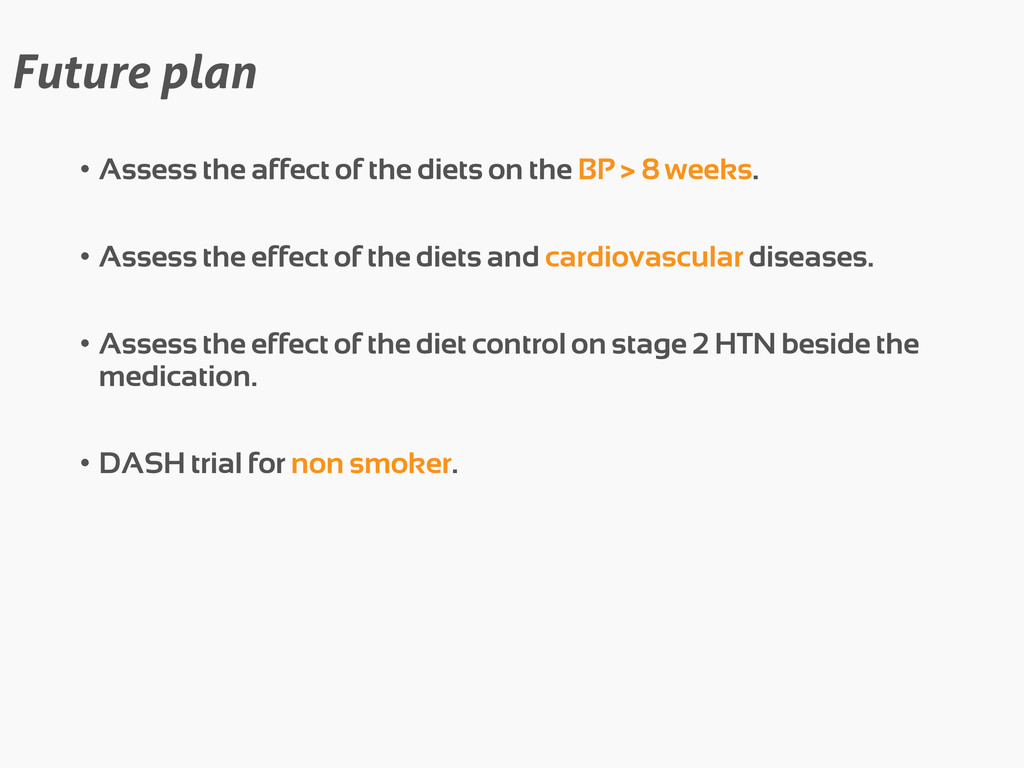
the BP > 8 weeks.
    • Assess the effect of the diets and cardiovascular diseases.
    • Assess the effect of the diet control on stage 2 HTN beside the
    medication.
    • DASH trial for non smoker.

    View Slide

  38. Discussion
    after the study prove the effect of dietary pattern on BP,
    do you think the prevalence of HTN since 1997 is
    increase, decrease, or same?

    View Slide

  39. View Slide

  40. Public health implication of trial results
    • Prevention of HTN
    • In HTN pts. Ideal diet alternative of the medication in stage 1
    HTN.
    • Reduction of the occurrence of HTN-related cardiovascular
    disease by 15% and stroke by 27%

    View Slide

  41. As 0f 2013
    Based on NHLBI guideline:
    • Healthy diet
    • Lower Na+ and salts
    • Healthy weight
    • Physically active
    • Limit alcohol
    • Quit smoking
    Na+
    Thank you for listening

    View Slide