Upgrade to Pro — share decks privately, control downloads, hide ads and more …

Test suite evaluation for fun and profit

Test suite evaluation for fun and profit

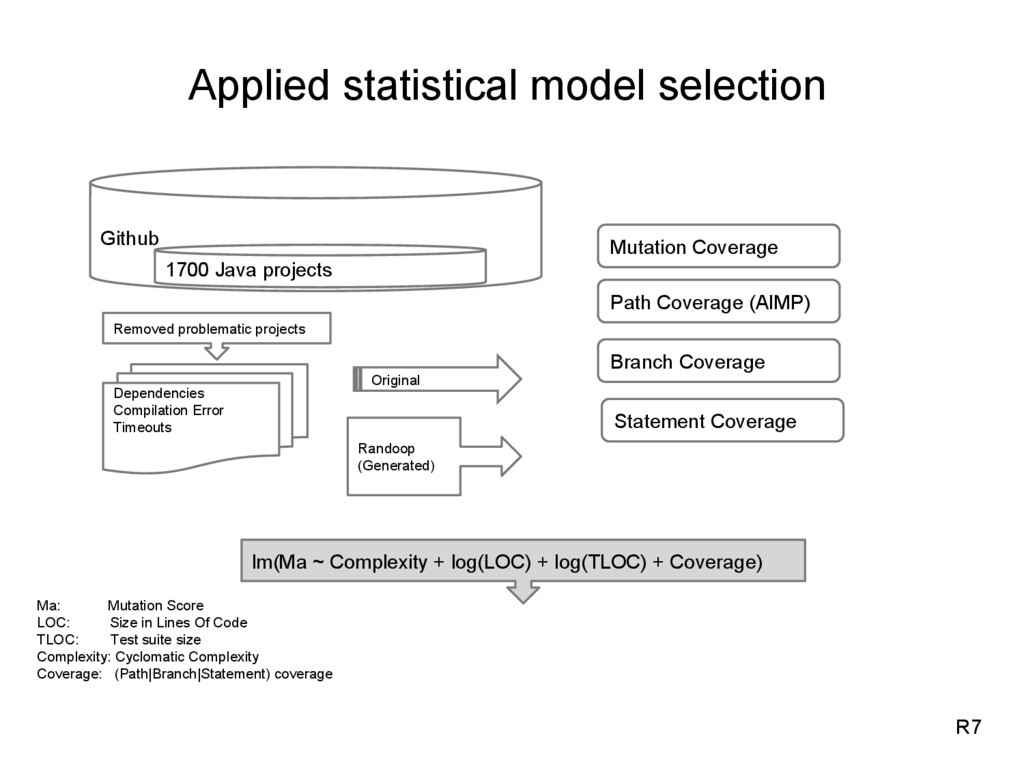
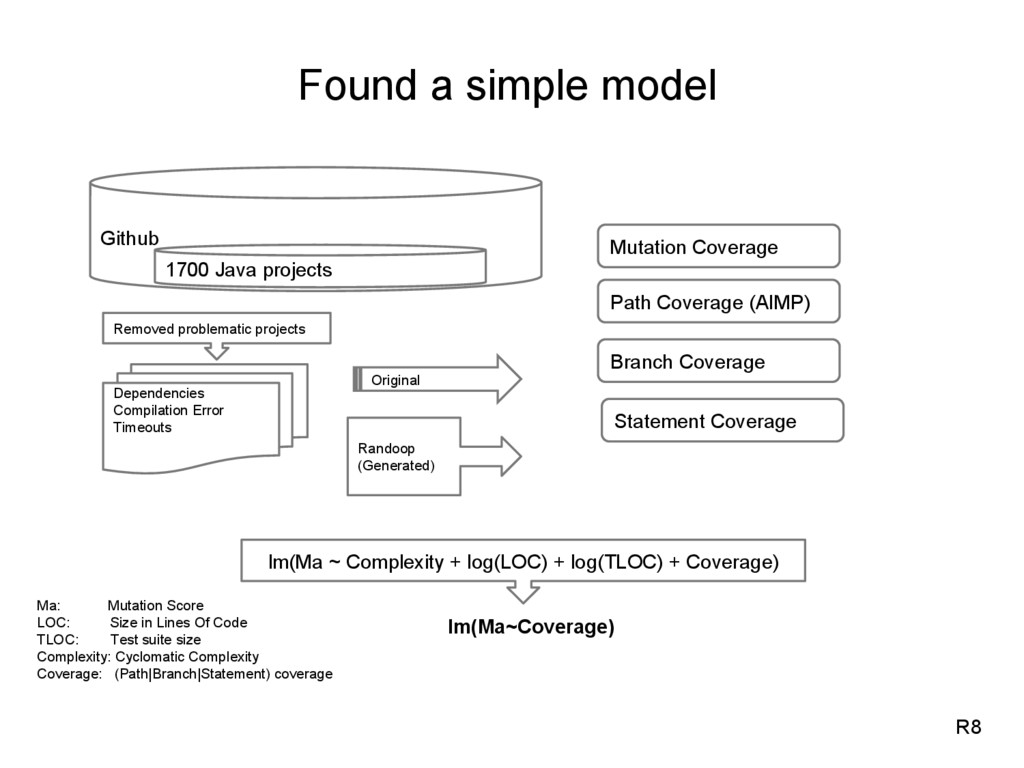
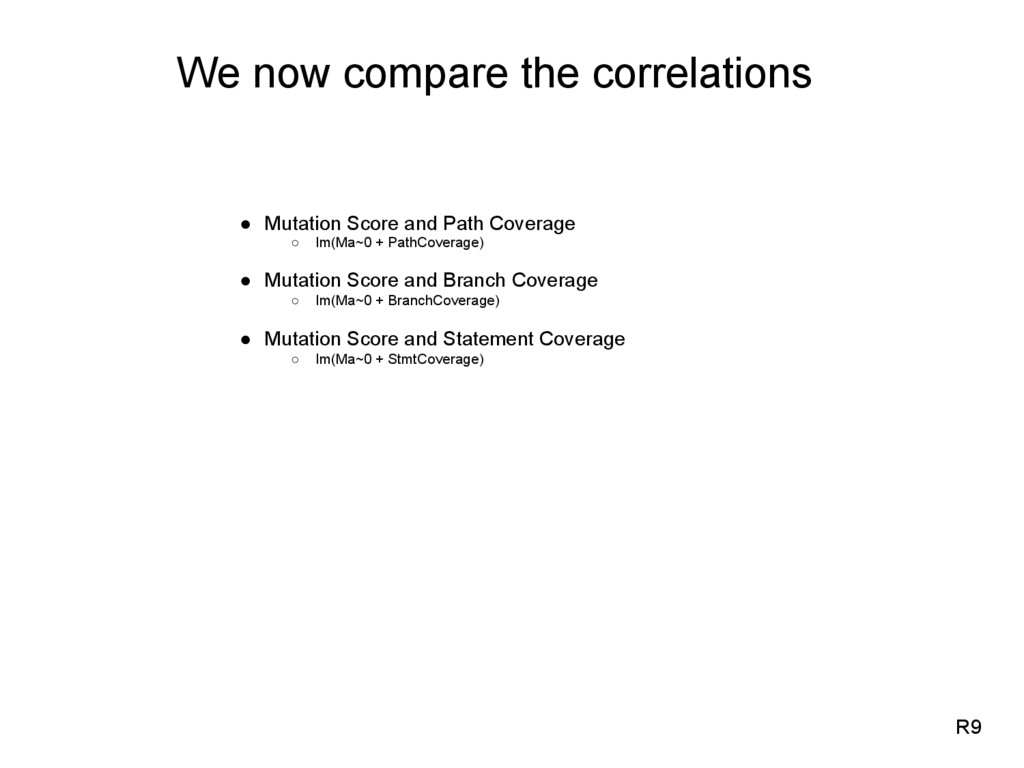
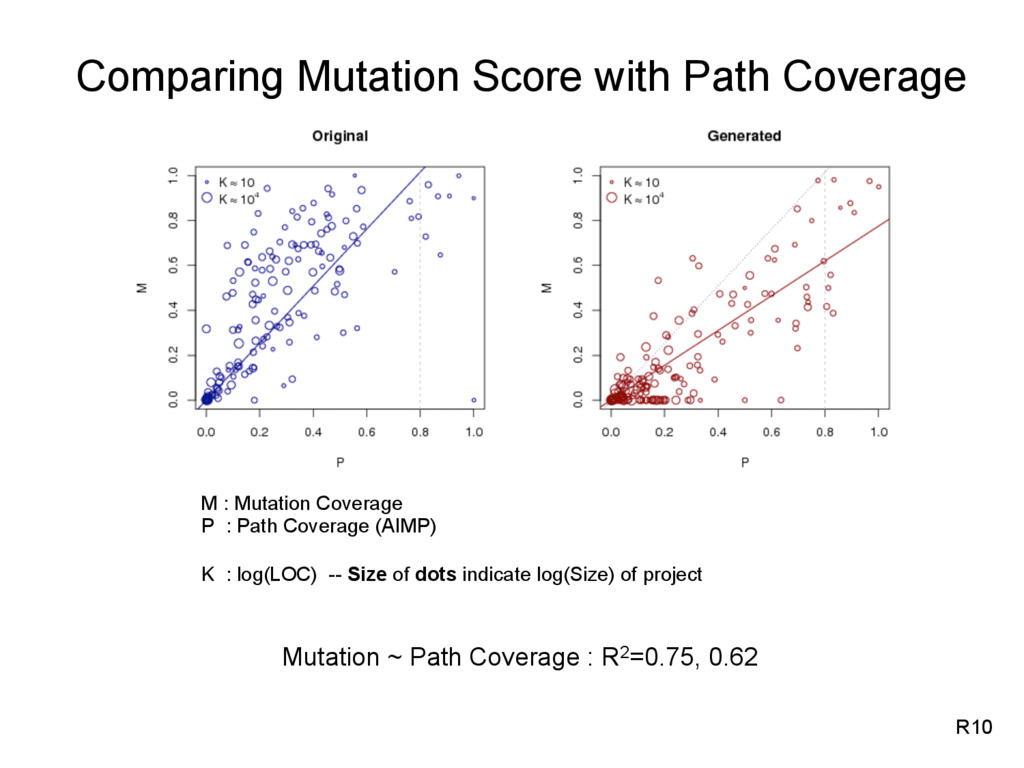
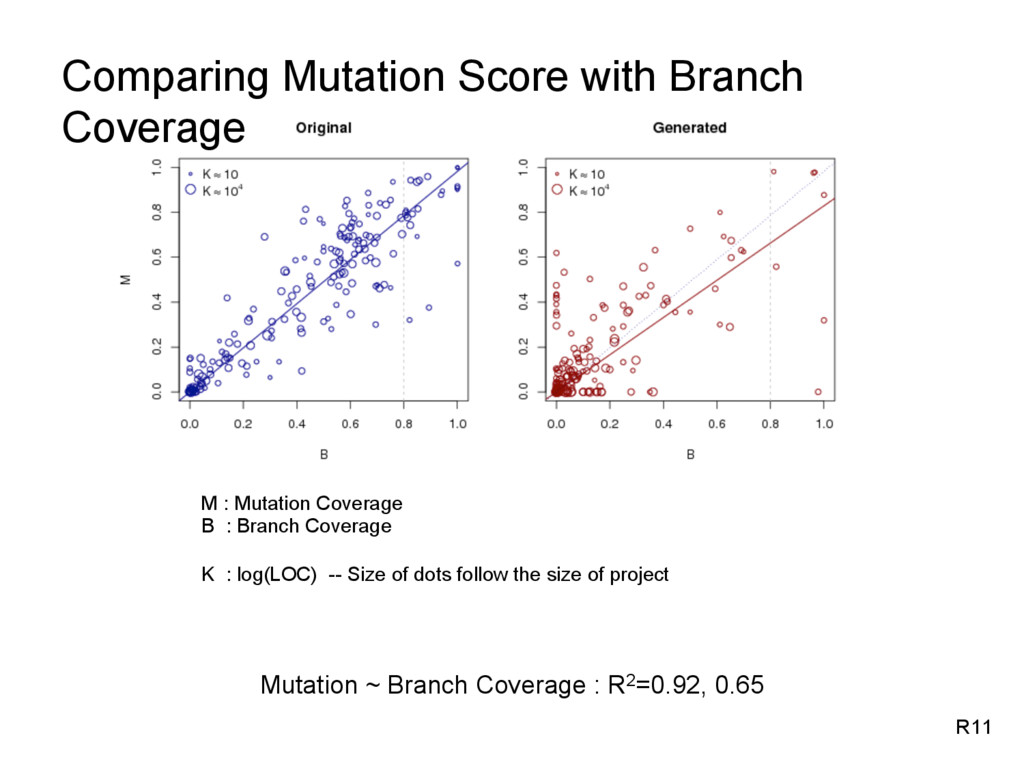
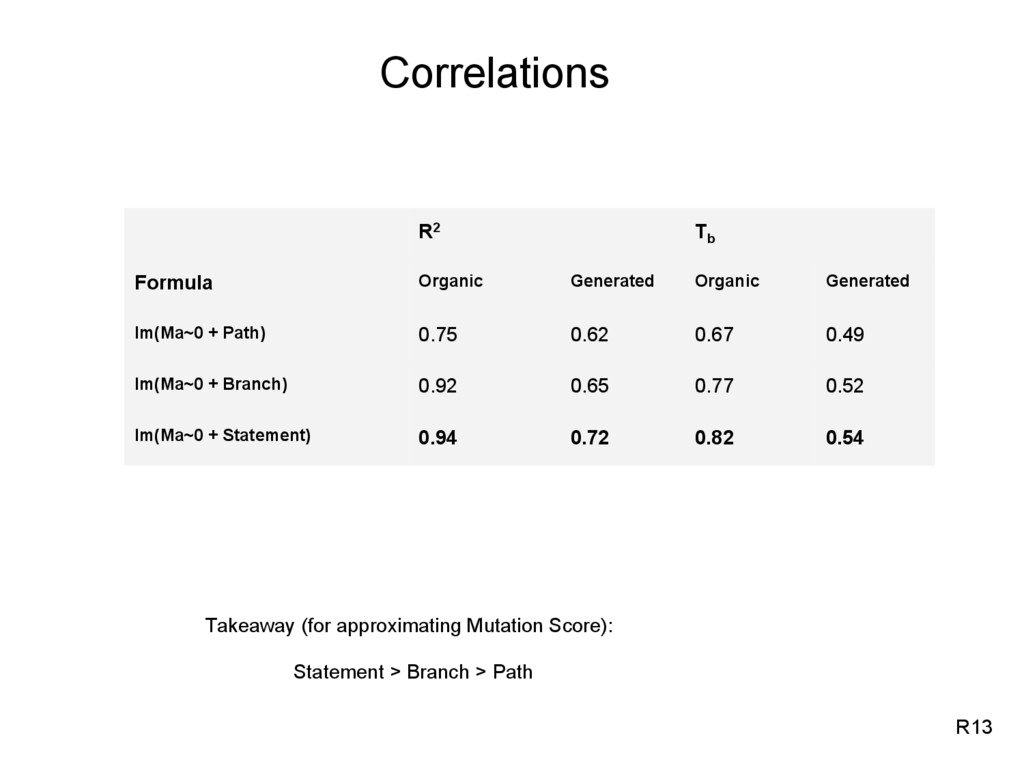
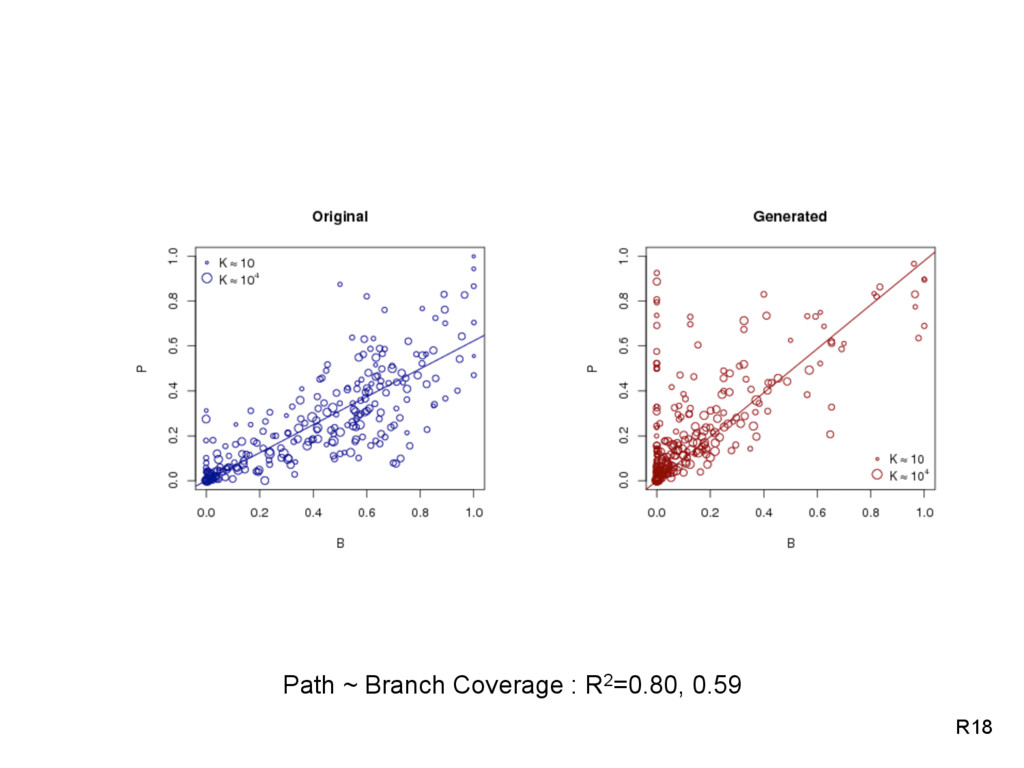
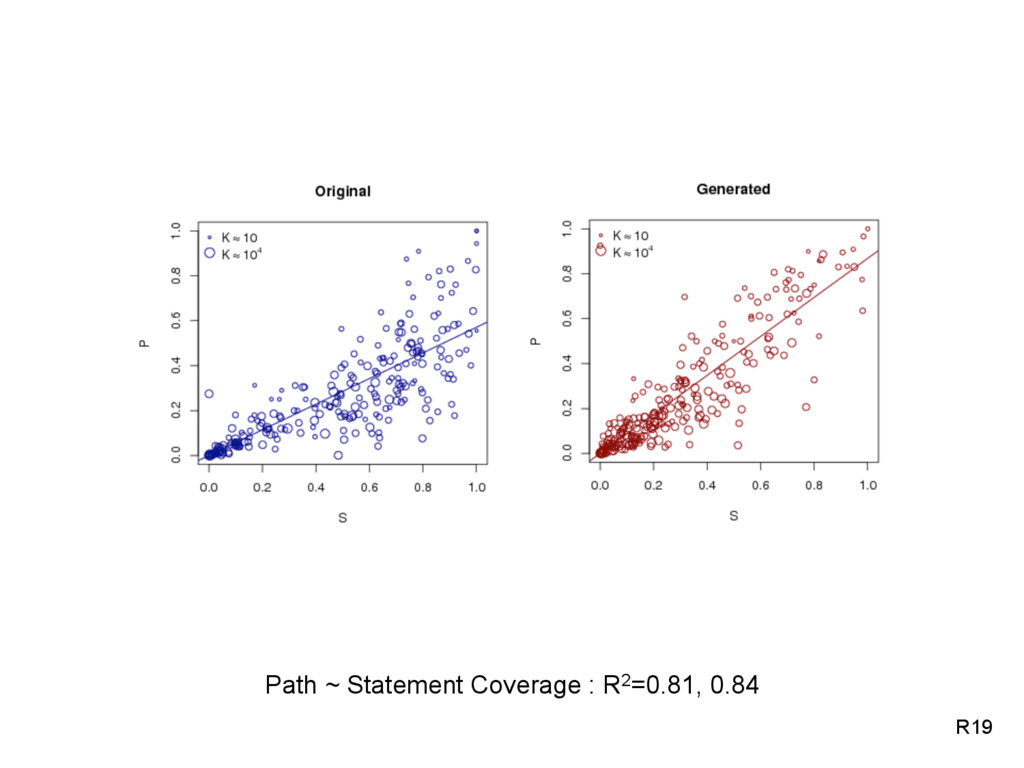
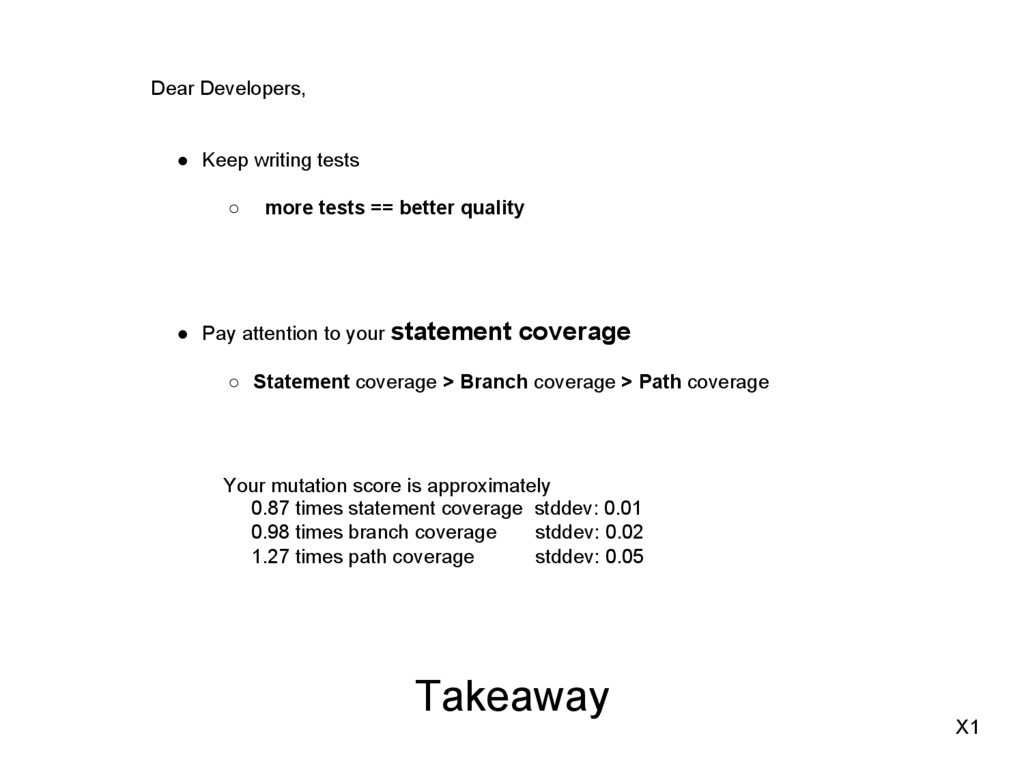
One of the key challenges of developers testing code is determining a test suite's quality -- its ability to find faults. The most common approach is to use code coverage as a measure for test suite quality, and diminishing returns in coverage or high absolute coverage as a stopping rule. In testing research, suite quality is often evaluated by a suite's ability to kill mutants (artificially seeded potential faults). Determining which criteria best predict mutation kills is critical to practical estimation of test suite quality. Using suites (both manual and automatically generated) from a large set of real-world open-source projects shows that evaluation results differ from those for suite-comparison: statement (not block, branch, or path) coverage predicts mutation kills best.

Rahul Gopinath

July 12, 2014
Tweet

More Decks by Rahul Gopinath

Other Decks in Research

Transcript

  1. Test suite evaluation For fun and profit Rahul Gopinath, Carlos

    Jensen, Alex Groce Code Coverage for Suite Evaluation by Developers ICSE 2014
  2. Why not inject a few bugs and see if we

    can catch them? M2 Test Adequacy Criteria
  3. Here be mutants x ++ If x = 0 If

    y > 0 y ++ no yes no yes x ++ If x < 0 If y > 0 y ++ no yes no yes x ++ If x > 0 If y < 0 y ++ no yes no yes x ++ If x > 0 If y = 0 y ++ no yes no yes x -- If x > 0 If y > 0 y ++ no yes no yes x ++ If x > 0 If y > 0 y -- no yes no yes Syntactically similar programs. M3
  4. Here be mutants x ++ If x = 0 If

    y > 0 y ++ no yes no yes x ++ If x < 0 If y > 0 y ++ no yes no yes x ++ If x > 0 If y < 0 y ++ no yes no yes x ++ If x > 0 If y = 0 y ++ no yes no yes x -- If x > 0 If y > 0 y ++ no yes no yes x ++ If x > 0 If y > 0 y -- no yes no yes x=1,y=0 =>x=2,y=1 Syntactically similar programs. M3
  5. Here be mutants x ++ If x = 0 If

    y > 0 y ++ no yes no yes x ++ If x < 0 If y > 0 y ++ no yes no yes x ++ If x > 0 If y < 0 y ++ no yes no yes x ++ If x > 0 If y = 0 y ++ no yes no yes x -- If x > 0 If y > 0 y ++ no yes no yes x ++ If x > 0 If y > 0 y -- no yes no yes x=1,y=0 =>x=2,y=1 x=1,y=1 =>x=2,y=1 Syntactically similar programs. M3
  6. Here be mutants x ++ If x = 0 If

    y > 0 y ++ no yes no yes x ++ If x < 0 If y > 0 y ++ no yes no yes x ++ If x > 0 If y < 0 y ++ no yes no yes x ++ If x > 0 If y = 0 y ++ no yes no yes x -- If x > 0 If y > 0 y ++ no yes no yes x ++ If x > 0 If y > 0 y -- no yes no yes x=1,y=0 =>x=2,y=1 x=1,y=1 =>x=2,y=1 x=0,y=1 =>x=0,y=1 Syntactically similar programs. M3
  7. Here be mutants x ++ If x = 0 If

    y > 0 y ++ no yes no yes x ++ If x < 0 If y > 0 y ++ no yes no yes x ++ If x > 0 If y < 0 y ++ no yes no yes x ++ If x > 0 If y = 0 y ++ no yes no yes x -- If x > 0 If y > 0 y ++ no yes no yes x ++ If x > 0 If y > 0 y -- no yes no yes x=1,y=0 =>x=2,y=1 x=1,y=1 =>x=2,y=1 x=0,y=1 =>x=0,y=1 x=0,y=0 =>x=0,y=1 Syntactically similar programs. M3
  8. What is Mutation Analysis Mutation analysis is a method of

    systematically introducing simple syntactic changes to the program, and measuring the capability of the test-suite in detecting these changes. The mutation score is measured as # mutants killed # mutants produced M6
  9. Traditional Strategies to counter mutant explosion M7 Lots of Research

    Fewer (Reduce Mutants) Faster (Optimize mutation run) Smarter (Parallelize mutation analysis) Original Computation Time Computation required for a single mutant
  10. So Cheat Do we have a way to predict mutation

    coverage? (without actually doing it) We were not the first ones to attempt it. •  Branch coverage can approximate mutation score [GroceISSTA13] So what did we do different? We changed the scale of sampling •  Previous research looks at ~30 standard programs •  Our research uses hundreds. R1 Up, Right, A, B, A, Down, A, L, L
  11. We changed the scale of sampling R2 Github 1700 Java

    projects The first 1700 Java projects that used Maven We don’t expect Github ordering to affect our results
  12. Removed bad projects R3 Github 1700 Java projects Dependencies Compilation

    Error Timeouts Removed problematic projects ~550 projects successfully completed test runs
  13. Checked for bias R4 Total Vs selected projects : Cyclomatic

    Complexity and LOC distribution Look at the similarity of shapes between blue (all) and pink (selected) Very similar => low bias
  14. Collected original and generated test-suites R5 Github 1700 Java projects

    Dependencies Compilation Error Timeouts Removed problematic projects Original Randoop (Generated) Collected organic test-cases (written by authors) ~250 Used Randoop to generate a separate set of test suites. ~250
  15. Collected coverage data R6 Github 1700 Java projects Dependencies Compilation

    Error Timeouts Removed problematic projects Original Randoop (Generated) Mutation Coverage Path Coverage (AIMP) Branch Coverage Statement Coverage
  16. Applied statistical model selection R7 Github 1700 Java projects Dependencies

    Compilation Error Timeouts Removed problematic projects Original Randoop (Generated) Mutation Coverage Path Coverage (AIMP) Branch Coverage Statement Coverage lm(Ma ~ Complexity + log(LOC) + log(TLOC) + Coverage) Ma: Mutation Score LOC: Size in Lines Of Code TLOC: Test suite size Complexity: Cyclomatic Complexity Coverage: (Path|Branch|Statement) coverage
  17. Found a simple model R8 Github 1700 Java projects Dependencies

    Compilation Error Timeouts Removed problematic projects Original Randoop (Generated) Mutation Coverage Path Coverage (AIMP) Branch Coverage Statement Coverage lm(Ma ~ Complexity + log(LOC) + log(TLOC) + Coverage) lm(Ma~Coverage) Ma: Mutation Score LOC: Size in Lines Of Code TLOC: Test suite size Complexity: Cyclomatic Complexity Coverage: (Path|Branch|Statement) coverage
  18. We now compare the correlations •  Mutation Score and Path

    Coverage ◦  lm(Ma~0 + PathCoverage) •  Mutation Score and Branch Coverage ◦  lm(Ma~0 + BranchCoverage) •  Mutation Score and Statement Coverage ◦  lm(Ma~0 + StmtCoverage) R9
  19. Mutation ~ Path Coverage : R2=0.75, 0.62 M : Mutation

    Coverage P : Path Coverage (AIMP) K : log(LOC) -- Size of dots indicate log(Size) of project R10 Comparing Mutation Score with Path Coverage
  20. Mutation ~ Branch Coverage : R2=0.92, 0.65 R11 M :

    Mutation Coverage B : Branch Coverage K : log(LOC) -- Size of dots follow the size of project Comparing Mutation Score with Branch Coverage
  21. R12 Mutation ~ Statement Coverage : R2=0.94, 0.72 M :

    Mutation Coverage S : Statement Coverage K : log(LOC) -- Size of dots follow the size of project Comparing Mutation Score with Line Coverage
  22. Correlations R2 Tb Formula Organic Generated Organic Generated lm(Ma~0 +

    Path) 0.75 0.62 0.67 0.49 lm(Ma~0 + Branch) 0.92 0.65 0.77 0.52 lm(Ma~0 + Statement) 0.94 0.72 0.82 0.54 Takeaway (for approximating Mutation Score): Statement > Branch > Path R13
  23. x ++ If x > 0 If y > 0

    y -- no yes no yes If x > 0 If x > 0 x ++ x ++ If y > 0 If y > 0 y -- y -- R14 Possibilities: •  Simple faults have large semantic impact •  Reachability is sufficient to identify faults in a majority of cases.
  24. New Research: Role of Test Suite Size Statement Coverage and

    log(TLOC) is highly correlated S ~ log(TLOC) = 72% So were we just seeing the effects of test suite size? M~ log(TLOC) = 69% R15
  25. So what does statement coverage get us? Removed effect of

    test suite size statistically residuals(M~0+TLOC)~S = 60% We find a substantial relationship (60%) for statement coverage with mutation score after discounting effects of test suite size. R16
  26. Takeaway Dear Developers, •  Keep writing tests ◦  more tests

    == better quality •  Pay attention to your statement coverage ◦  Statement coverage > Branch coverage > Path coverage Your mutation score is approximately 0.87 times statement coverage stddev: 0.01 0.98 times branch coverage stddev: 0.02 1.27 times path coverage stddev: 0.05 X1
  27. Food for thought •  Faults from mutation analysis seems really

    easy to detect ◦  Are they representative of real faults? For Researchers X2