Upgrade to Pro — share decks privately, control downloads, hide ads and more …

Atlas

 Atlas

GO-JEK’s real-time geospatial visualization platform

Ravi Suhag

April 18, 2018
Tweet

More Decks by Ravi Suhag

Other Decks in Technology

Transcript

  1. ONE APP FOR ALL YOUR NEEDS Established in 2010 as

    a motorcycle ride-hailing phone based service, GO-JEK has evolved into an on-demand provider of transport and other lifestyle services. GO-JEK?
  2. At GO-JEK, location is built into the fabric of all

    our products 2,000,000,000 + GPS points daily
  3. What is Atlas? Geospatial data analysis Maps to actionable insights

    Automated metric pipeline Extensible viz layer architecture
  4. Why Atlas? Real-time information of the resource distribution. e.g. current

    supply and demand Rich exploratory interfaces to tackle multidimensional data for experimental analysis. and more…
  5. { name: 'choropleth', description: 'S2 cell analysis', dimensions:[ { name:

    'color', description: 'Color of the bars', type: 'number', required: 'false', identifier: { title: 'S2 Cell Id', description: 'S2 cell on the choropleth', type: 's2id' } }, { name: 'elevation', description: 'Height of the bars', type: 'number', required: 'false', identifier: { title: 'S2 Cell Id', description: 'S2 cell on the choropleth', type: 's2id' } } ] } Layer schema
  6. { name: "demand", description: "Demand by S2 ids", frequency: 60000,

    status: "online", delay: 0, scale: { factor: 1, name: "linear" } tags: [{ name: "service_type", type: "string", description: "Service Type", filter: true, classification: "enum" }, { name: "s2id", type: "s2id", description: "S2 id of the cell", filter: false, classification: "enum" }], "fields": [{ name: "unique_customers", type: "number", aggregation: "sum", description: "No. of unique customers" }] } Metric schema
  7. Layer slection: Pick your visualization layer from heatmaps, data clusters,

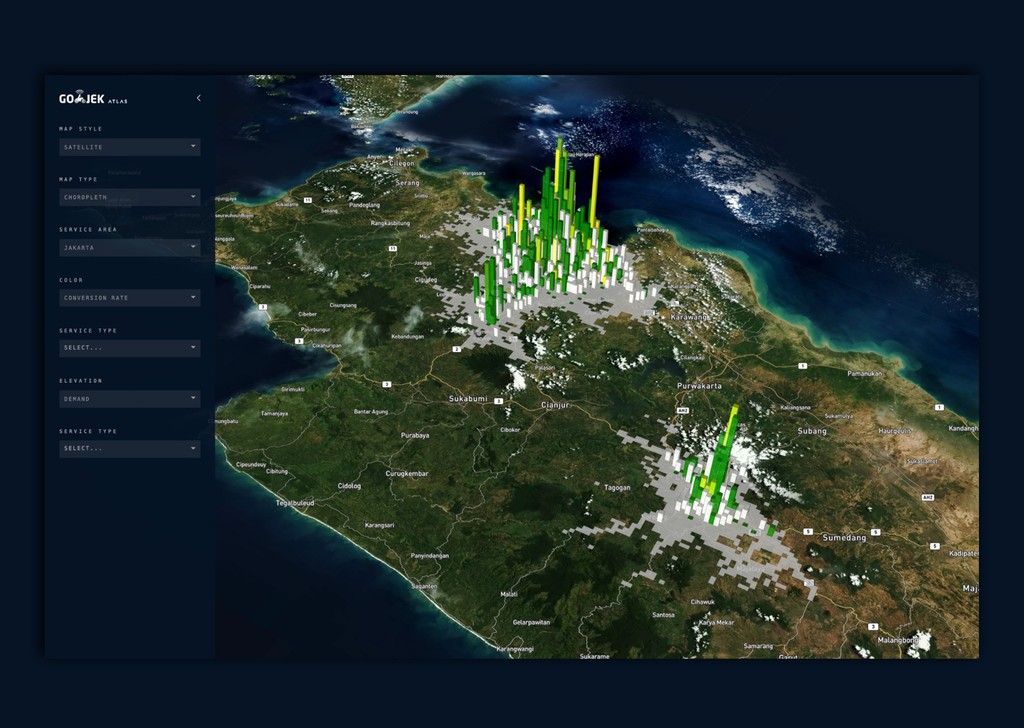
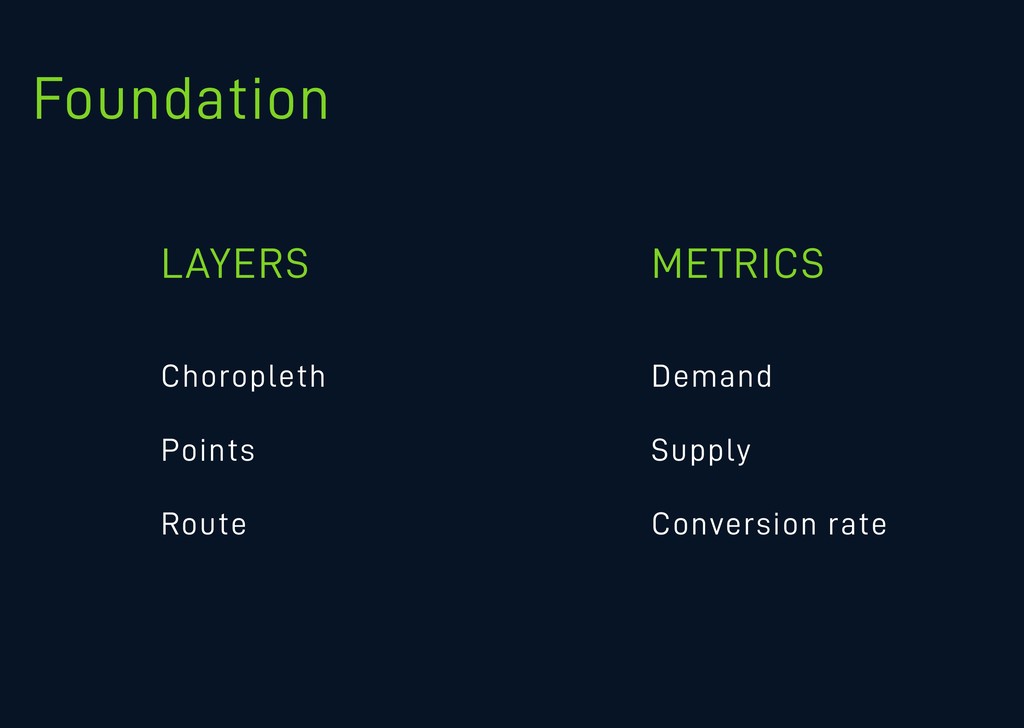
    2D/3D choropleths, and more. Metric selection: Flexible mapping of dimensions and data metrics allow exploratory analysis. START DATE 15/07/2017 END DATE 15/07/2017 START TIME 15/07/2017 END TIME 15/07/2017 COLOR ACCEPTANCE RATE FACTOR 0.04 FACTOR 0.04 ALTITUDE CONVERSION RATE SERVICE TYPE GO CAR SERVICE AREA JAKARTA 2D MAP CHOROPLETH HEATMAP ROUTES MAP TYPE REALTIME TIME
  8. Cell Panel: Explore detailed data of layer’s cell. e.g. number

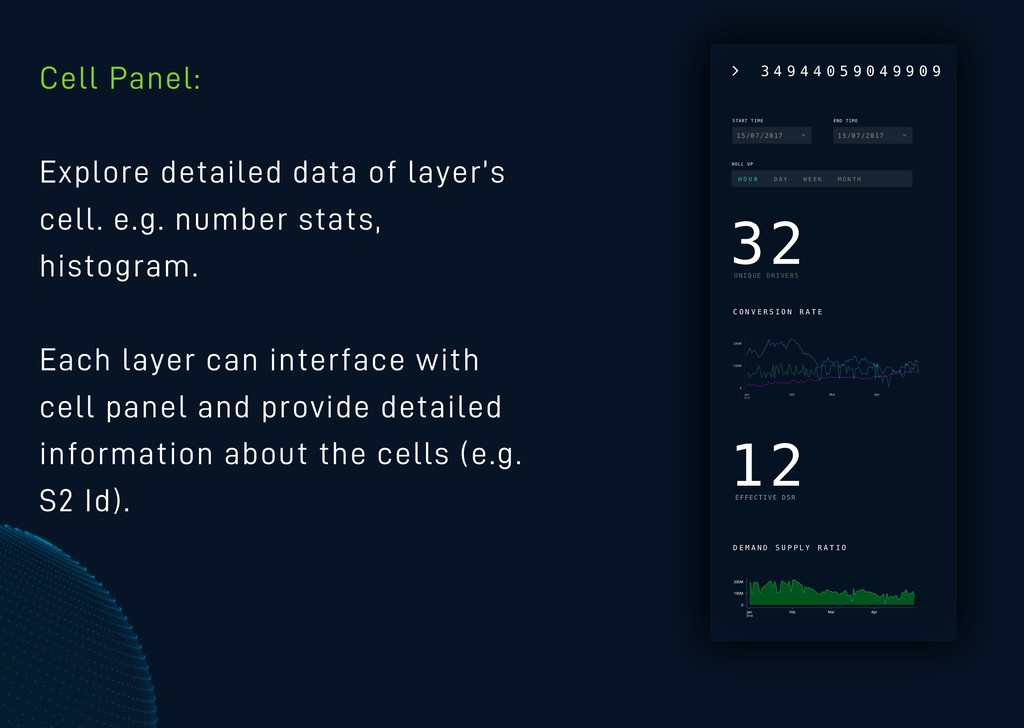
    stats, histogram. Each layer can interface with cell panel and provide detailed information about the cells (e.g. S2 Id). 32 UNIQUE DRIVERS START TIME 15/07/2017 ROLL UP H O U R D A Y W E E K M O N T H END TIME 15/07/2017 12 EFFECTIVE DSR C O N V E R S I O N R A T E D E M A N D S U P P L Y R A T I O 3 4 9 4 4 0 5 9 0 4 9 9 0 9
  9. Automated metric pipeline How do you support 15+ teams to

    analyse realtime metrics without any development effort? How does the data flow?
  10. DATA STREAM - 10+ Kafka clusters - 6 Billion+ events

    DAGGERS DATABASE DATLANTIS ENIGMA COSMOS ATLAS Data stream
  11. DATA STREAM - Flink powered jobs - SQL DIY Interface

    - Time Series Database DAGGERS DATABASE DATLANTIS ENIGMA COSMOS ATLAS Data aggregation
  12. DATA STREAM - 15+ Teams - <1 min from metric

    to visualization DAGGERS DATABASE DATLANTIS ENIGMA COSMOS ATLAS Data visualization
  13. DATA STREAM - Metric store - User Census DAGGERS DATABASE

    DATLANTIS ENIGMA COSMOS ATLAS Enigma
  14. { name: "demand", description: "Demand by S2 ids", frequency: 60000,

    status: "online", delay: 0, scale: { factor: 1, name: "linear" } tags: [{ name: "service_type", type: "string", description: "Service Type", filter: true, classification: "enum" }], "fields": [{ name: "unique_customers", type: "number", aggregation: "sum", description: "No. of unique customers" }] } Metric schema
  15. ENIGMA COSMOS ATLAS S t a r t s t

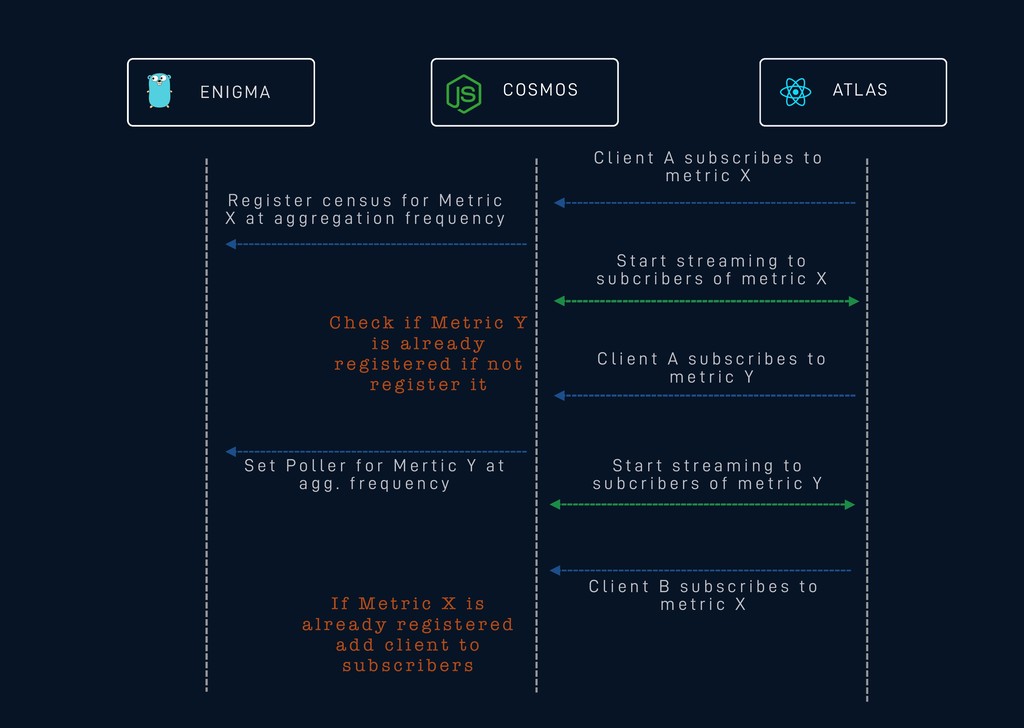
    r e a m i n g t o s u b c r i b e r s o f m e t r i c X S t a r t s t r e a m i n g t o s u b c r i b e r s o f m e t r i c Y R e g i s t e r c e n s u s f o r M e t r i c X a t a g g r e g a t i o n f r e q u e n c y S e t P o l l e r f o r M e r t i c Y a t a g g . f r e q u e n c y C h e c k i f M e t r i c Y i s a l r e a d y r e g i s t e r e d i f n o t r e g i s t e r i t I f M e t r i c X i s a l r e a d y r e g i s t e r e d a d d c l i e n t t o s u b s c r i b e r s C l i e n t A s u b s c r i b e s t o m e t r i c Y C l i e n t B s u b s c r i b e s t o m e t r i c X C l i e n t A s u b s c r i b e s t o m e t r i c X
  16. { name: "demand", description: "Demand by S2 ids", frequency: 60000,

    status: "online", delay: 20, scale: { factor: 1, name: "linear" } tags: [{ name: "service_type", type: "string", description: "Service Type", filter: true, classification: "enum" }], "fields": [{ name: "unique_customers", type: "number", aggregation: "sum", description: "No. of unique customers" }] } Metric schema
  17. Timeline synchronization d When different metrics are aggregated in different

    timelines, how do you visualize them in single frame?