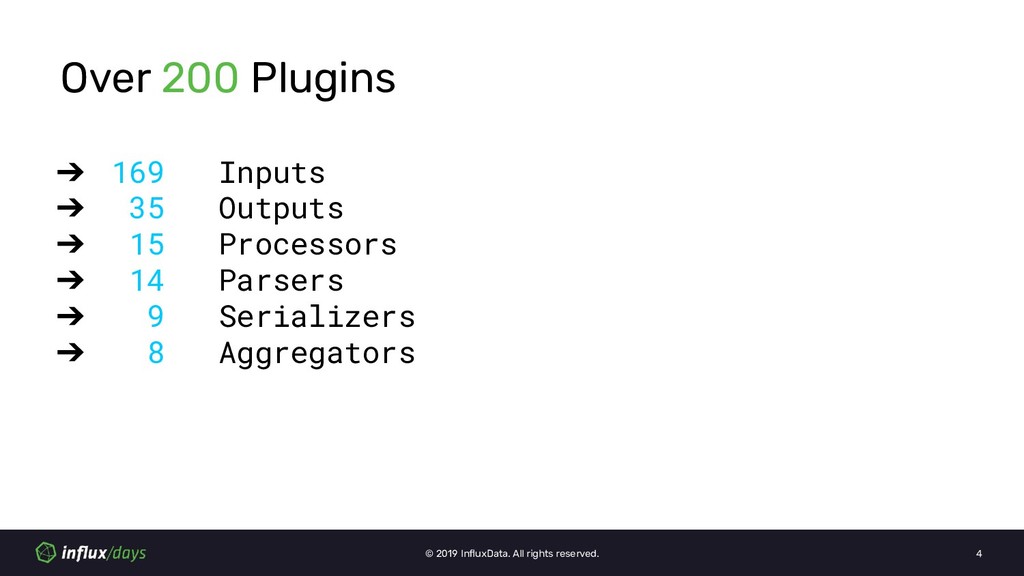
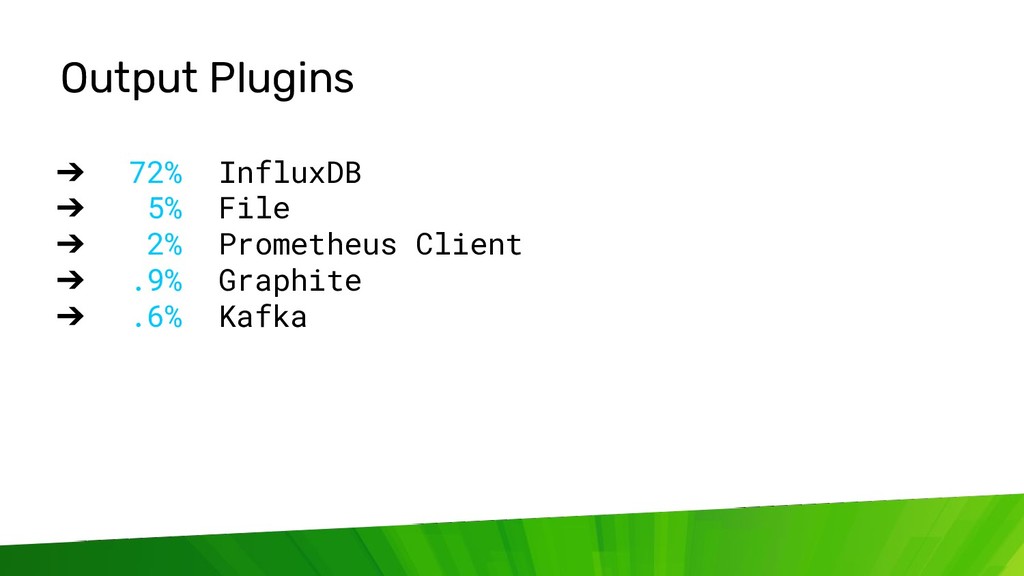
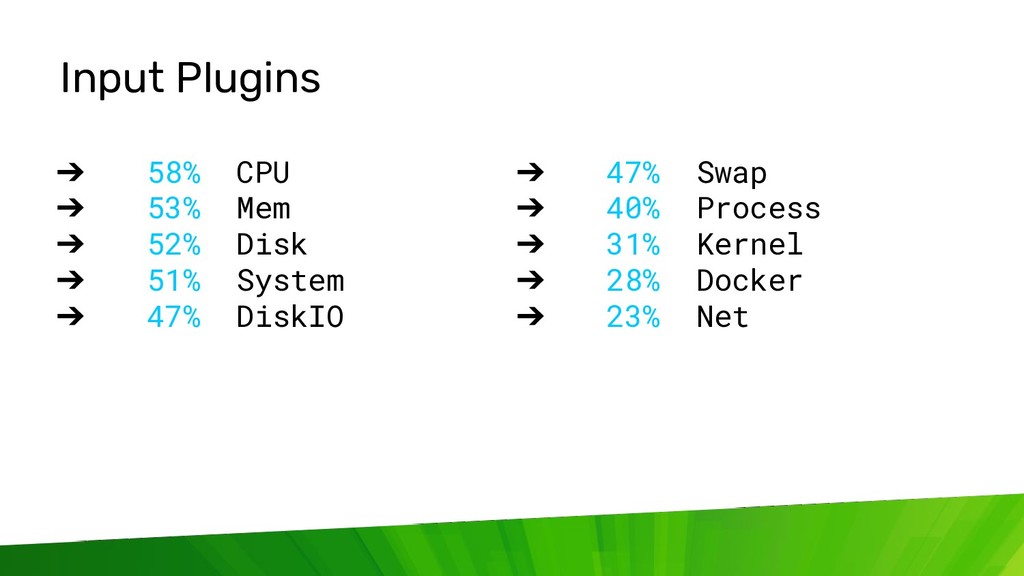
Telegraf is an agent for collecting, processing, aggregating, and writing metrics. With over 200 plugins, Telegraf can fetch metrics from a variety of sources, allowing you to build aggregations and write those metrics to InfluxDB, Prometheus, Kafka, and more.
In this talk, we will take a look at some of the lesser known, but awesome, plugins that are often overlooked; as well as how to use Telegraf for monitoring of Cloud Native systems.
![© 2019 InfluxData. All rights reserved. 23 Multiple Outputs [[outputs.influxdb]]](https://files.speakerdeck.com/presentations/1d0e970a79174b54832a8e9476f9e38f/slide_22.jpg)
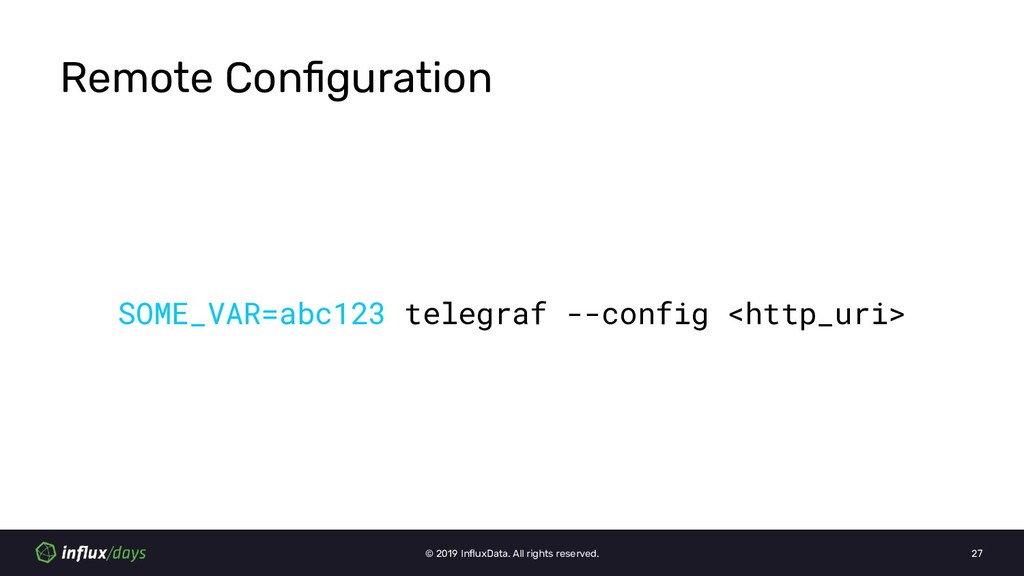
![© 2019 InfluxData. All rights reserved. 28 Remote Configuration [agent]](https://files.speakerdeck.com/presentations/1d0e970a79174b54832a8e9476f9e38f/slide_27.jpg)
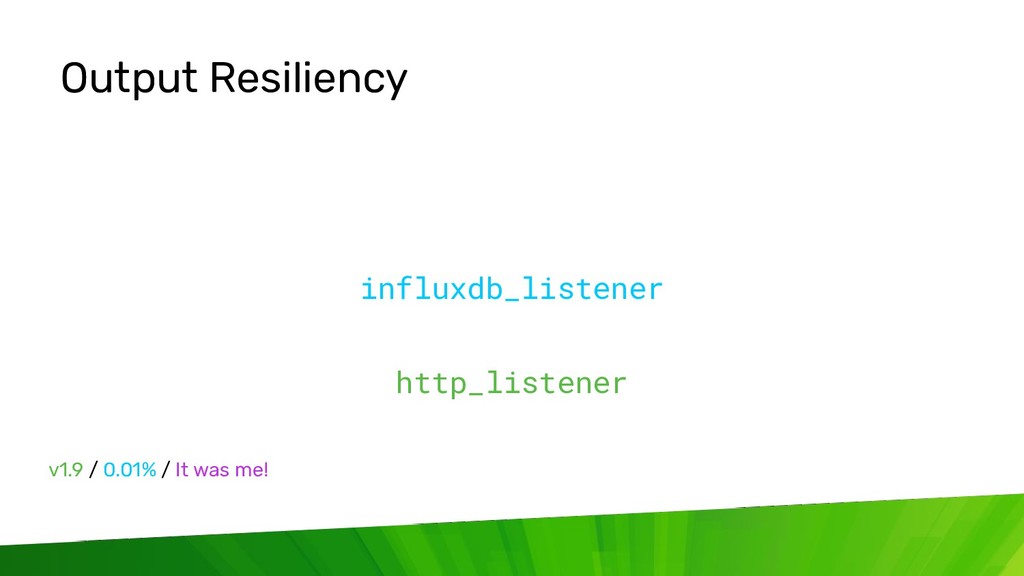
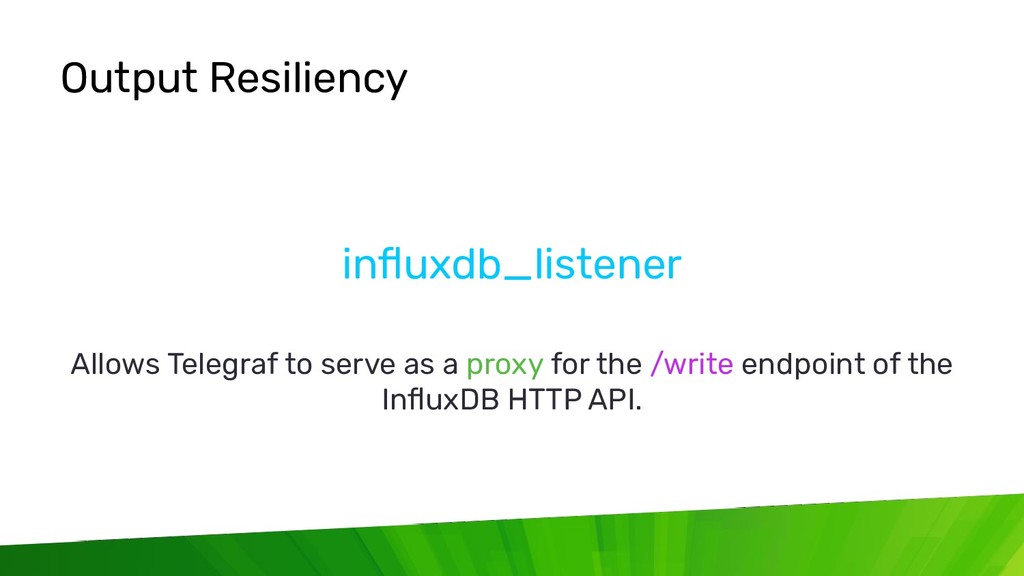
![influxdb_listener [[inputs.influxdb_listener]] service_address = ":8086"](https://files.speakerdeck.com/presentations/1d0e970a79174b54832a8e9476f9e38f/slide_35.jpg)
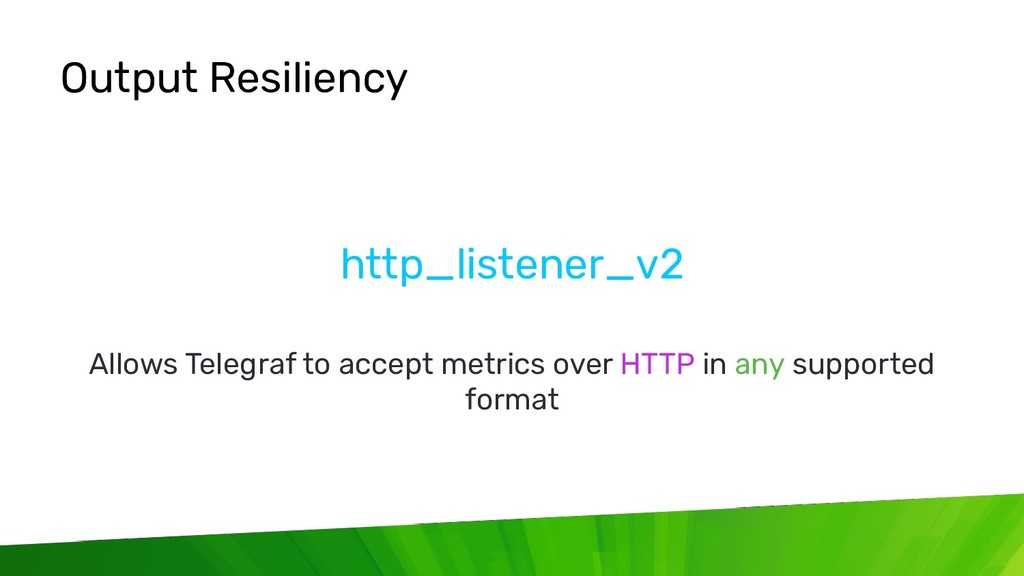
![http_listener_v2 [[inputs.http_listener_v2]] service_address = ":8080" data_format = "json"](https://files.speakerdeck.com/presentations/1d0e970a79174b54832a8e9476f9e38f/slide_39.jpg)
![JSON [[inputs.http_listener_v2]] data_format = "json" json_name_key = "name" tag_keys =](https://files.speakerdeck.com/presentations/1d0e970a79174b54832a8e9476f9e38f/slide_40.jpg)
![© 2019 InfluxData. All rights reserved. 54 Health Output [[outputs.health]]](https://files.speakerdeck.com/presentations/1d0e970a79174b54832a8e9476f9e38f/slide_53.jpg)