$30 off During Our Annual Pro Sale. View Details »

Introduction to Time Series (Cloud Native Wales, April 2019)

Introduction to Time Series (Cloud Native Wales, April 2019)

Where you at this talk? Feedback can be left:

https://rawko.de/feedback

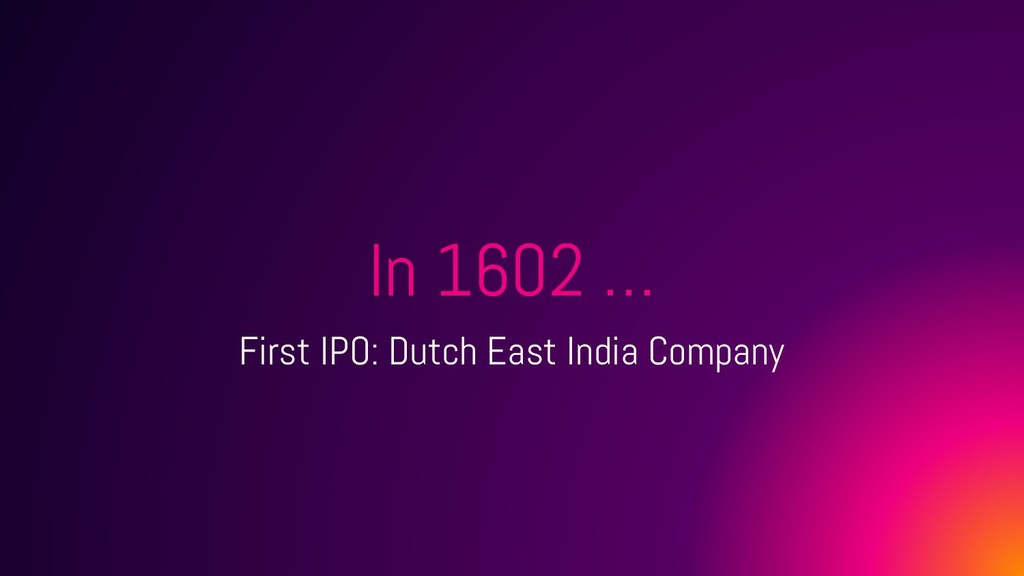
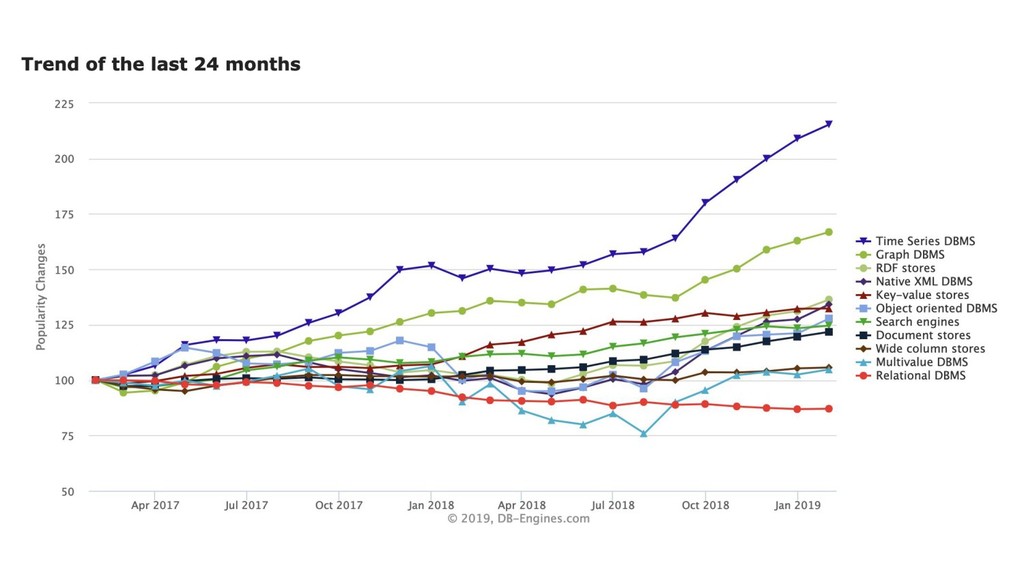
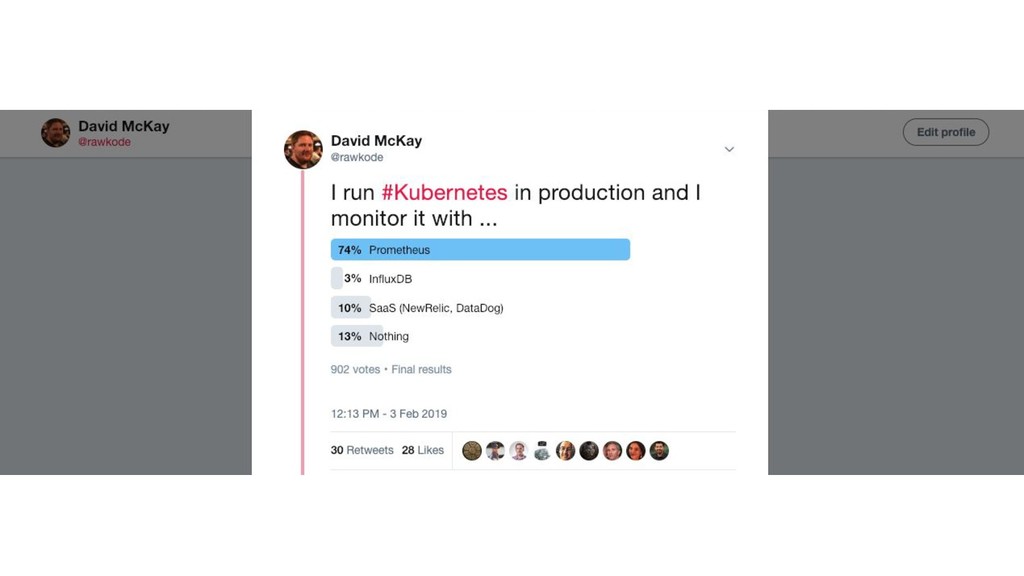
Time-Series has been the fastest growing database category, rated, by DBEngines, for over 2 years; yet, less than 15% store their time-series data in a time-series database. Do you?

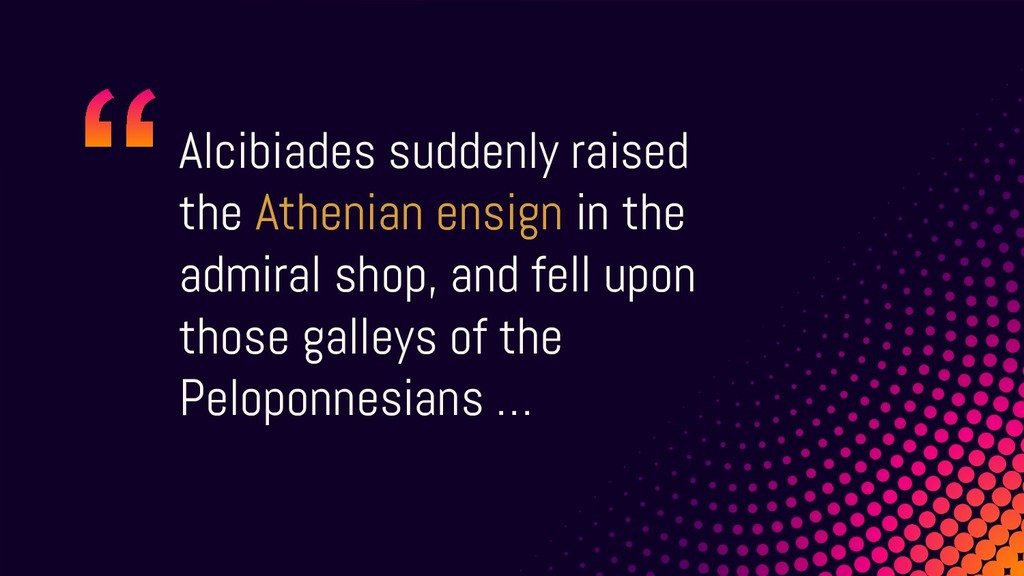
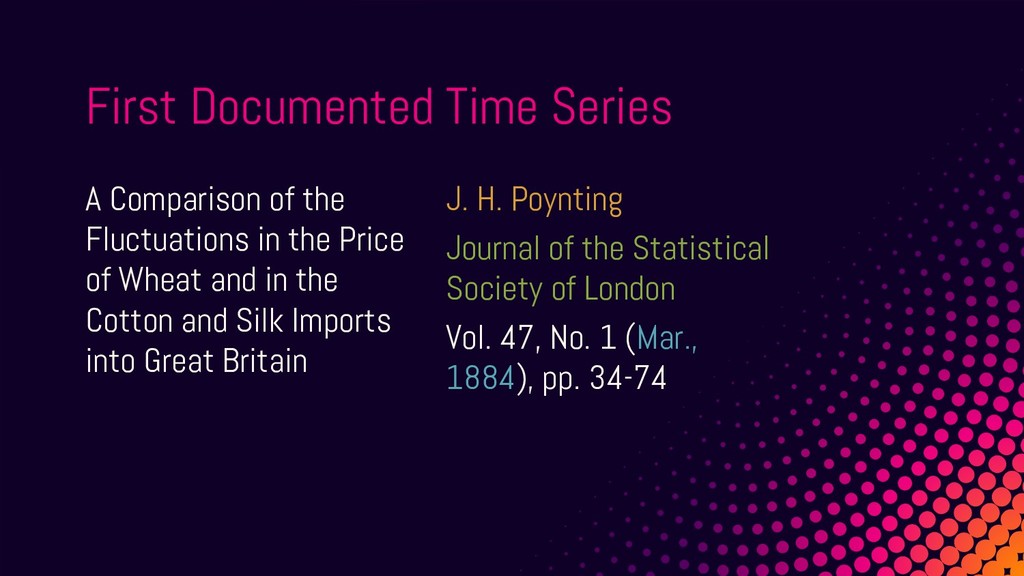
One could, accurately, say that time-series data is as old as the universe; but it wasn't until the mid-19th century that the first article was published on the concept: A Comparison of the Fluctuations in the Price of Wheat and in the Cotton and Silk Imports into Great Britain by J. H. Poynting (March 1884).

Time-Series data is so natural and common that you actually consume, evaluate, and utilise it everyday; when you're:

- Paying for your morning coffee
- Sighing at the "Delayed" notice on your commute
- Hugging your coffee mug as you process your email inbox

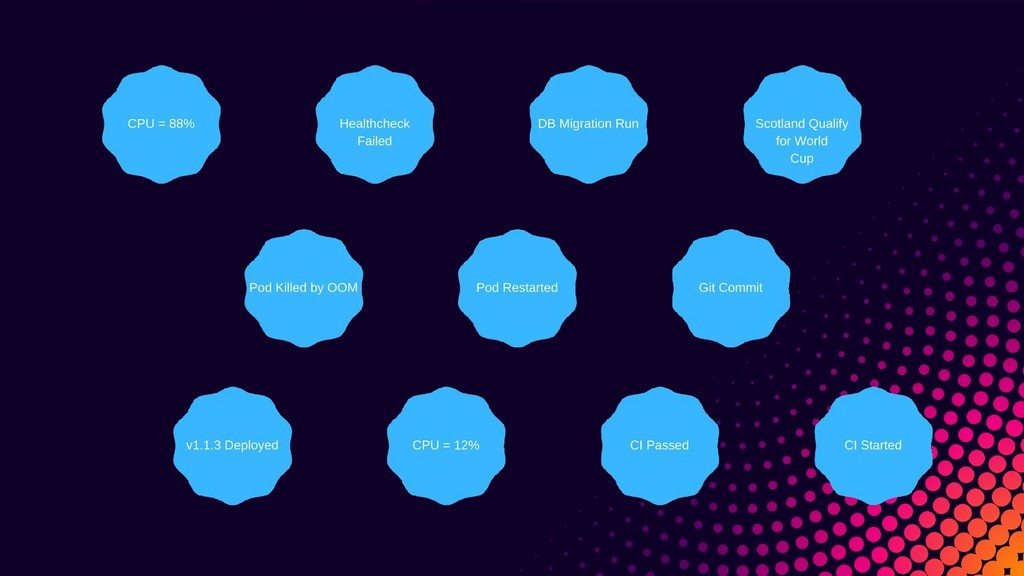
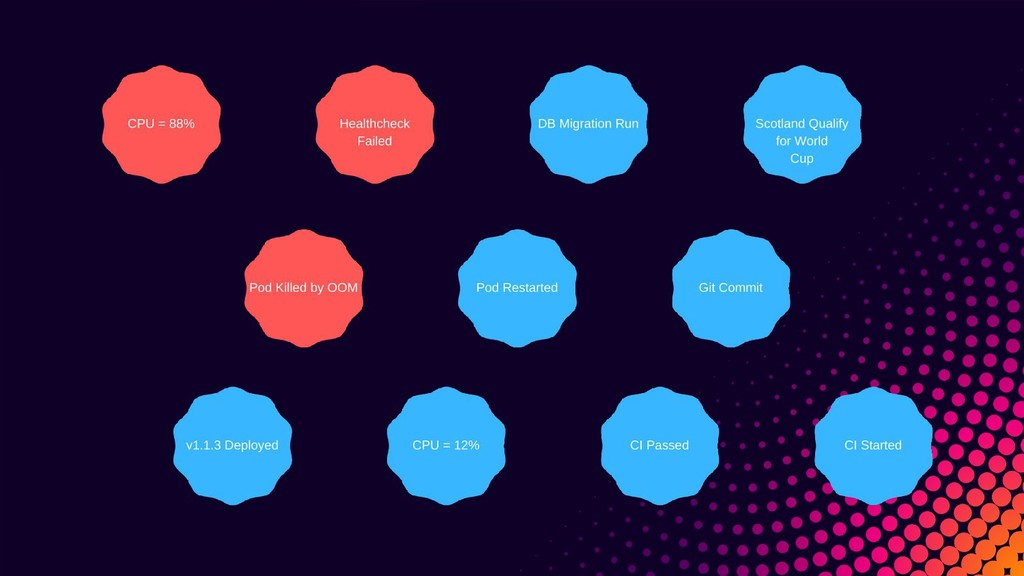
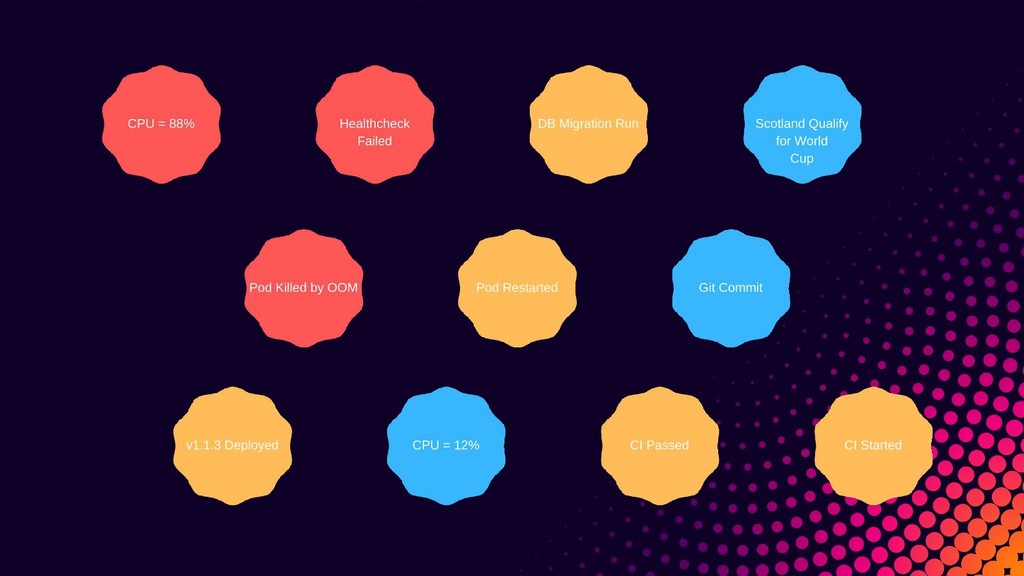
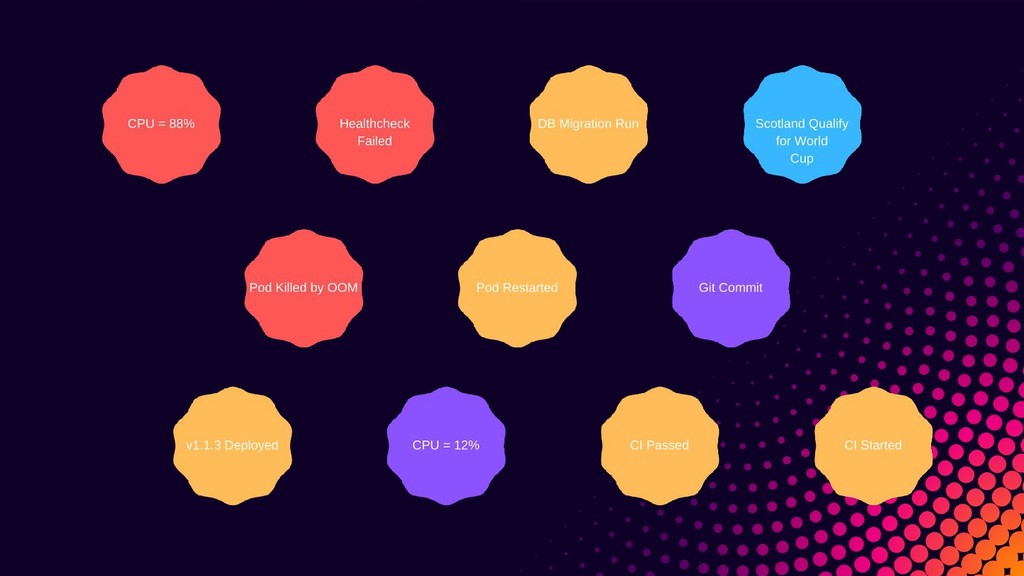
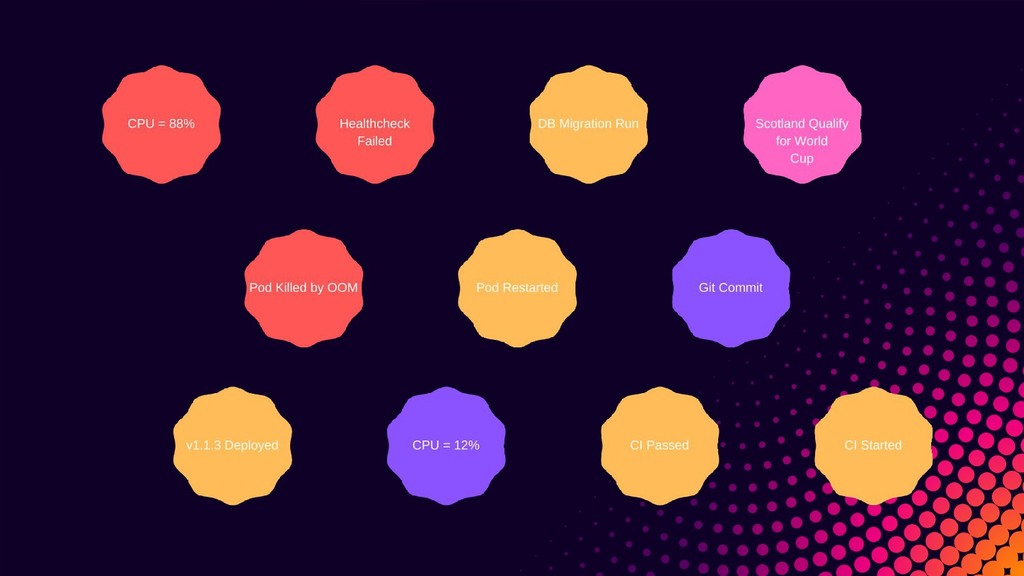
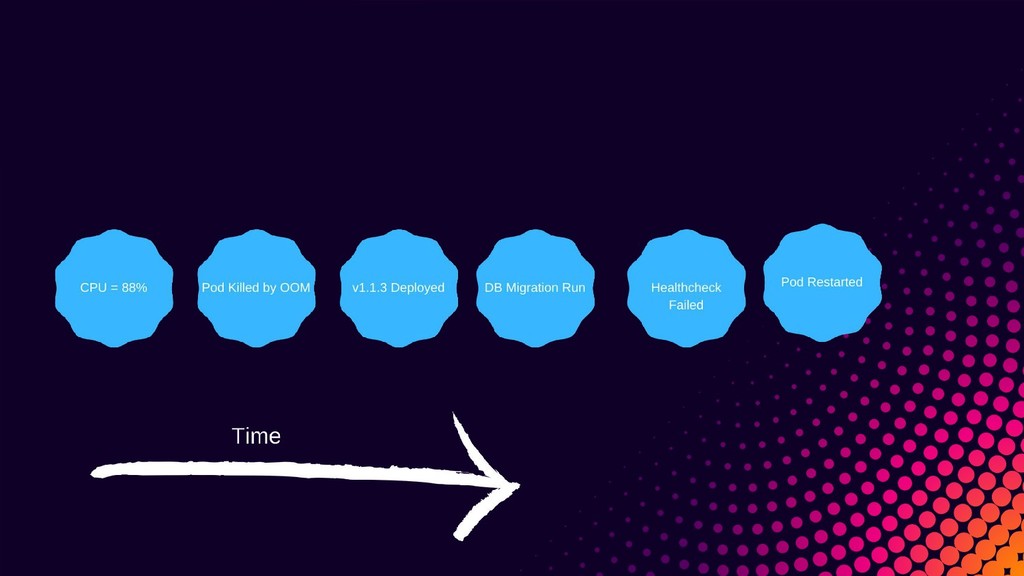
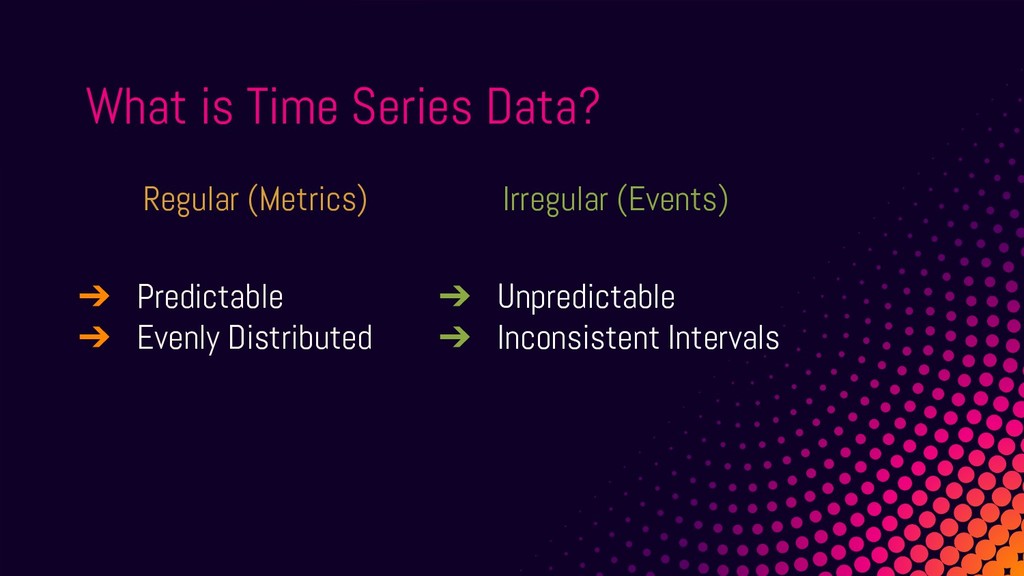
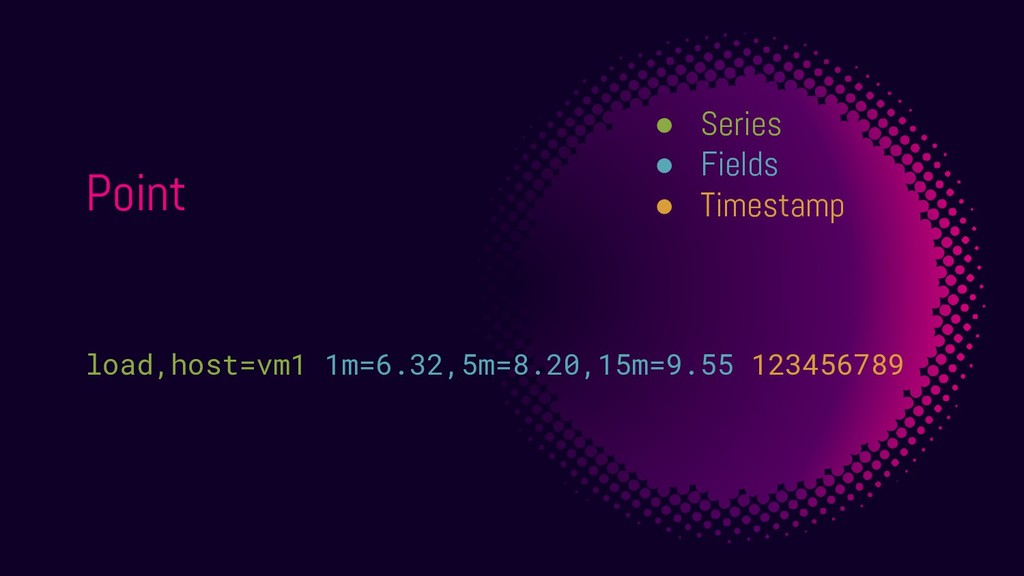
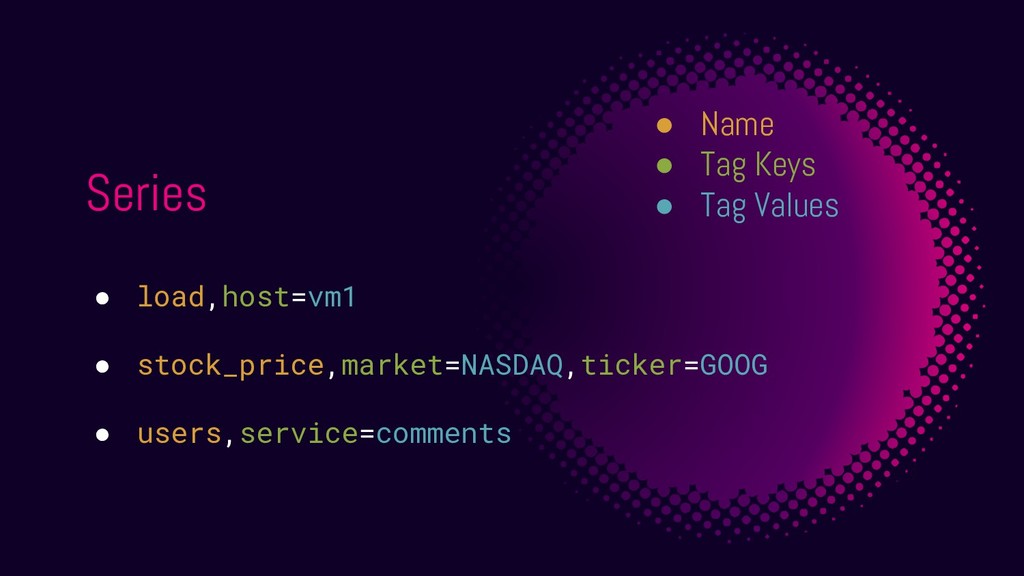
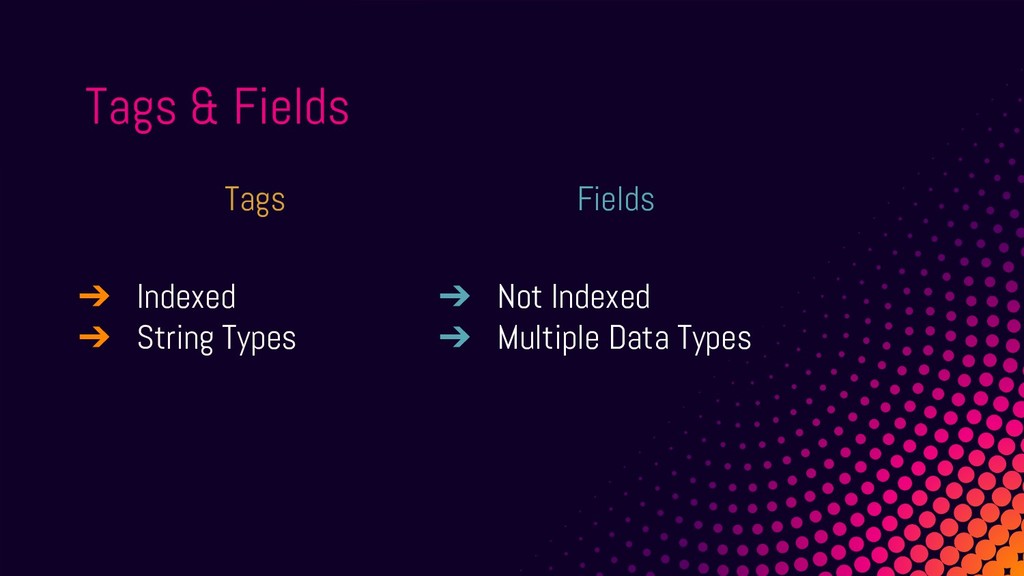
In this talk we will look at the different types of time-series data and how to use that to drive observations, understanding, and automation.

"All data becomes an order of magnitude more interesting on the time dimension" - Lets see why.

David McKay

April 11, 2019
Tweet

More Decks by David McKay

Other Decks in Technology

Transcript

  1. Noswaith dda
    David McKay
    @rawkode
    Developer Relations Manager
    @InfluxDB | #InfluxDB
    Cloud Native
    Wales

    View Slide

  2. Introduction to Time
    Series

    View Slide

  3. Before we begin …

    View Slide

  4. Pop Quiz
    “Invented” When?

    View Slide

  5. Encoding
    First Used … ?
    First Used 410 BC

    View Slide

  6. Encoding
    “Documented” in The Lives
    of the Noble Grecians and
    Romans, by Roman historian
    Plutarch.

    View Slide

  7. Alcibiades suddenly raised
    the Athenian ensign in the
    admiral shop, and fell upon
    those galleys of the
    Peloponnesians …

    View Slide

  8. In the 14th century, things
    hadn’t actually advanced
    much more. The Black Book
    of Admiralty listed 2 signals:
    1 flag or 2 flags
    Encoding

    View Slide

  9. By the 15th century there
    were 15 flags, each with a
    single meaning.
    Encoding

    View Slide

  10. Finally, in the late 17th
    century; a French system
    existed (Mahé de la
    Bourdonnais) with 10
    coloured flags, representing
    0-9
    Encoding

    View Slide

  11. Sharding
    First Used … ?
    First Used 150 BC

    View Slide

  12. Sharding
    First “documented” example
    was in ~150 AD, invented
    and described by Polybius.

    View Slide

  13. We take the alphabet and
    divide it into five parts,
    each consisting of five
    letters.

    View Slide

  14. View Slide

  15. View Slide

  16. History of Time Series

    View Slide

  17. The earliest form of a
    company which issued
    public shares was the case
    of the publicani during the
    Roman Republic.
    The Romans Did It

    View Slide

  18. Like modern joint-stock companies, the
    publicani were legal bodies independent of their
    members whose ownership was divided into
    shares, or partes. There is evidence that these
    shares were sold to public investors and traded
    in a type of over-the-counter market in the
    Forum, near the Temple of Castor and Pollux.
    The shares fluctuated in value, encouraging the
    activity of speculators, or quaestors.

    View Slide

  19. In 1602 …
    First IPO: Dutch East India Company

    View Slide

  20. In 1873 …
    First US IPO: Bank of North America

    View Slide

  21. In 1884 …
    What was the price of wheat?

    View Slide

  22. A Comparison of the
    Fluctuations in the Price
    of Wheat and in the
    Cotton and Silk Imports
    into Great Britain
    First Documented Time Series
    J. H. Poynting
    Journal of the Statistical
    Society of London
    Vol. 47, No. 1 (Mar.,
    1884), pp. 34-74

    View Slide

  23. What is all this?
    This is the first (or one of)
    paper that added the
    dimension of time to
    statistical mathematics

    View Slide

  24. All data becomes an order
    of magnitude more
    interesting on the time
    dimension
    @rawkode

    View Slide

  25. View Slide

  26. Most data is best
    understood in the
    dimension of time
    @pauldix, CTO

    View Slide

  27. Introduction to Time
    Series
    Finally!

    View Slide

  28. What Will We Cover?
    ➔ Time Series Data
    ➔ Time Series Databases
    ➔ Getting to Know InfluxDB
    ➔ Value of Time Series Data
    ➔ Advancing Monitoring to Time Series

    View Slide

  29. Time Series Data
    What is it?

    View Slide

  30. Time Series Data
    Data with a timestamp

    View Slide

  31. View Slide

  32. View Slide

  33. View Slide

  34. View Slide

  35. View Slide

  36. View Slide

  37. What is Time Series Data?

    View Slide

  38. Irregular (Events)
    ➔ Unpredictable
    ➔ Inconsistent Intervals
    What is Time Series Data?
    Regular (Metrics)
    ➔ Predictable
    ➔ Evenly Distributed

    View Slide

  39. Regular / Metrics
    ★ CPU Usage
    ★ Memory Usage
    ★ Ping Time for Google.com
    ★ Number of Processes

    View Slide

  40. Irregular / Events
    ★ User Clicked Login
    ★ Authentication Failed
    ★ CI Published v1.3.1
    ★ Network Cable Unplugged

    View Slide

  41. View Slide

  42. Time Series Data
    Use Cases

    View Slide

  43. IoT / Sensor
    ➔ Thermostats
    ➔ Electric Engines
    ➔ Smart Things
    ➔ GPS
    ➔ Fitbits
    Real Time Analytics
    ➔ Website
    Tracking
    ➔ Stock Prices
    ➔ Currency
    Exchange Rates
    Use Cases for Time Series
    Monitoring
    ➔ Infrastructure
    ➔ Applications
    ➔ Third Party
    Services

    View Slide

  44. Time Series Databases
    TSDB’s

    View Slide

  45. Time Series databases are
    optimized for collecting, storing,
    retrieving, and processing of Time
    Series data.
    Time Series Databases

    View Slide

  46. ➔ High Write Frequency
    ➔ Reads are range scans
    ➔ TTL / Lifecycle Management
    ➔ Time Sensitive
    Time Series Databases

    View Slide

  47. View Slide

  48. 12%
    Are you in the 88%?

    View Slide

  49. View Slide

  50. View Slide

  51. View Slide

  52. View Slide

  53. View Slide

  54. 13%
    It’s Not Too Late!

    View Slide

  55. View Slide

  56. Disclaimer
    Most of this isn’t unique to InfluxDB

    View Slide

  57. InfluxDB
    Introductions

    View Slide

  58. InfluxDB
    ➔ TSDB
    ➔ Open-Source
    ➔ FullStack (Telegraf,
    InfluxDB, Chronograf,
    and Kapacitor)
    ➔ v2 …

    View Slide

  59. Points
    At any point in time, this
    value was N

    View Slide

  60. load,host=vm1 1m=6.32,5m=8.20,15m=9.55 123456789
    Point
    ● Series
    ● Fields
    ● Timestamp

    View Slide

  61. ● load,host=vm1
    ● stock_price,market=NASDAQ,ticker=GOOG
    ● users,service=comments
    Series
    ● Name
    ● Tag Keys
    ● Tag Values

    View Slide

  62. Fields
    ➔ Not Indexed
    ➔ Multiple Data Types
    Tags & Fields
    Tags
    ➔ Indexed
    ➔ String Types

    View Slide

  63. Value of Time Series
    Data
    Isn’t It Valuable Forever?

    View Slide

  64. Resolution
    The predictable interval at which we will collect our
    time series data

    View Slide

  65. The value of all time series data is directly correlated
    with the resolution that the data is available
    Value of Time Series Data

    View Slide

  66. Cost of Time Series
    Data
    Wait, Isn’t It Free?!

    View Slide

  67. Example
    cpu,machine=abc1 usage=1.66 timestamp

    View Slide

  68. Resolution
    ➔ 1 Measurement
    ➔ 1 Series
    ➔ 1s Resolution
    86400
    Points
    Per Day

    View Slide

  69. Resolution
    ➔ 1 Measurement
    ➔ 2 Series
    ➔ 1s Resolution
    172800
    Points
    Per Day

    View Slide

  70. Resolution 4320000
    Points
    Per Day
    ➔ 5 Measurement
    ➔ 10 Series
    ➔ 1s Resolution

    View Slide

  71. Nasdaq
    28512000
    0000
    Points
    Per Day
    ➔ 1 Measurement
    ➔ 3300 Series
    ➔ 1ms Resolution

    View Slide

  72. Nasdaq 4752000
    Points
    Per Day
    ➔ 1 Measurement
    ➔ 3300 Series
    ➔ 1m Resolution

    View Slide

  73. Nasdaq 79200
    Points
    Per Day
    ➔ 1 Measurement
    ➔ 3300 Series
    ➔ 1h Resolution

    View Slide

  74. Nasdaq 13200
    Points
    Per Day
    ➔ 1 Measurement
    ➔ 3300 Series
    ➔ 6h Resolution

    View Slide

  75. Rollups
    Lowering the Resolution

    View Slide

  76. Rollups with Continuous Queries
    CREATE CONTINUOUS QUERY "rollup_1h" ON "nasdaq"
    BEGIN
    SELECT mean(price) INTO yearly FROM weekly
    GROUP BY time(1h)
    END

    View Slide

  77. Events?
    Outlier / Anomaly Detection
    InfluxDB Anomaly Detection

    View Slide

  78. Advancing Monitoring to
    Time Series
    Taking Small Steps for Giant Leaps

    View Slide

  79. Application
    Database
    CPU > 80% MEM > 80%
    Response
    Time >
    300ms
    Black
    Friday

    View Slide

  80. Service A
    Database A
    Service B Service B Service C
    Database B Database C
    Virtual Network Service Mesh
    Canary
    Ummm?

    View Slide

  81. Cloud Native Architectures
    Convenience Vs. Cost
    You can treat the symptoms for a while …
    Upgrade Your Monitoring

    View Slide

  82. Causality
    Treating the Disease

    View Slide

  83. ➔ Look at last weeks, months, and years of data
    ➔ Use tags to build correlation
    ➔ Get Statistical
    ◆ INTEGRAL()
    ◆ LINEAR_PREDICTION()
    ◆ DERIVATIVE()
    ◆ MOVING_AVERAGE()
    ◆ HOLT_WINTERS()
    Causality

    View Slide

  84. Build Automation
    Through Causality, Historical Data, Prediction, and ML

    View Slide

  85. ➔ Use a TSDB
    ➔ Understand Cost /
    Select Tags Wisely
    ➔ Understand the
    resolution you need
    for 1m, 6m, > 12m
    Summary
    ➔ Rollup metrics
    ➔ Perform outlier detection
    on events
    ➔ Build automation,
    dashboarding, and
    reporting around your data
    (past, present, and future)

    View Slide

  86. Thank You
    David McKay
    @rawkode
    Developer Relations Manager
    @InfluxDB | #InfluxDB
    That’s All
    Folks!

    View Slide