Upgrade to Pro — share decks privately, control downloads, hide ads and more …

Cloud Native Telegraf - Cloud Native London (September 2019)

David McKay
September 04, 2019

Cloud Native Telegraf - Cloud Native London (September 2019)

David McKay

September 04, 2019
Tweet

More Decks by David McKay

Other Decks in Technology

Transcript

  1. © 2019 InfluxData. All rights reserved. 2 @rawkode David McKay

    InfluxData Developer Advocate Scottish Esoteric Programming Languages ☸ Kubernetes Release Team Former SRE Former Developer
  2. © 2019 InfluxData. All rights reserved. 5 @rawkode Telegraf is

    an agent for collecting, processing, aggregating, and writing metrics. Telegraf github.com/influxdata/telegraf
  3. © 2019 InfluxData. All rights reserved. 6 @rawkode Architecture GCP

    Third Party Systems Your Application Telegraf ?
  4. © 2019 InfluxData. All rights reserved. 8 @rawkode Architecture GCP

    Third Party Systems Your Application Telegraf InfluxDB Prometheus StackDriver
  5. © 2019 InfluxData. All rights reserved. 9 @rawkode Plugins Outputs

    Inputs ★ Docker ★ Kafka ★ Kubernetes ★ Nats ★ Postgres ★ System ◦ CPU ◦ Disk ◦ Disk IO ◦ Mem ◦ Process ➔ CrateDB ➔ CloudWatch ➔ DataDog ➔ Elasticsearch ➔ Graphite ➔ InfluxDB ➔ OpenTSDB ➔ Prometheus ➔ StackDriver ➔ Wavefront
  6. © 2019 InfluxData. All rights reserved. 13 © 2019 InfluxData.

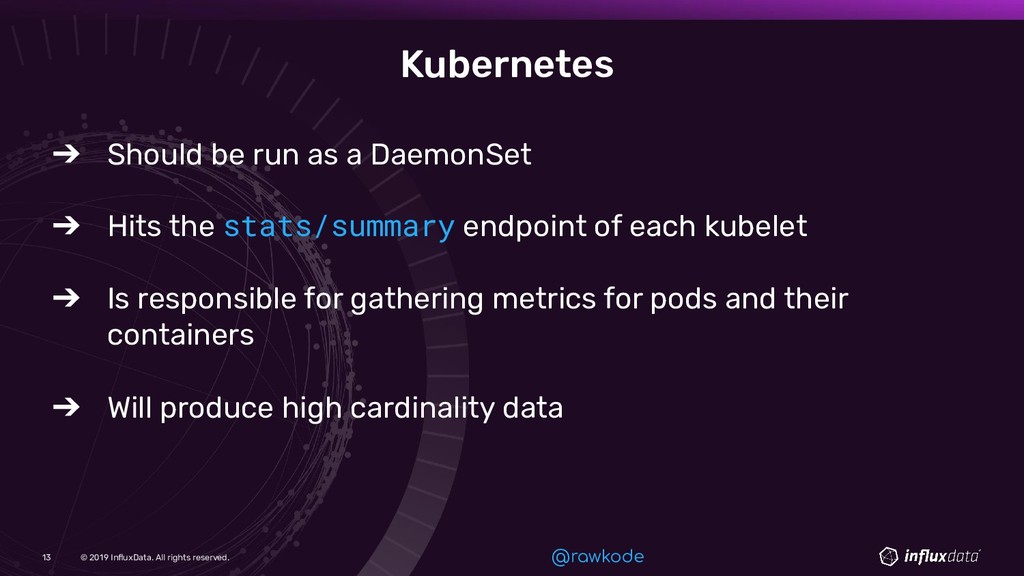
    All rights reserved. 13 @rawkode Kubernetes ➔ Should be run as a DaemonSet ➔ Hits the stats/summary endpoint of each kubelet ➔ Is responsible for gathering metrics for pods and their containers ➔ Will produce high cardinality data
  7. © 2019 InfluxData. All rights reserved. 14 © 2019 InfluxData.

    All rights reserved. 14 @rawkode Kubernetes [[inputs.kubernetes]] url = "https://localhost:10255" bearer_token = "/run/secrets/token insecure_skip_verify = true
  8. © 2019 InfluxData. All rights reserved. 15 © 2019 InfluxData.

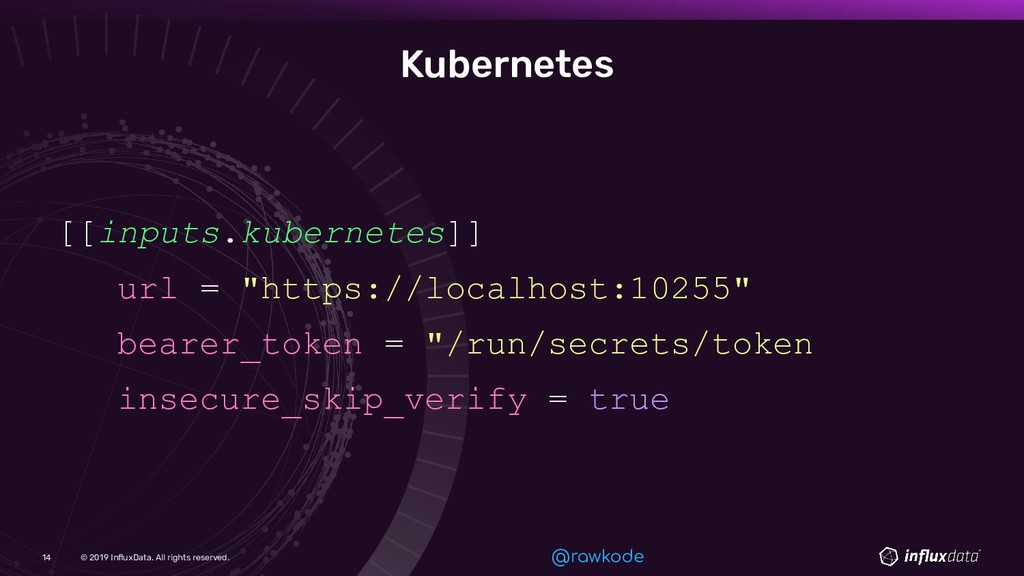
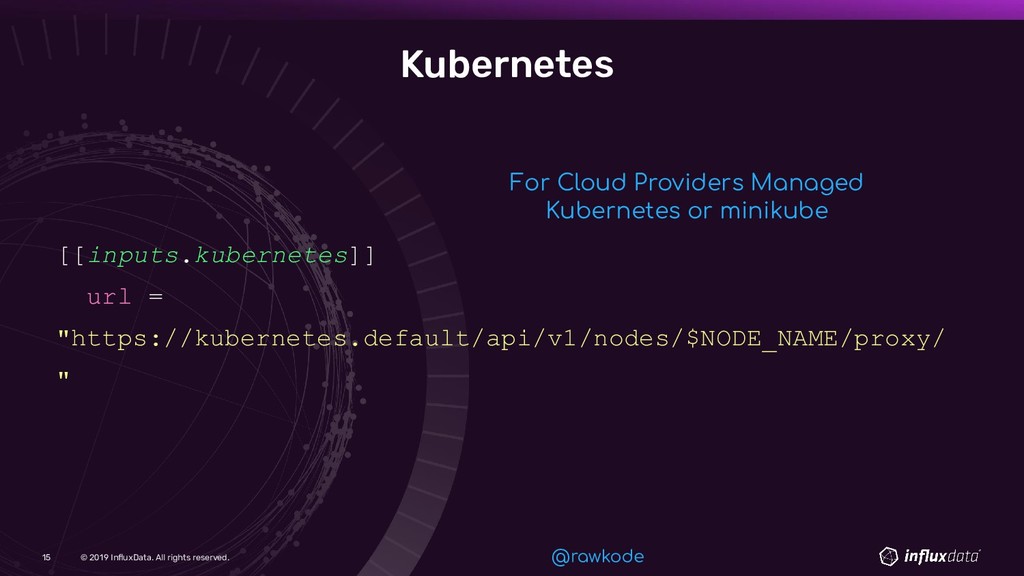
    All rights reserved. 15 @rawkode Kubernetes [[inputs.kubernetes]] url = "https://kubernetes.default/api/v1/nodes/$NODE_NAME/proxy/ " For Cloud Providers Managed Kubernetes or minikube
  9. © 2019 InfluxData. All rights reserved. 16 © 2019 InfluxData.

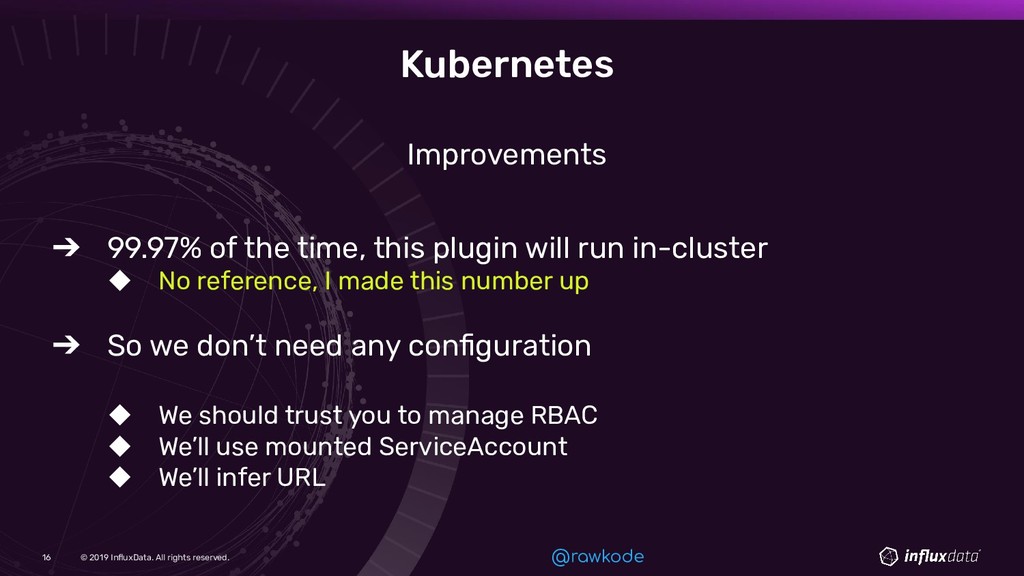
    All rights reserved. 16 @rawkode Kubernetes Improvements ➔ 99.97% of the time, this plugin will run in-cluster ◆ No reference, I made this number up ➔ So we don’t need any configuration ◆ We should trust you to manage RBAC ◆ We’ll use mounted ServiceAccount ◆ We’ll infer URL
  10. © 2019 InfluxData. All rights reserved. 18 © 2019 InfluxData.

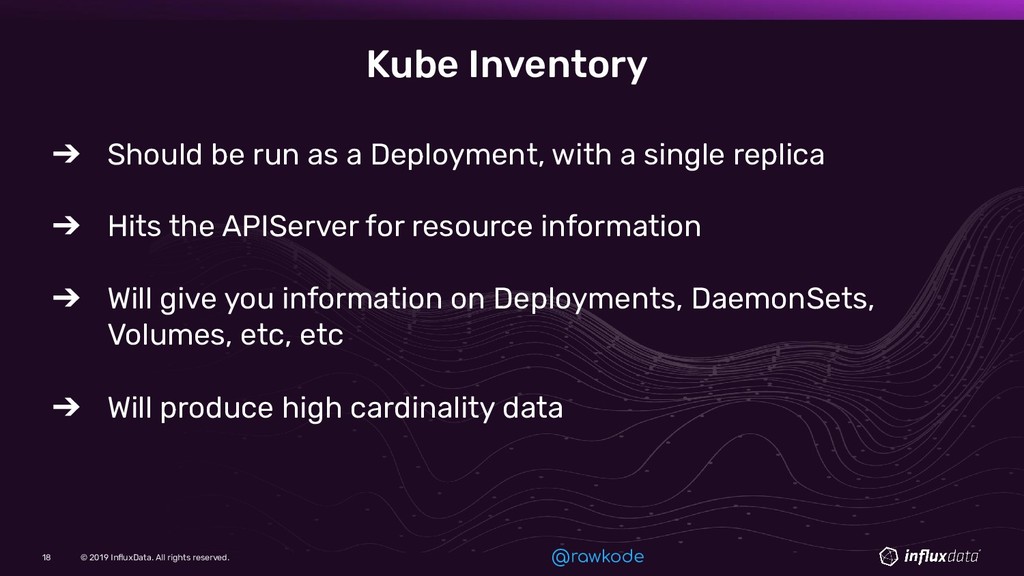
    All rights reserved. 18 @rawkode Kube Inventory ➔ Should be run as a Deployment, with a single replica ➔ Hits the APIServer for resource information ➔ Will give you information on Deployments, DaemonSets, Volumes, etc, etc ➔ Will produce high cardinality data
  11. © 2019 InfluxData. All rights reserved. 19 © 2019 InfluxData.

    All rights reserved. 19 @rawkode Kube Inventory [[inputs.kube_inventory]] url = "https://kubernetes.default" bearer_token = “” resource_exclude = [] resource_include = []
  12. © 2019 InfluxData. All rights reserved. 20 © 2019 InfluxData.

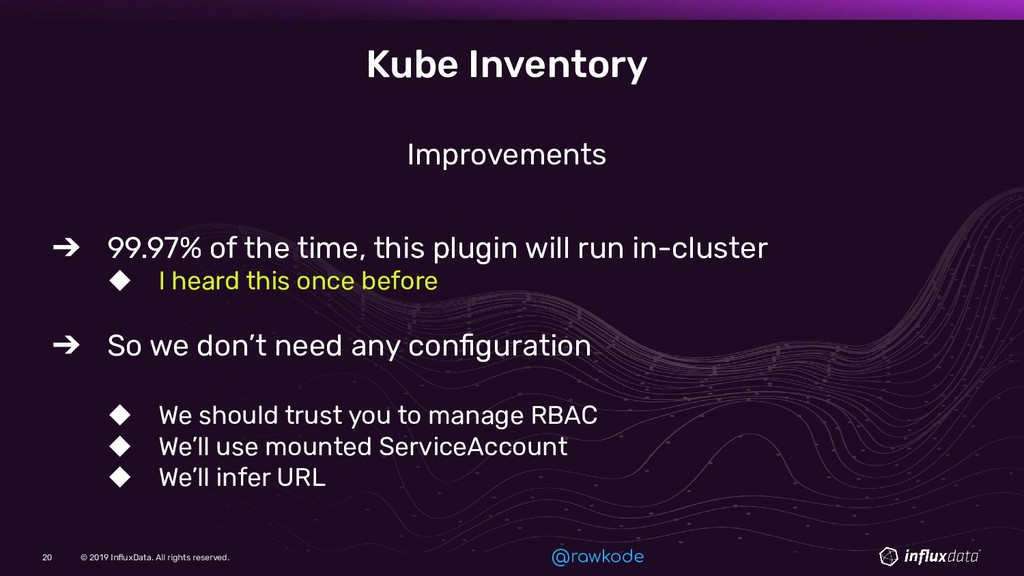
    All rights reserved. 20 @rawkode Kube Inventory Improvements ➔ 99.97% of the time, this plugin will run in-cluster ◆ I heard this once before ➔ So we don’t need any configuration ◆ We should trust you to manage RBAC ◆ We’ll use mounted ServiceAccount ◆ We’ll infer URL
  13. © 2019 InfluxData. All rights reserved. 22 © 2019 InfluxData.

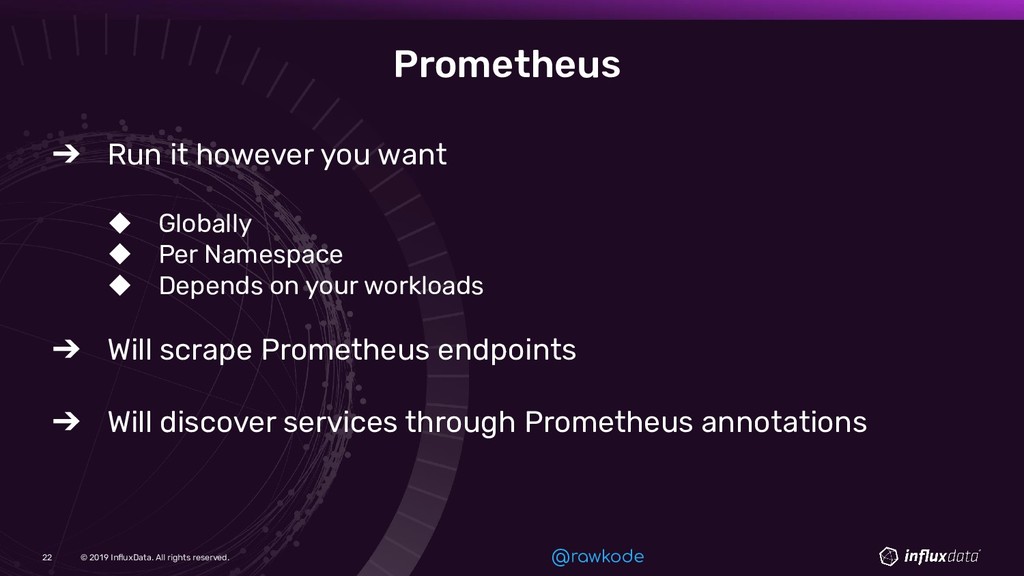
    All rights reserved. 22 @rawkode Prometheus ➔ Run it however you want ◆ Globally ◆ Per Namespace ◆ Depends on your workloads ➔ Will scrape Prometheus endpoints ➔ Will discover services through Prometheus annotations
  14. © 2019 InfluxData. All rights reserved. 23 © 2019 InfluxData.

    All rights reserved. 23 @rawkode Prometheus [[inputs.prometheus]] monitor_kubernetes_pods = true # monitor_kubernetes_pods_namespace = "" bearer_token = “”
  15. © 2019 InfluxData. All rights reserved. 24 © 2019 InfluxData.

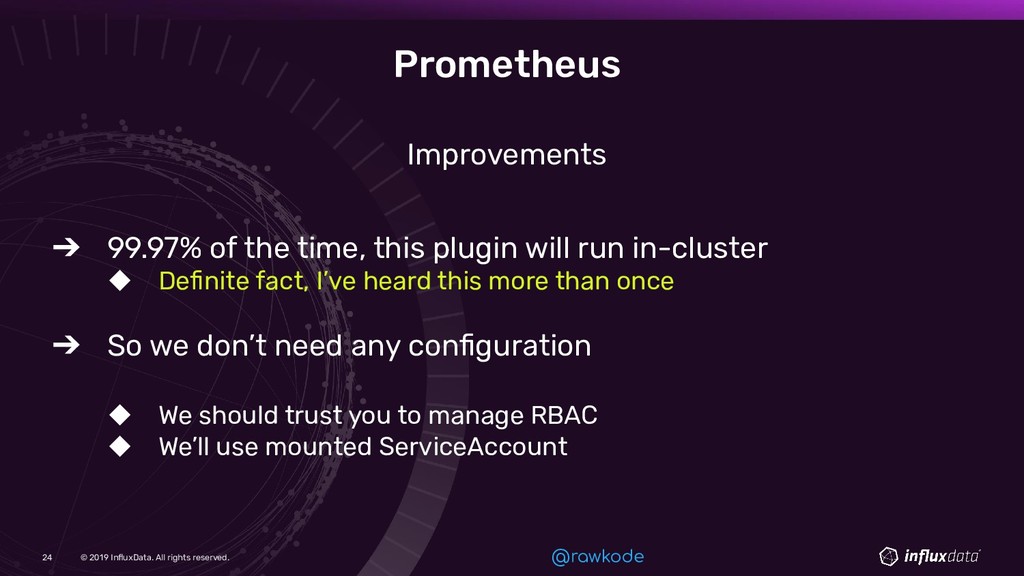
    All rights reserved. 24 @rawkode Prometheus Improvements ➔ 99.97% of the time, this plugin will run in-cluster ◆ Definite fact, I’ve heard this more than once ➔ So we don’t need any configuration ◆ We should trust you to manage RBAC ◆ We’ll use mounted ServiceAccount
  16. © 2019 InfluxData. All rights reserved. 25 © 2019 InfluxData.

    All rights reserved. 25 @rawkode Prometheus Improvements ➔ Support ServiceMonitor CRD (Prometheus Operator)
  17. © 2019 InfluxData. All rights reserved. 27 © 2019 InfluxData.

    All rights reserved. 27 @rawkode InfluxDB [[outputs.influxdb]] urls = ["http://influxdb.monitoring:8086" ] [[outputs.influxdb_v2]] urls = ["http://influxdb.monitoring:9999" ] organization = "InfluxData" bucket = "kubernetes" token = "secret-token"
  18. © 2019 InfluxData. All rights reserved. 29 © 2019 InfluxData.

    All rights reserved. 29 @rawkode Prometheus Client [[outputs.prometheus_client]] ## Address to listen on. listen = ":9273"
  19. © 2019 InfluxData. All rights reserved. 32 @rawkode Proxying influxdb_listener

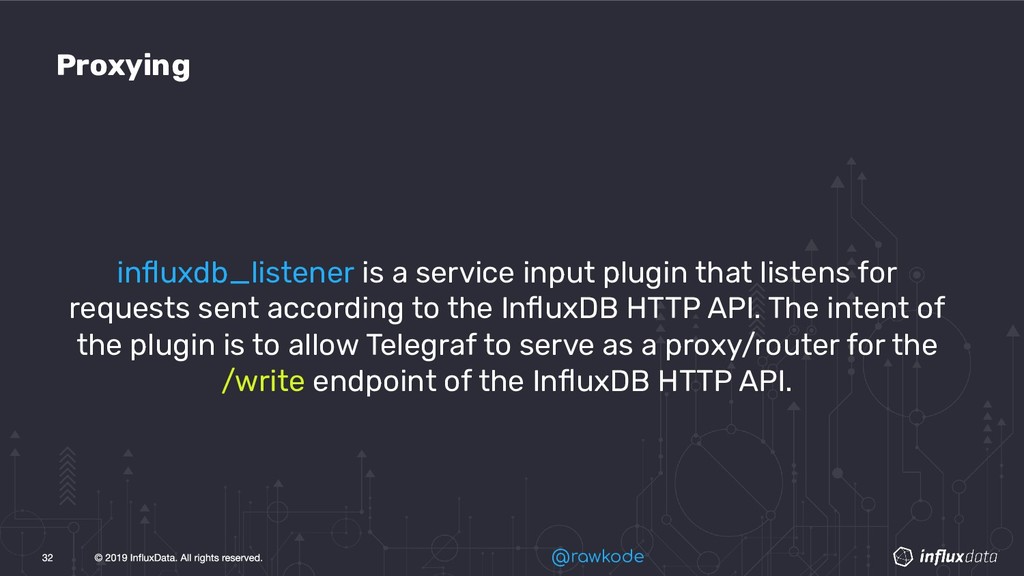
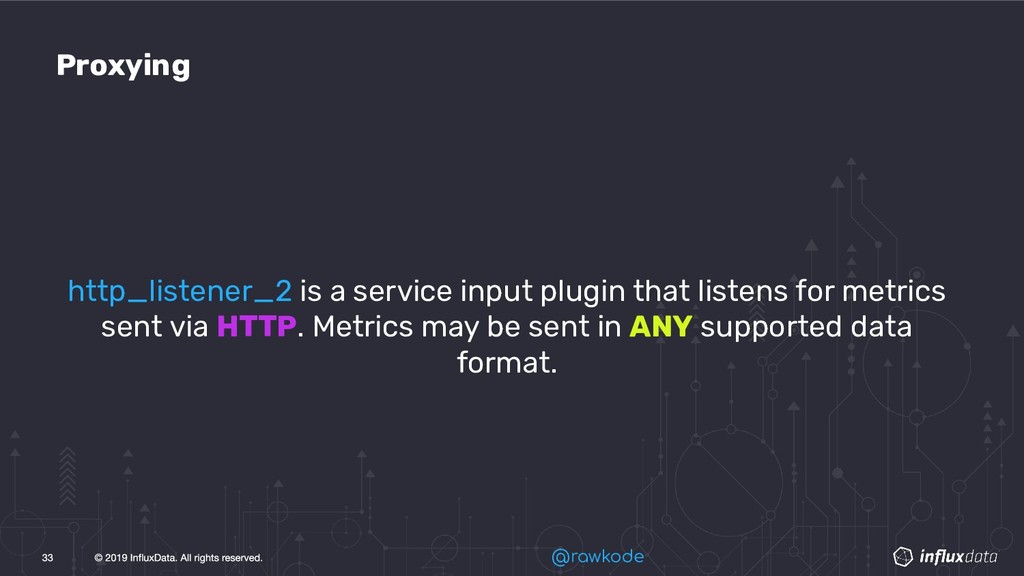
    is a service input plugin that listens for requests sent according to the InfluxDB HTTP API. The intent of the plugin is to allow Telegraf to serve as a proxy/router for the /write endpoint of the InfluxDB HTTP API.
  20. © 2019 InfluxData. All rights reserved. 33 @rawkode Proxying http_listener_2

    is a service input plugin that listens for metrics sent via HTTP. Metrics may be sent in ANY supported data format.
  21. © 2019 InfluxData. All rights reserved. 34 @rawkode Proxying There’s

    also socket_listener, tcp_listener, and udp_listener
  22. © 2019 InfluxData. All rights reserved. 36 @rawkode Batching Telegraf

    will send metrics to outputs in batches of at most metric_batch_size metrics. This controls the size of writes that Telegraf sends to output plugins.
  23. © 2019 InfluxData. All rights reserved. 38 @rawkode Buffering If

    a write to an output fails, Telegraf will hold metric_buffer_limit worth of metrics in-memory before data is lost. This is PER output
  24. © 2019 InfluxData. All rights reserved. 39 These 2 simple

    settings get you redundancy, high availability, and performance optimisation of the write path.
  25. © 2019 InfluxData. All rights reserved. 41 © 2019 InfluxData.

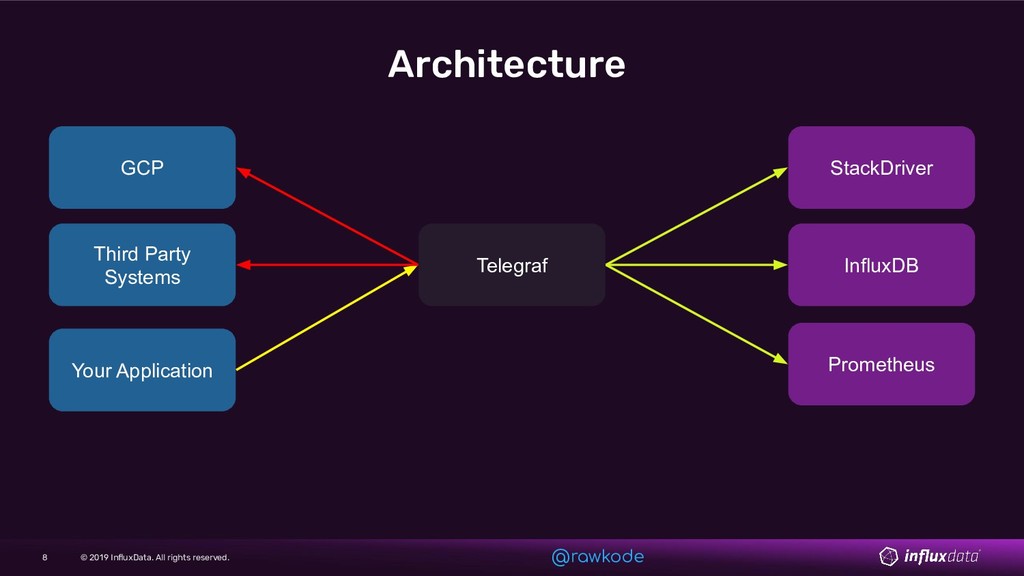
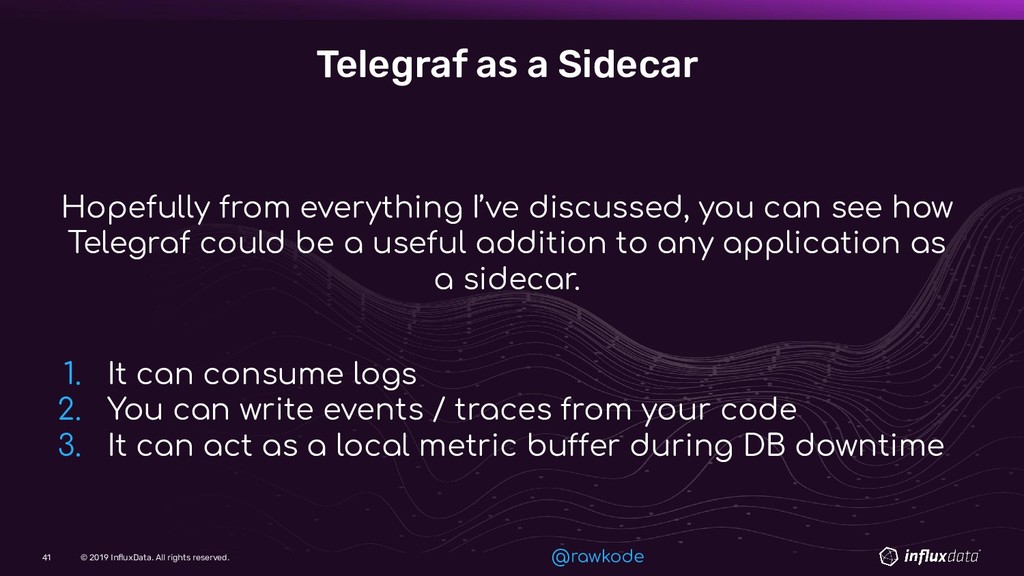
    All rights reserved. 41 @rawkode Telegraf as a Sidecar Hopefully from everything I’ve discussed, you can see how Telegraf could be a useful addition to any application as a sidecar. 1. It can consume logs 2. You can write events / traces from your code 3. It can act as a local metric buffer during DB downtime
  26. © 2019 InfluxData. All rights reserved. 42 © 2019 InfluxData.

    All rights reserved. 42 @rawkode Telegraf as a Sidecar Unfortunately … The Telegraf binary is around 80MiB The Telegraf image is around 250MiB / 80MiB
  27. © 2019 InfluxData. All rights reserved. 44 © 2019 InfluxData.

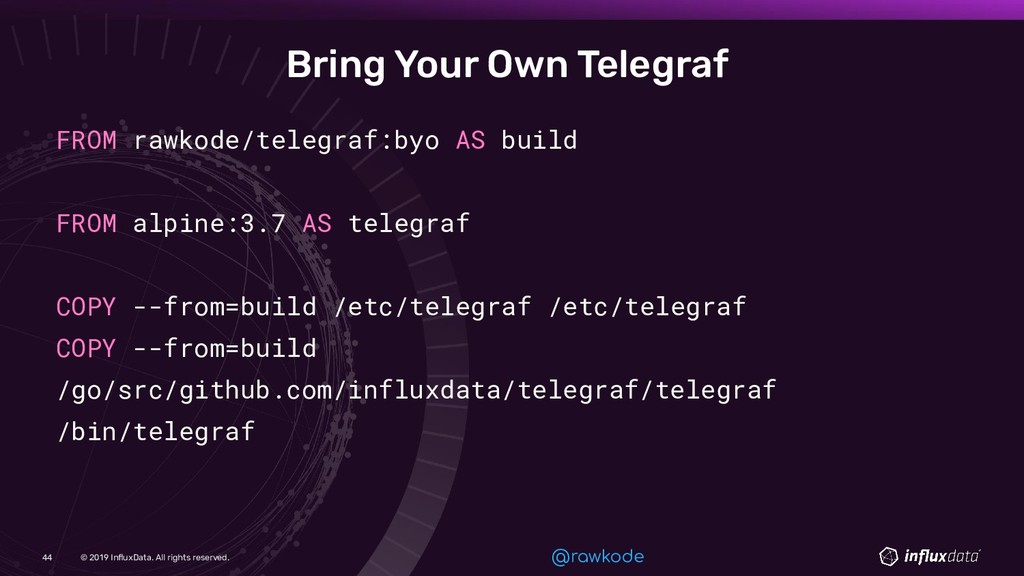
    All rights reserved. 44 @rawkode Bring Your Own Telegraf FROM rawkode/telegraf:byo AS build FROM alpine:3.7 AS telegraf COPY --from=build /etc/telegraf /etc/telegraf COPY --from=build /go/src/github.com/influxdata/telegraf/telegraf /bin/telegraf
  28. © 2019 InfluxData. All rights reserved. 46 © 2019 InfluxData.

    All rights reserved. 46 @rawkode Telegraf Operator apiVersion: influxdata.com/v1 kind: Telegraf metadata: name: mine spec: version: "1.12" scrape_prometheus: false sidecar_injection: true metric_server: true