methods to predict the likely future status of a population or col- lection of populations of conservation con- cern. (Morris and Doak 2002) Introduction Uses Sensitivity Analysis Summary 2 / 15
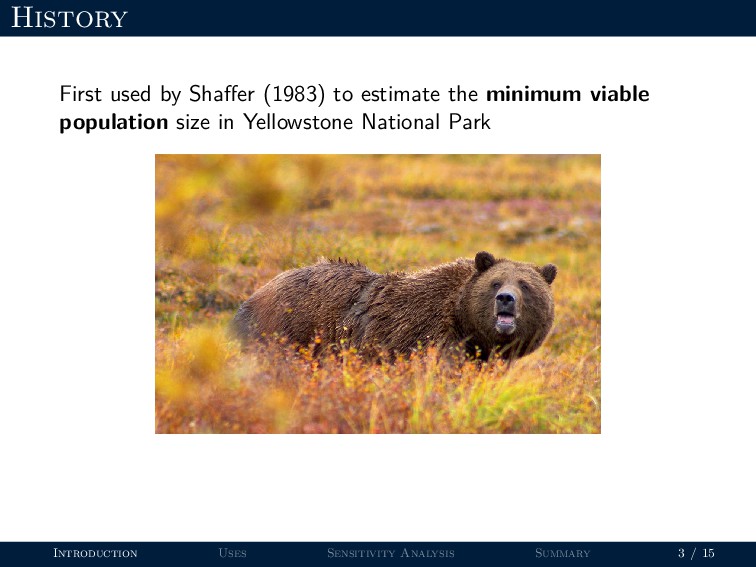
viable population size in Yellowstone National Park Now routine part of species assessments and recovery plans Introduction Uses Sensitivity Analysis Summary 3 / 15
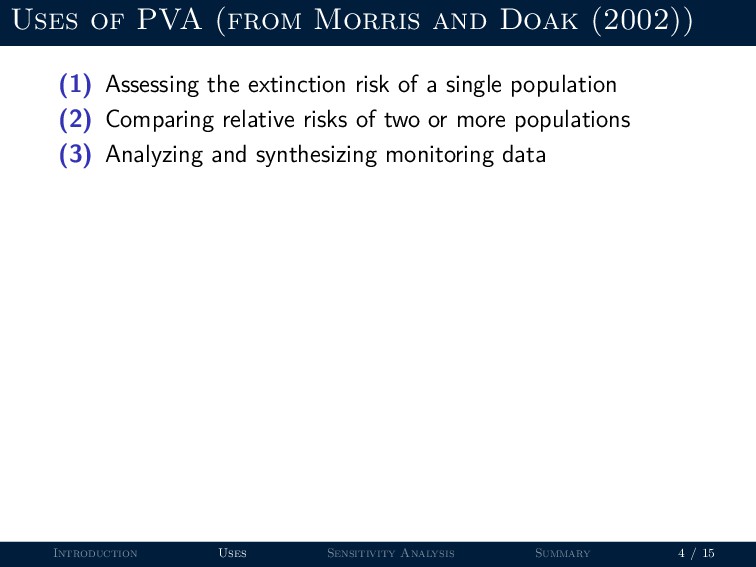
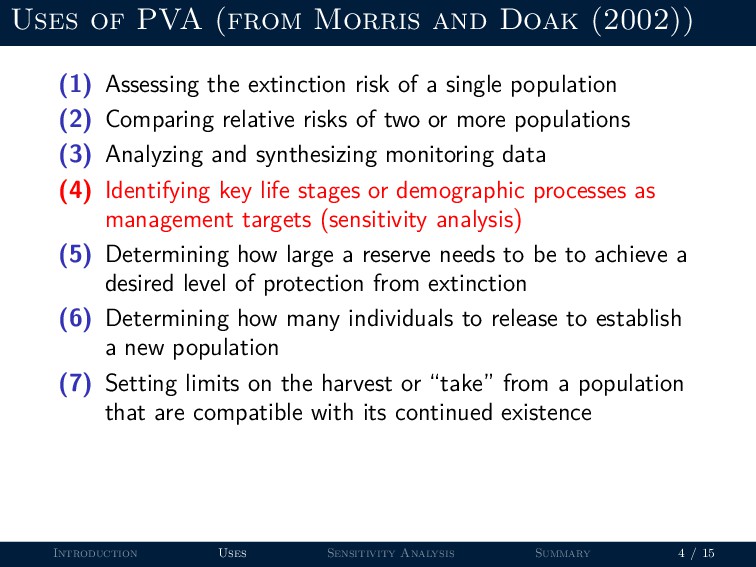
the extinction risk of a single population (2) Comparing relative risks of two or more populations Introduction Uses Sensitivity Analysis Summary 4 / 15
the extinction risk of a single population (2) Comparing relative risks of two or more populations (3) Analyzing and synthesizing monitoring data Introduction Uses Sensitivity Analysis Summary 4 / 15
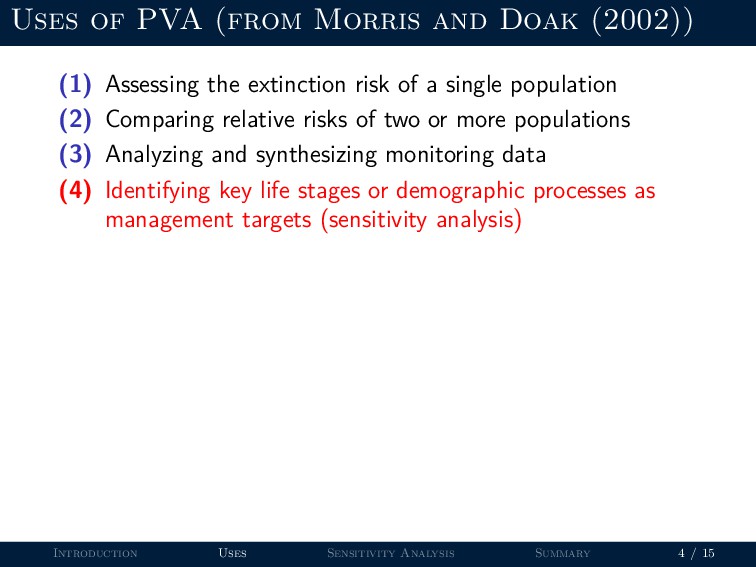
the extinction risk of a single population (2) Comparing relative risks of two or more populations (3) Analyzing and synthesizing monitoring data (4) Identifying key life stages or demographic processes as management targets (sensitivity analysis) Introduction Uses Sensitivity Analysis Summary 4 / 15
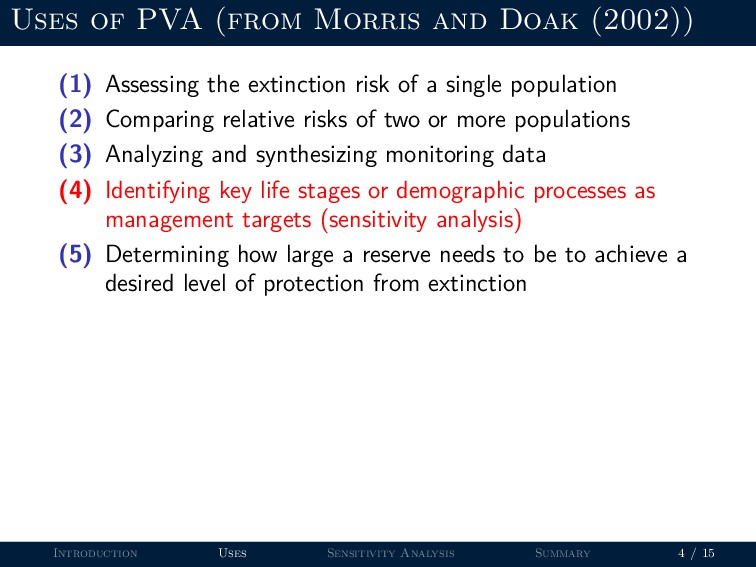
the extinction risk of a single population (2) Comparing relative risks of two or more populations (3) Analyzing and synthesizing monitoring data (4) Identifying key life stages or demographic processes as management targets (sensitivity analysis) (5) Determining how large a reserve needs to be to achieve a desired level of protection from extinction Introduction Uses Sensitivity Analysis Summary 4 / 15
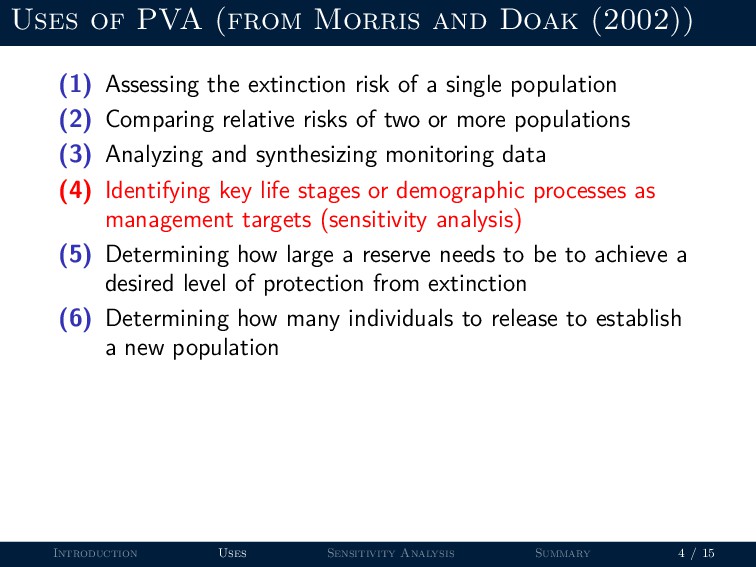
the extinction risk of a single population (2) Comparing relative risks of two or more populations (3) Analyzing and synthesizing monitoring data (4) Identifying key life stages or demographic processes as management targets (sensitivity analysis) (5) Determining how large a reserve needs to be to achieve a desired level of protection from extinction (6) Determining how many individuals to release to establish a new population Introduction Uses Sensitivity Analysis Summary 4 / 15
the extinction risk of a single population (2) Comparing relative risks of two or more populations (3) Analyzing and synthesizing monitoring data (4) Identifying key life stages or demographic processes as management targets (sensitivity analysis) (5) Determining how large a reserve needs to be to achieve a desired level of protection from extinction (6) Determining how many individuals to release to establish a new population (7) Setting limits on the harvest or “take” from a population that are compatible with its continued existence Introduction Uses Sensitivity Analysis Summary 4 / 15
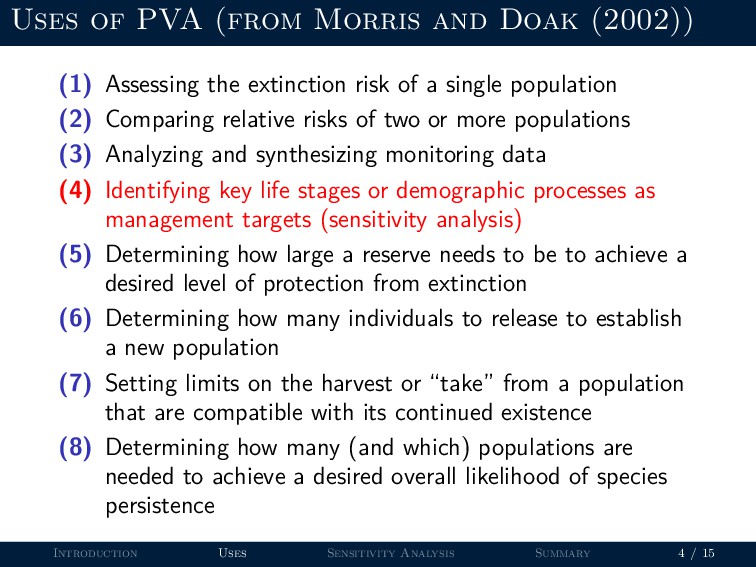
the extinction risk of a single population (2) Comparing relative risks of two or more populations (3) Analyzing and synthesizing monitoring data (4) Identifying key life stages or demographic processes as management targets (sensitivity analysis) (5) Determining how large a reserve needs to be to achieve a desired level of protection from extinction (6) Determining how many individuals to release to establish a new population (7) Setting limits on the harvest or “take” from a population that are compatible with its continued existence (8) Determining how many (and which) populations are needed to achieve a desired overall likelihood of species persistence Introduction Uses Sensitivity Analysis Summary 4 / 15
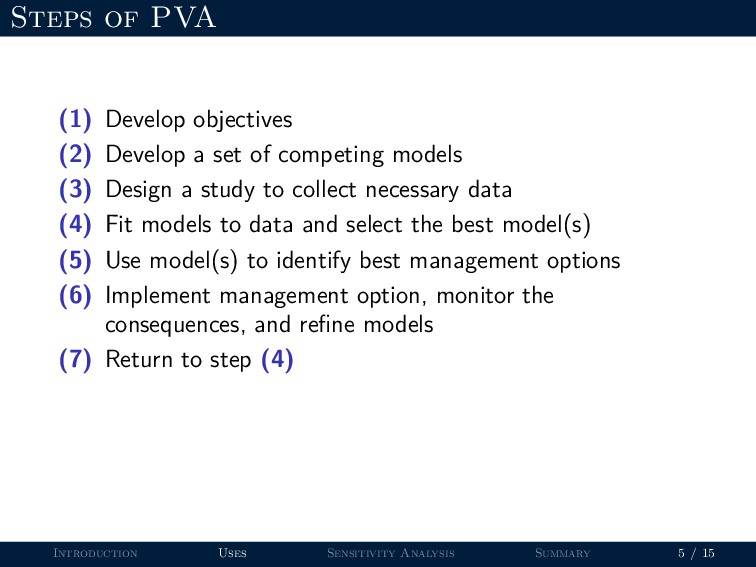
of competing models (3) Design a study to collect necessary data (4) Fit models to data and select the best model(s) (5) Use model(s) to identify best management options (6) Implement management option, monitor the consequences, and refine models (7) Return to step (4) Introduction Uses Sensitivity Analysis Summary 5 / 15
of competing models (3) Design a study to collect necessary data (4) Fit models to data and select the best model(s) (5) Use model(s) to identify best management options (6) Implement management option, monitor the consequences, and refine models (7) Return to step (4) Very similar to adaptive management Introduction Uses Sensitivity Analysis Summary 5 / 15
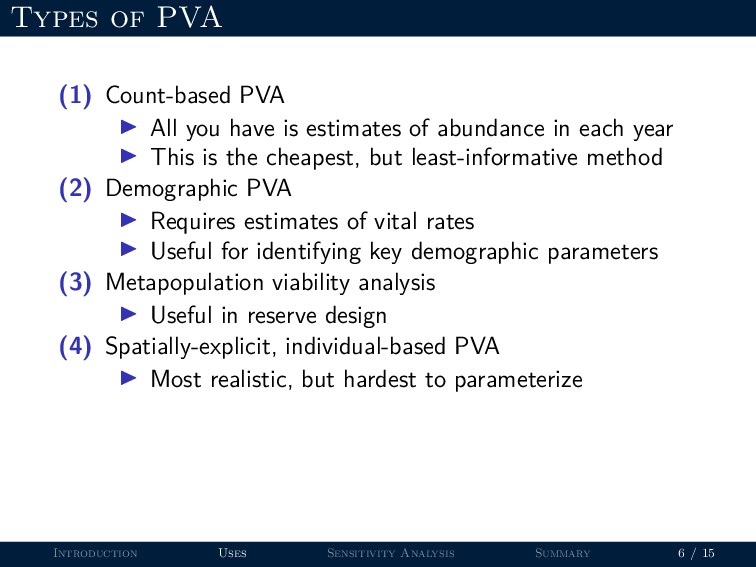
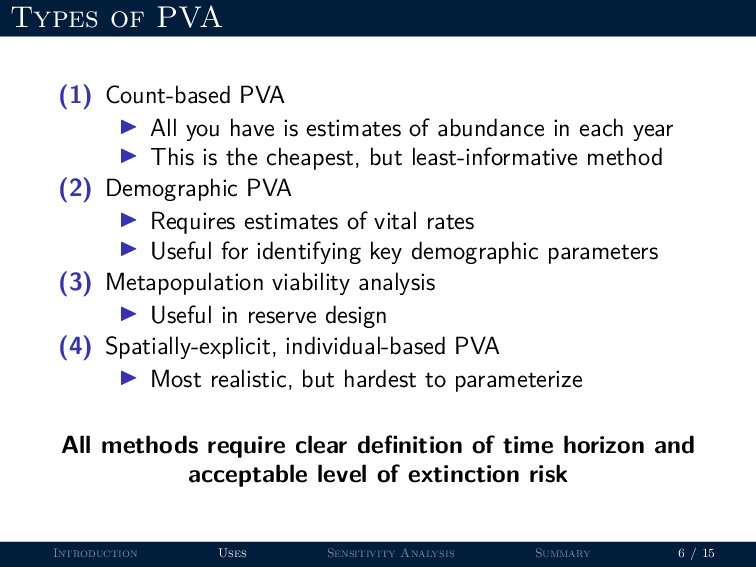
estimates of abundance in each year This is the cheapest, but least-informative method (2) Demographic PVA Requires estimates of vital rates Useful for identifying key demographic parameters (3) Metapopulation viability analysis Useful in reserve design (4) Spatially-explicit, individual-based PVA Most realistic, but hardest to parameterize Introduction Uses Sensitivity Analysis Summary 6 / 15
estimates of abundance in each year This is the cheapest, but least-informative method (2) Demographic PVA Requires estimates of vital rates Useful for identifying key demographic parameters (3) Metapopulation viability analysis Useful in reserve design (4) Spatially-explicit, individual-based PVA Most realistic, but hardest to parameterize All methods require clear definition of time horizon and acceptable level of extinction risk Introduction Uses Sensitivity Analysis Summary 6 / 15
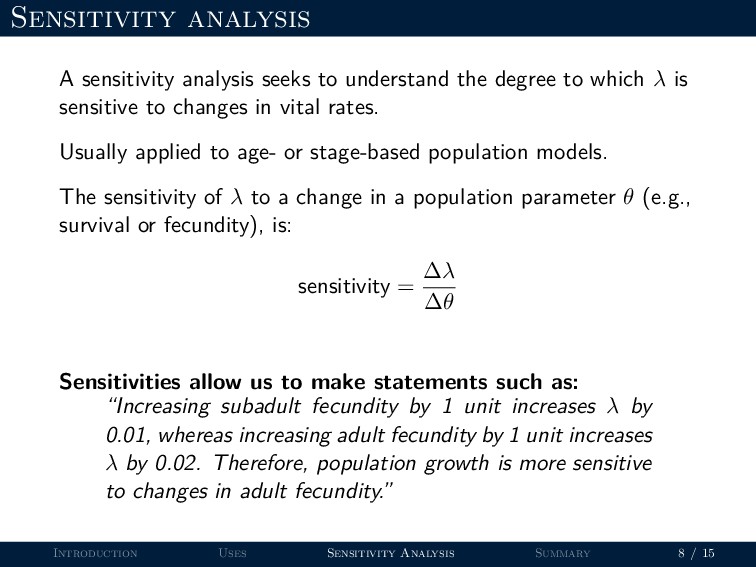
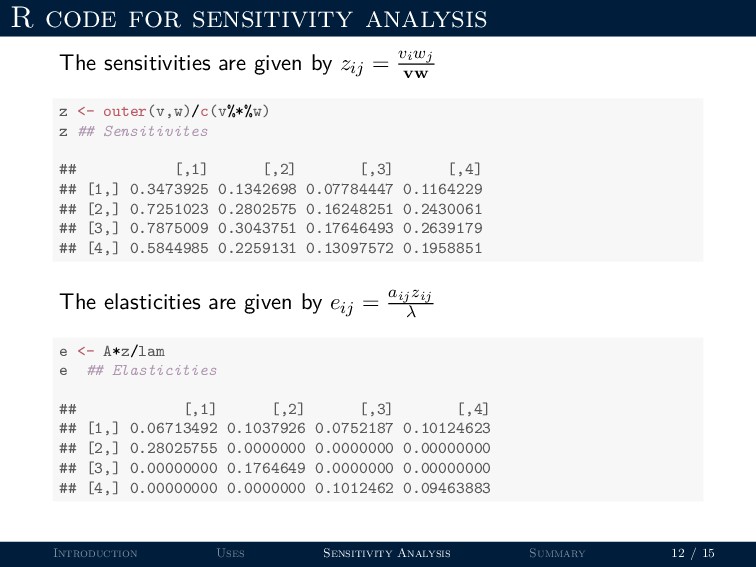
to which λ is sensitive to changes in vital rates. Usually applied to age- or stage-based population models. Introduction Uses Sensitivity Analysis Summary 8 / 15
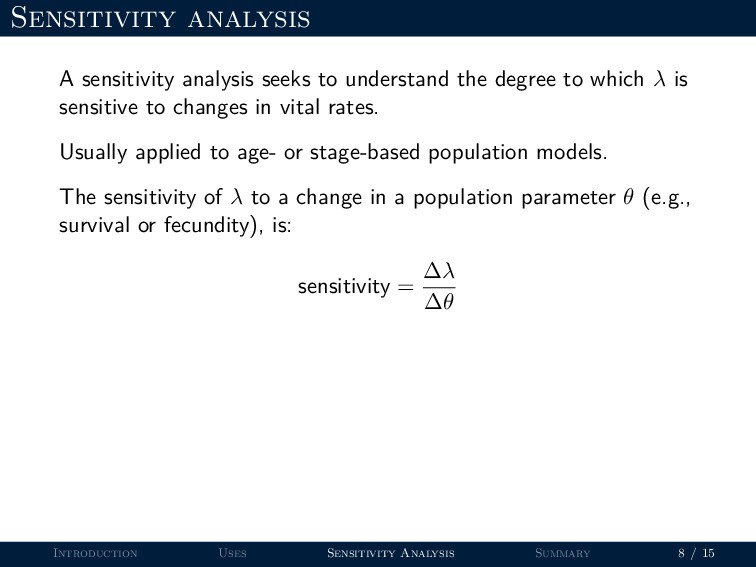
to which λ is sensitive to changes in vital rates. Usually applied to age- or stage-based population models. The sensitivity of λ to a change in a population parameter θ (e.g., survival or fecundity), is: sensitivity = ∆λ ∆θ Introduction Uses Sensitivity Analysis Summary 8 / 15
to which λ is sensitive to changes in vital rates. Usually applied to age- or stage-based population models. The sensitivity of λ to a change in a population parameter θ (e.g., survival or fecundity), is: sensitivity = ∆λ ∆θ Sensitivities allow us to make statements such as: “Increasing subadult fecundity by 1 unit increases λ by 0.01, whereas increasing adult fecundity by 1 unit increases λ by 0.02. Therefore, population growth is more sensitive to changes in adult fecundity.” Introduction Uses Sensitivity Analysis Summary 8 / 15
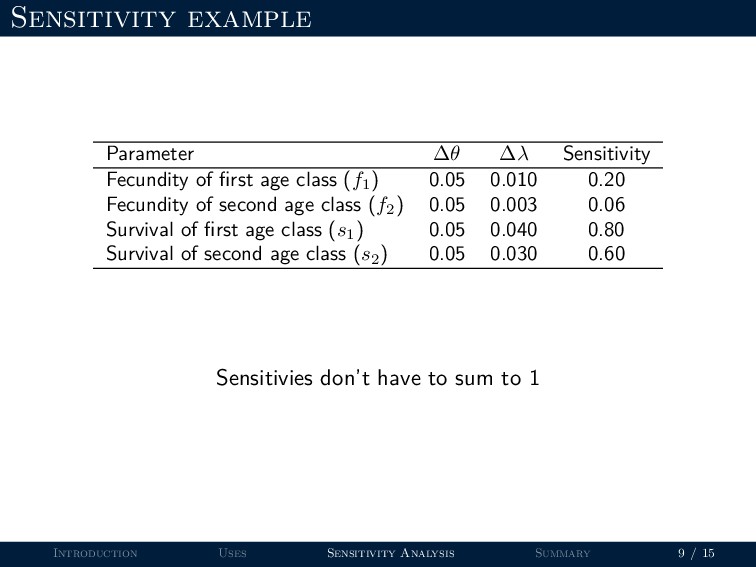
class (f1 ) 0.05 0.010 0.20 Fecundity of second age class (f2 ) 0.05 0.003 0.06 Survival of first age class (s1 ) 0.05 0.040 0.80 Survival of second age class (s2 ) 0.05 0.030 0.60 Sensitivies don’t have to sum to 1 Introduction Uses Sensitivity Analysis Summary 9 / 15
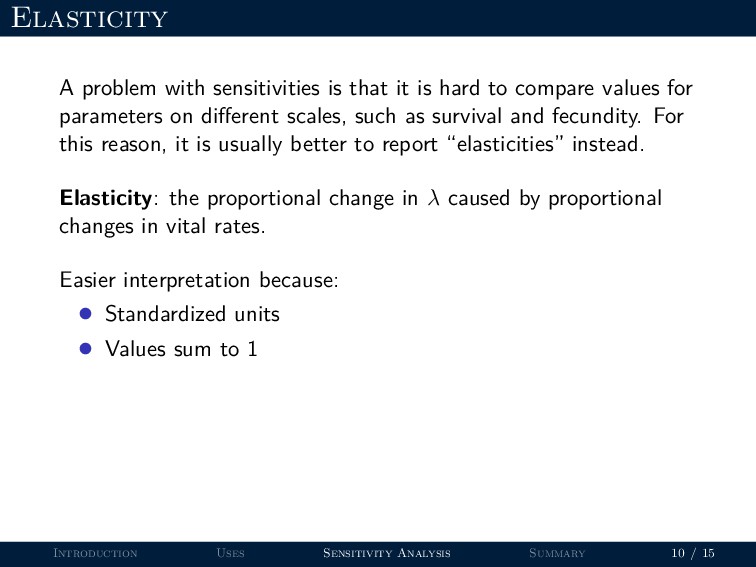
to compare values for parameters on different scales, such as survival and fecundity. For this reason, it is usually better to report “elasticities” instead. Introduction Uses Sensitivity Analysis Summary 10 / 15
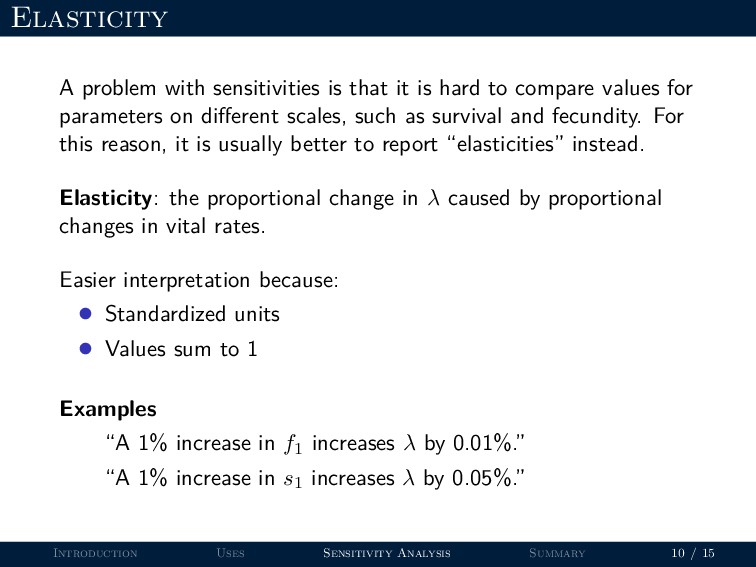
to compare values for parameters on different scales, such as survival and fecundity. For this reason, it is usually better to report “elasticities” instead. Elasticity: the proportional change in λ caused by proportional changes in vital rates. Introduction Uses Sensitivity Analysis Summary 10 / 15
to compare values for parameters on different scales, such as survival and fecundity. For this reason, it is usually better to report “elasticities” instead. Elasticity: the proportional change in λ caused by proportional changes in vital rates. Easier interpretation because: • Standardized units • Values sum to 1 Introduction Uses Sensitivity Analysis Summary 10 / 15
to compare values for parameters on different scales, such as survival and fecundity. For this reason, it is usually better to report “elasticities” instead. Elasticity: the proportional change in λ caused by proportional changes in vital rates. Easier interpretation because: • Standardized units • Values sum to 1 Examples “A 1% increase in f1 increases λ by 0.01%.” “A 1% increase in s1 increases λ by 0.05%.” Introduction Uses Sensitivity Analysis Summary 10 / 15
λ given an absolute change in a parameter. Elasticity measures the proportional change in λ given a proportional change in a parameter. Introduction Uses Sensitivity Analysis Summary 13 / 15
too much data. • But what is the alternative? • When data are limited (and they always are), you must decrease the time horizon and acknowledge uncertainty in decision process. Introduction Uses Sensitivity Analysis Summary 15 / 15