mass extinction event • At least 1000 species have gone extinct over past 500 years Introduction Deterministic Models Stochastic Models Allee effects 3 / 15
mass extinction event • At least 1000 species have gone extinct over past 500 years • Extinction rate unknown, but may be 100-1000 times higher than during the past 25 million years Introduction Deterministic Models Stochastic Models Allee effects 3 / 15
mass extinction event • At least 1000 species have gone extinct over past 500 years • Extinction rate unknown, but may be 100-1000 times higher than during the past 25 million years • Almost 200 bird species have gone extinct since 1500 Introduction Deterministic Models Stochastic Models Allee effects 3 / 15
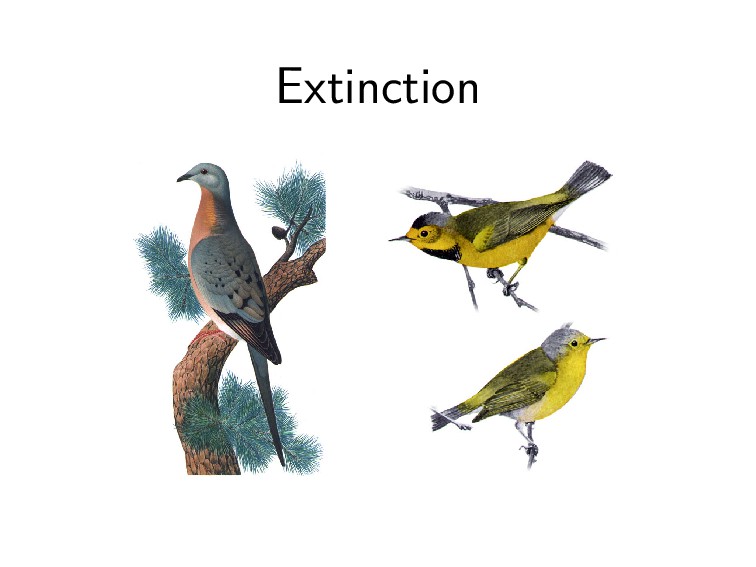
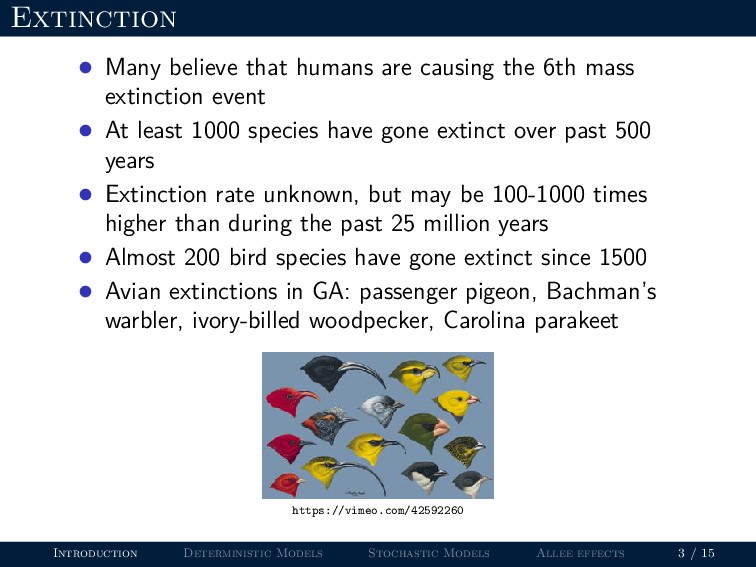
mass extinction event • At least 1000 species have gone extinct over past 500 years • Extinction rate unknown, but may be 100-1000 times higher than during the past 25 million years • Almost 200 bird species have gone extinct since 1500 • Avian extinctions in GA: passenger pigeon, Bachman’s warbler, ivory-billed woodpecker, Carolina parakeet Introduction Deterministic Models Stochastic Models Allee effects 3 / 15
mass extinction event • At least 1000 species have gone extinct over past 500 years • Extinction rate unknown, but may be 100-1000 times higher than during the past 25 million years • Almost 200 bird species have gone extinct since 1500 • Avian extinctions in GA: passenger pigeon, Bachman’s warbler, ivory-billed woodpecker, Carolina parakeet https://vimeo.com/42592260 Introduction Deterministic Models Stochastic Models Allee effects 3 / 15
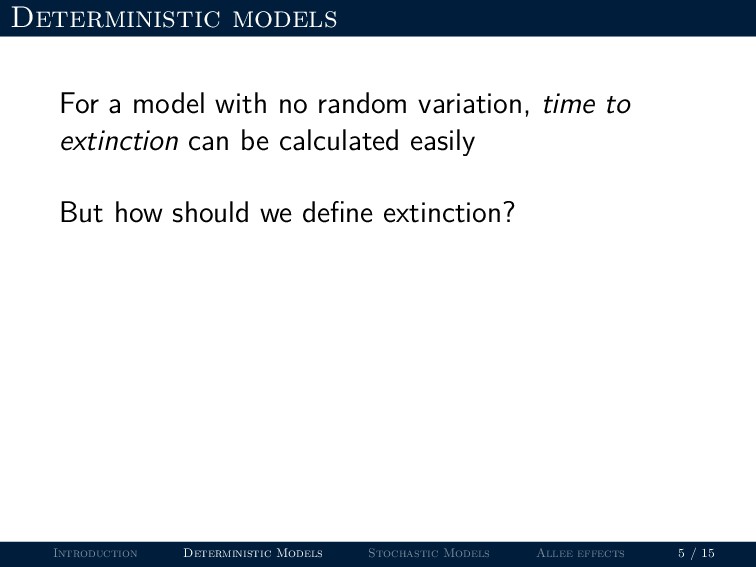
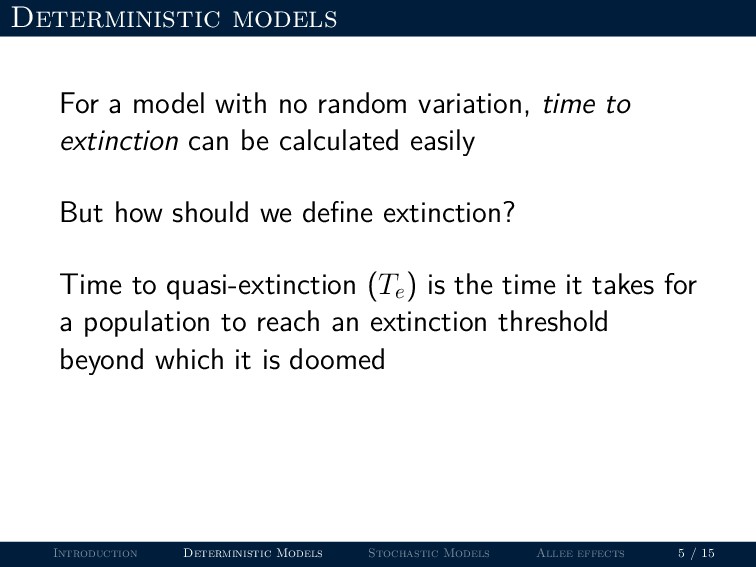
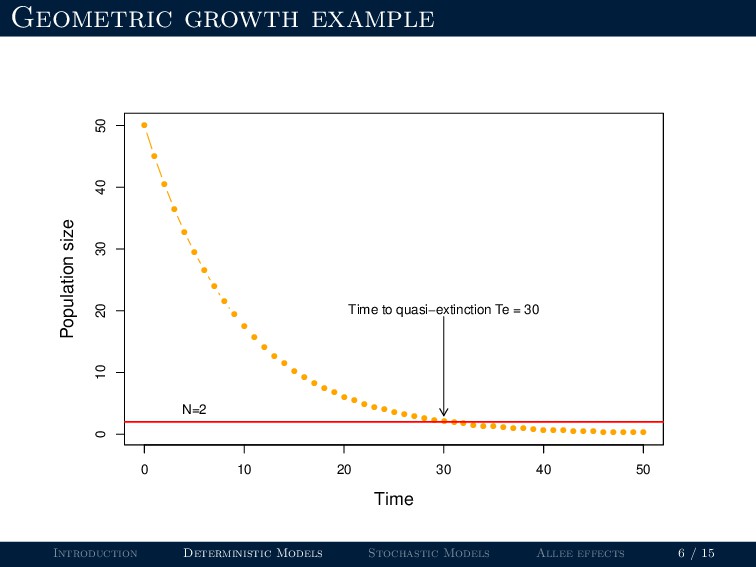
to extinction can be calculated easily But how should we define extinction? Time to quasi-extinction (Te ) is the time it takes for a population to reach an extinction threshold beyond which it is doomed Introduction Deterministic Models Stochastic Models Allee effects 5 / 15
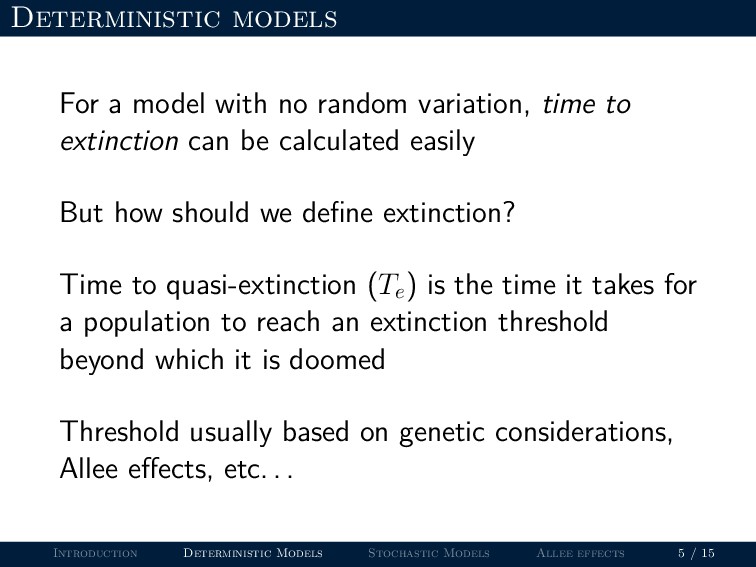
to extinction can be calculated easily But how should we define extinction? Time to quasi-extinction (Te ) is the time it takes for a population to reach an extinction threshold beyond which it is doomed Threshold usually based on genetic considerations, Allee effects, etc. . . Introduction Deterministic Models Stochastic Models Allee effects 5 / 15
we are now interested in extinction risk Extinction risk is the probability that a species goes extinct in some time period Introduction Deterministic Models Stochastic Models Allee effects 7 / 15
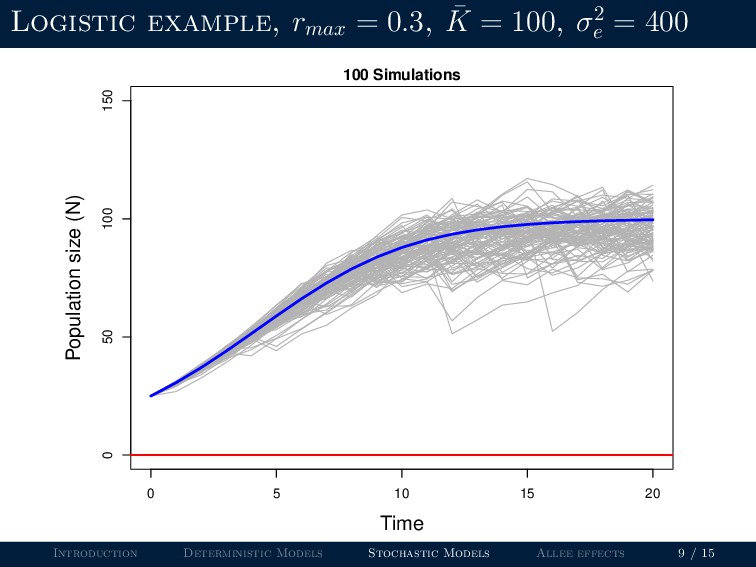
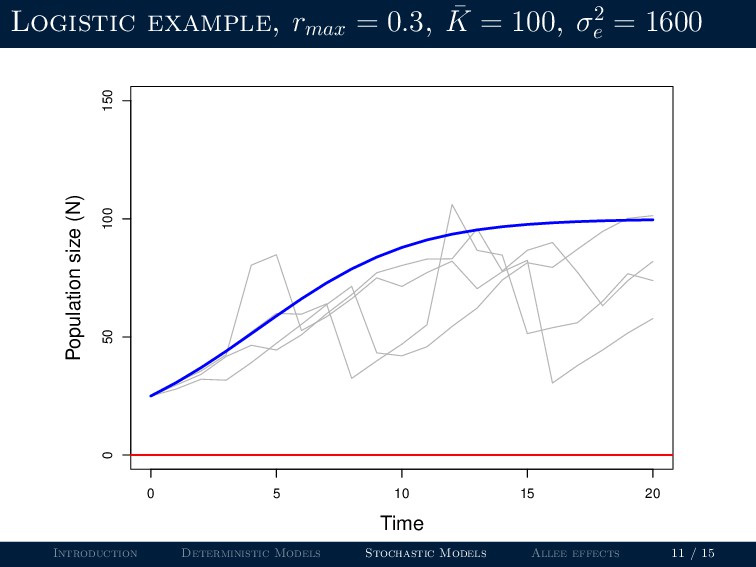
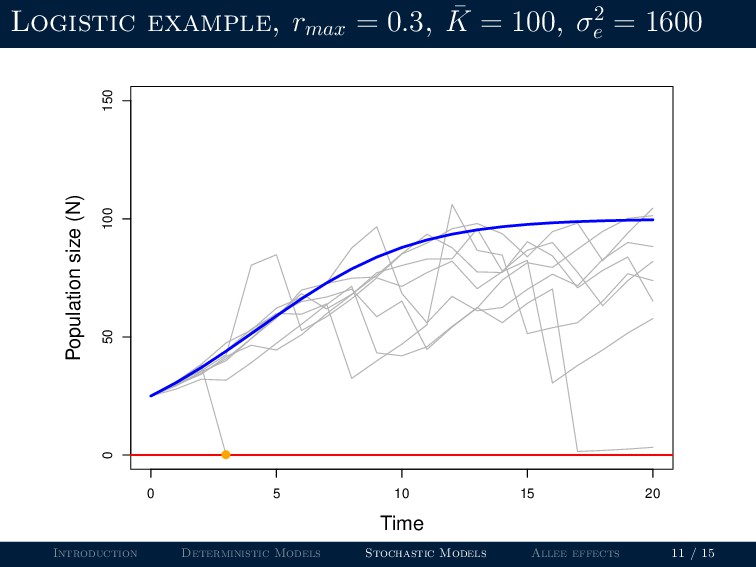
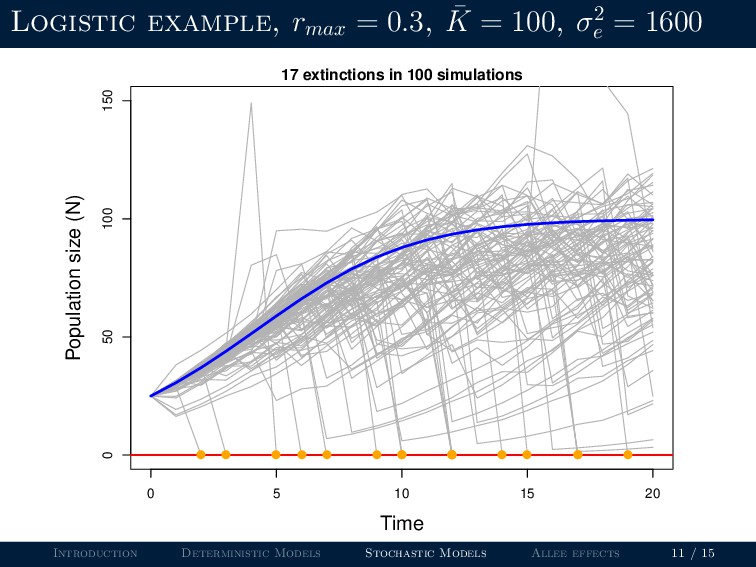
we are now interested in extinction risk Extinction risk is the probability that a species goes extinct in some time period For a stochastic model, extinction risk can be calculated as the proportion of simulations in which the population goes extinct. Introduction Deterministic Models Stochastic Models Allee effects 7 / 15
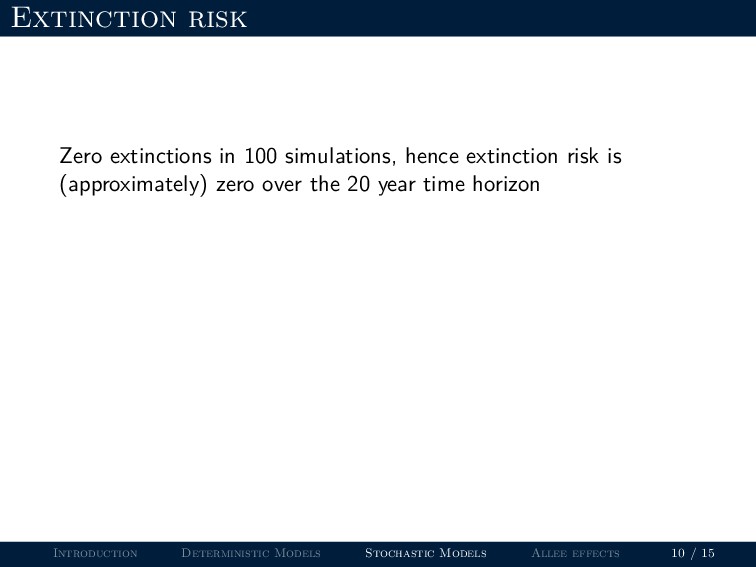
we are now interested in extinction risk Extinction risk is the probability that a species goes extinct in some time period For a stochastic model, extinction risk can be calculated as the proportion of simulations in which the population goes extinct. Calculating extinction risk requires a specification of the time horizon of interest Introduction Deterministic Models Stochastic Models Allee effects 7 / 15
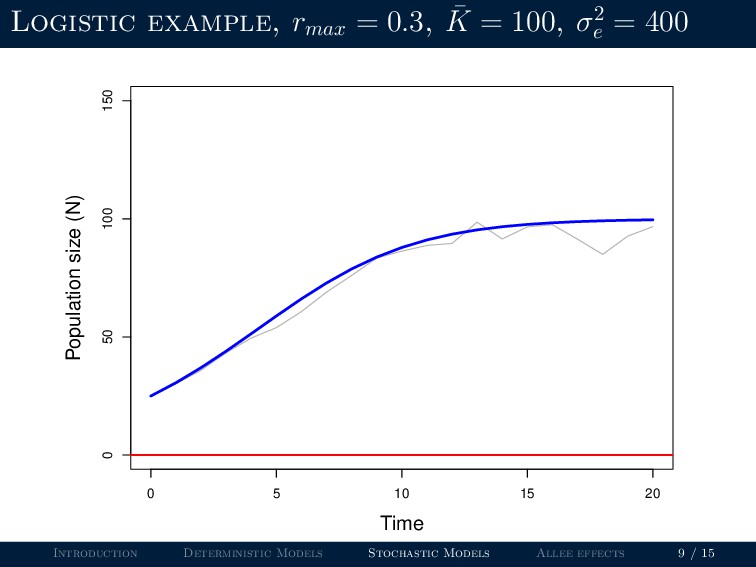
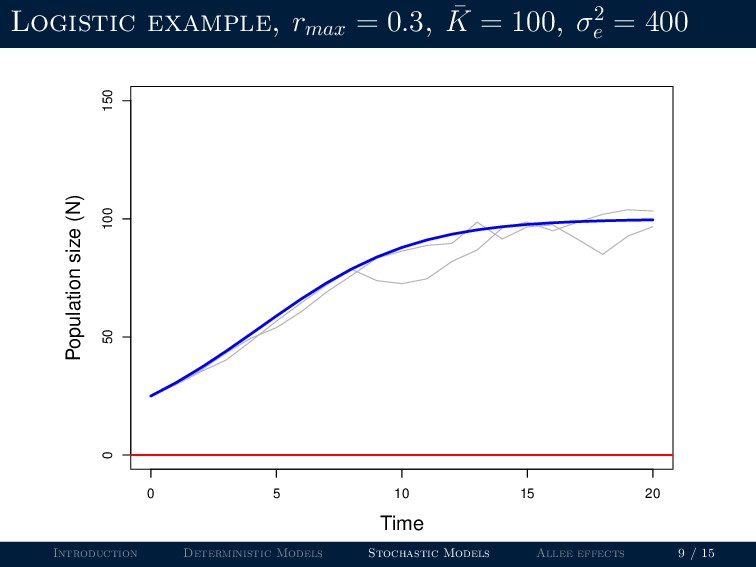
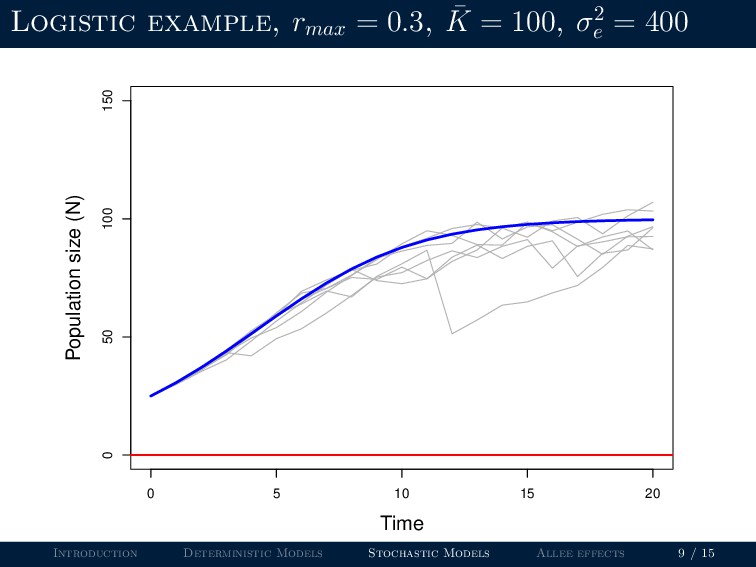
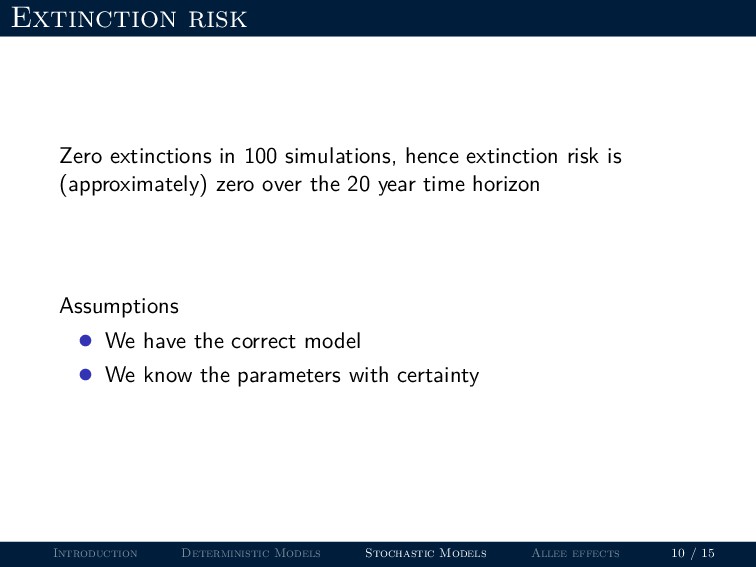
is (approximately) zero over the 20 year time horizon Assumptions • We have the correct model • We know the parameters with certainty Introduction Deterministic Models Stochastic Models Allee effects 10 / 15
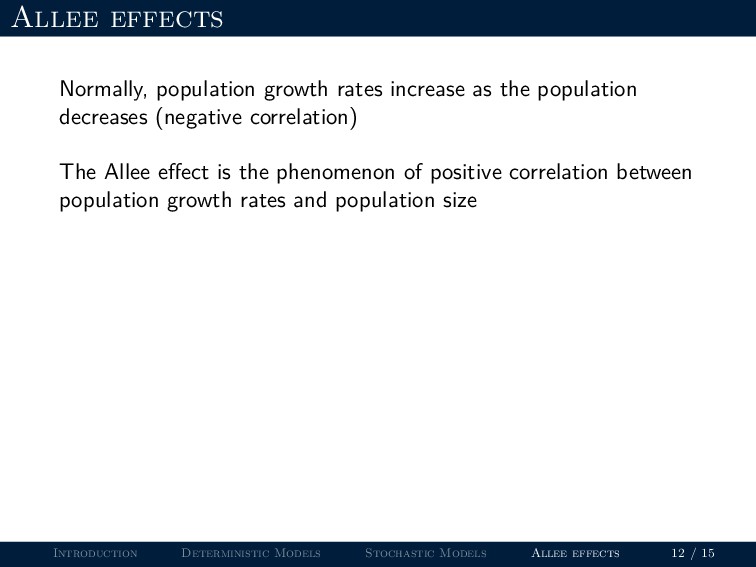
decreases (negative correlation) The Allee effect is the phenomenon of positive correlation between population growth rates and population size Introduction Deterministic Models Stochastic Models Allee effects 12 / 15
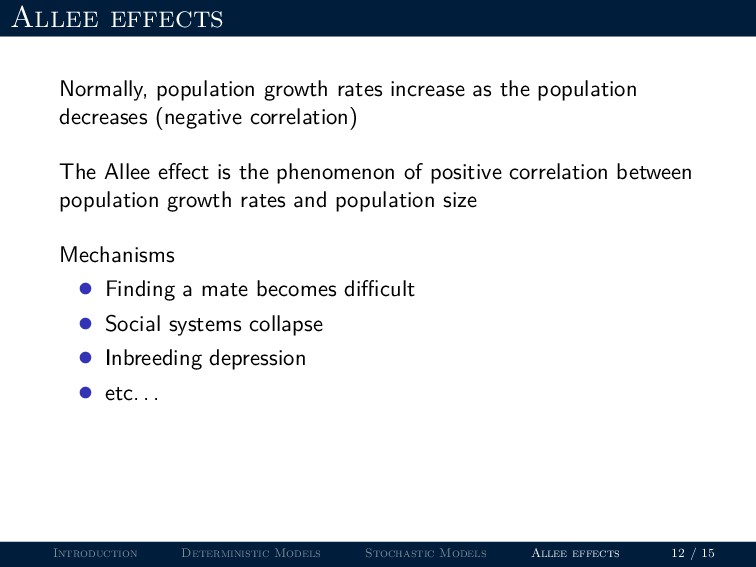
decreases (negative correlation) The Allee effect is the phenomenon of positive correlation between population growth rates and population size Mechanisms • Finding a mate becomes difficult • Social systems collapse • Inbreeding depression • etc. . . Introduction Deterministic Models Stochastic Models Allee effects 12 / 15
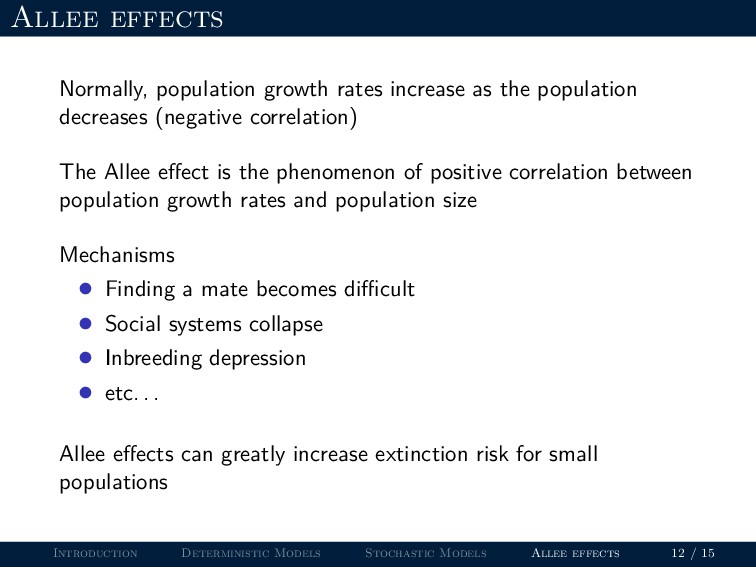
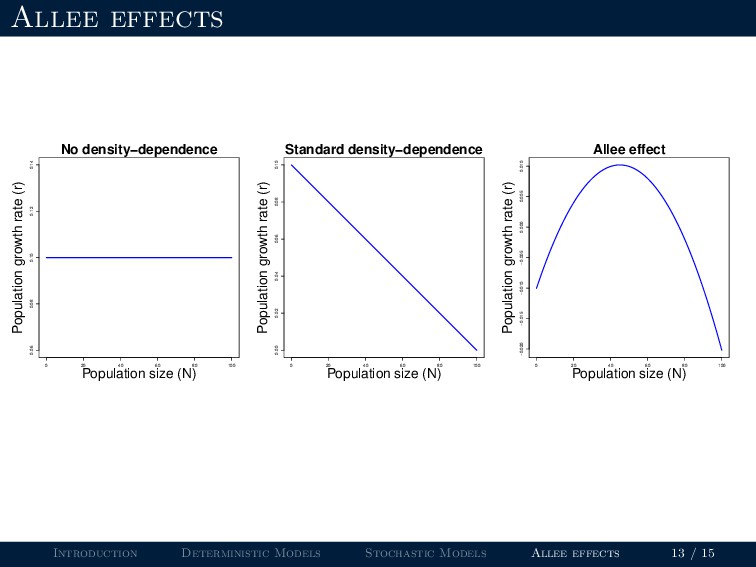
decreases (negative correlation) The Allee effect is the phenomenon of positive correlation between population growth rates and population size Mechanisms • Finding a mate becomes difficult • Social systems collapse • Inbreeding depression • etc. . . Allee effects can greatly increase extinction risk for small populations Introduction Deterministic Models Stochastic Models Allee effects 12 / 15
to predict time to extinction and extinction risk Models can be used to assess effects of management actions on extinction risk Introduction Deterministic Models Stochastic Models Allee effects 14 / 15