Upgrade to Pro — share decks privately, control downloads, hide ads and more …

The Government That Swallowed a Pond (Using Open Data and GIS to Inform Policy and Influence Behaviour)

Peter Rukavina
November 29, 2019

The Government That Swallowed a Pond (Using Open Data and GIS to Inform Policy and Influence Behaviour)

A talked delivered to the Engineers PEI Annual Meeting on November 29, 2019 focusing on using data from access requests on the home and work locations of public employees, along with GIS tools, as the basis for influencing public policy and behaviour on the shift to active transportation.

Peter Rukavina

November 29, 2019
Tweet

More Decks by Peter Rukavina

Other Decks in Research

Transcript

  1. The Government That
    Swallowed a Pond
    (Using Open Data and GIS to 

    Inform Policy and Influence Behaviour)
    Engineers PEI Annual General Meeting
    November 29, 2019
    Rodd Charlottetown Hotel
    Peter Rukavina

    Hacker in Residence, Robertson Library, University of Prince Edward Island

    [email protected]

    orcid.org/0000-0002-7690-4909

    View Slide

  2. Provincial Admin Buildings
    Image from Google Street View, Captured October 2015

    View Slide

  3. Provincial Admin Buildings
    Image from Google Street View, Captured October 2015

    View Slide

  4. Panoramic
    view of
    Charlottetown
    1878

    View Slide

  5. Map of the
    City of
    Charlottetown

    1880

    View Slide

  6. Fire Insurance
    Map, Public
    Archives and
    Records
    Office

    1903

    View Slide

  7. Fire Insurance
    Map, Public
    Archives and
    Records
    Office

    1903

    View Slide

  8. Plan of
    Township No.
    48, Public
    Archives and
    Records
    Office

    1915

    View Slide

  9. Brighton Street, Prince Edward Island Post Card Collection

    (Postcards collected by Boyde Beck, Prince Edward Island Museum and Heritage Foundation)

    View Slide

  10. Brighton Pond, Prince Edward Island Post Card Collection

    (Postcards collected by Boyde Beck, Prince Edward Island Museum and Heritage Foundation)

    View Slide

  11. Government Pond, Prince Edward Island Post Card Collection

    (Postcards collected by Boyde Beck, Prince Edward Island Museum and Heritage Foundation)

    View Slide

  12. View at Government Pond, Prince Edward Island Post Card Collection

    (Postcards collected by Boyde Beck, Prince Edward Island Museum and Heritage Foundation)

    View Slide

  13. Entrance to Government House, Prince Edward Island Post Card Collection

    (Postcards collected by Boyde Beck, Prince Edward Island Museum and Heritage Foundation)

    View Slide

  14. Charlottetown Aerial, Prince Edward Island Post Card Collection

    (Postcards collected by Boyde Beck, Prince Edward Island Museum and Heritage Foundation)

    View Slide

  15. 1935
    0 Spaces
    1935 Aerial
    Survey,
    National Air
    Photo Library,
    Natural
    Resources
    Canada

    View Slide

  16. 1968
    150 Spaces
    1968 Aerial
    Survey,
    National Air
    Photo Library,
    Natural
    Resources
    Canada

    View Slide

  17. 2010
    330 Spaces
    2010 Aerial
    Survey,
    Province of
    Prince
    Edward
    Island

    View Slide

  18. View Slide

  19. “A spreadsheet providing the postal
    code of the home address of each
    employee of the PEI public service,
    across all departments and agencies,
    and the civic address (or, if not available,
    building name) of their primary work
    location.”

    View Slide

  20. View Slide

  21. View Slide

  22. But…
    Apparently “each employee of the PEI
    public service,” doesn’t mean “everyone
    who works for government. So…
    A spreadsheet, or CSV file, providing the postal
    code of the home address of each employee of
    Health PEI, and the building name and civic
    address (or, if not available, building name) of
    their primary work location.
    A spreadsheet, or CSV file, providing the postal
    code of the home address of each employee of
    Innovation PEI, Financial PEI, Bio-Foods and
    IIDI and the building name and civic address (or,
    if not available, building name) of their primary
    work location.
    A spreadsheet, or CSV file, providing the postal
    code of the home address of each employee of
    Public Schools Branch, and the building name
    and civic address (or, if not available, building
    name) of their primary work location.
    2 3
    4

    View Slide

  23. Transform the Data
    • Convert from Excel to CSV.

    • Combine the data from four access requests.

    • Normalize postal codes (COA 1H0 to C0A 1H0, etc.).

    • Convert to a format that I can import into GIS.

    • Geocode the postal codes.

    • Accurate, up-to-date sources of postal code data are
    hard to find, and not free.

    View Slide

  24. Normalize and Combine
    postalcode,work_location,employee_count
    B2G 0E2,"Brudenell Admin Office",1
    B2X 2T5,"Provincial Admin Building",1
    B3L 3B4,"Sherwood Business Centre",1
    B4P 0C5,"Holman Building (Ch'town)",1
    B4V 2S1,"Red Road Homes",1
    C0A 0H9,"Ch'Town Government Garage",1
    C0A 1A0,"185 Beach Grove Road",1
    C0A 1A0,"40 Enman Crescent",1
    C0A 1A0,"40A Burns Ave.",1
    C0A 1A0,"Borden Scale House",1
    C0A 1A0,"Brudenell Admin Office",1
    C0A 1A0,"Brudenell Golf",1
    C0A 1A0,"Ch'Town Government Garage",3
    C0A 1A0,"Coles Building",1
    C0A 1A0,"Frank Gaudet Nursery",1
    C0A 1A0,"Georgetown Government Garage",1
    C0A 1A0,"J. Angus MacLean Bldg",1
    C0A 1A0,"Montague Cannabis Store",2
    C0A 1A0,"Northumberland Park",1
    C0A 1A0,"Orwell Corner Museum",1
    C0A 1A0,"PEI Medicare Office",2
    C0A 1A0,"Provincial Admin Building",11

    View Slide

  25. Canadian Postal Code Data
    postalcode,latitude,longitude,city,confidence
    C0A 0H9,46.3756,-62.7209,Suffolk,0.9
    C0A 1C0,46.2284,-63.3454,Bonshaw,0.9
    C0A 1E0,46.3592,-63.4965,Lot 21,0.9
    C0A 1G0,46.2612,-62.5501,ROAD,0.9
    C0A 1H2,46.1814,-63.1856,Lot 65,0.9
    C0A 1H6,46.1611,-63.2387,Lot 65,0.9
    C0A 1H7,46.1595,-63.3,Lot 65,0.9
    C0A 1H9,46.2609,-63.2471,Lot 31,0.9
    C0A 1J0,46.2273,-63.4468,Crapaud,0.9
    C0A 1K0,46.4417,-62.0669,Souris,0.9
    C0A 1R0,46.1125,-62.588,Lot,0.9
    C0A 1S0,46.4191,-62.706,Morell,0.9
    C0A 2B0,46.4053,-62.2983,Souris,0.9
    C0B 1A0,46.2836,-63.6373,Albany,0.9
    C0B 1C0,46.3266,-63.7506,Lot 26,0.9
    C0B 1H0,46.6822,-64.0728,Coleman,0.9
    C0B 1N0,46.326,-63.6255,Kinkora,0.9
    C0B 1V0,46.7179,-64.2062,O'Leary,0.9
    C0B 2B0,46.9578,-64.0352,Tignish,0.9
    geocoder.ca

    View Slide

  26. Geocoded Result
    postalcode,work_location,employee_count,latitude,longitude
    C0A 1A0,101 Belvedere Ave, Charlottetown,1,46.0851,-62.8832
    C0A 1A0,16 
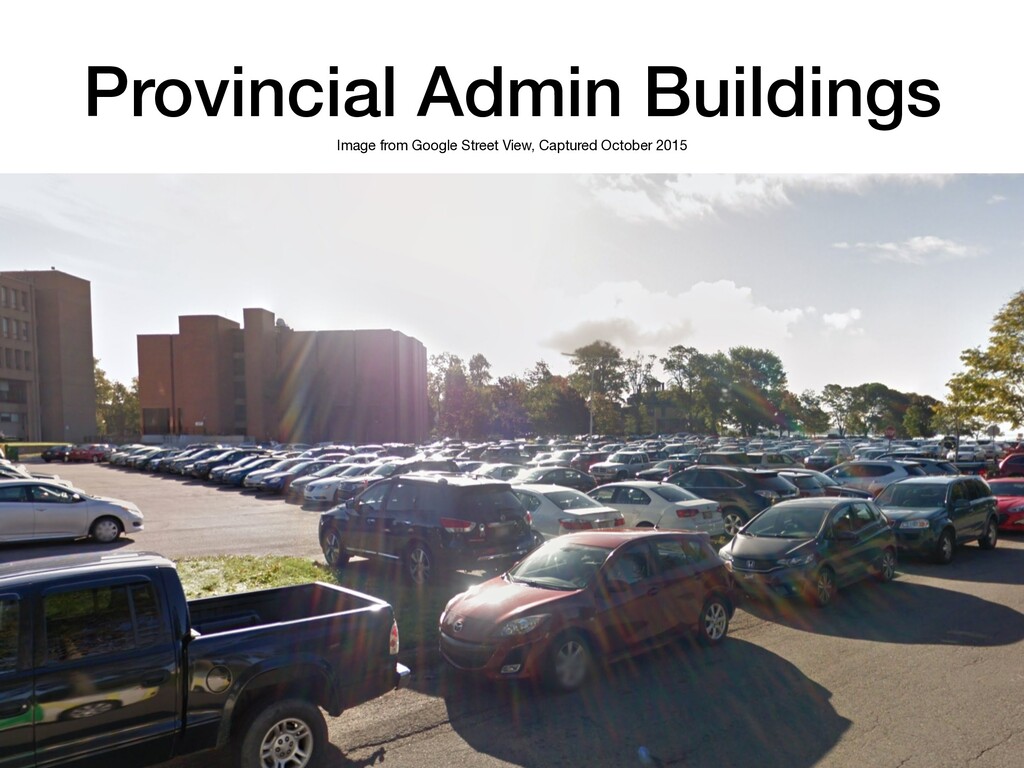
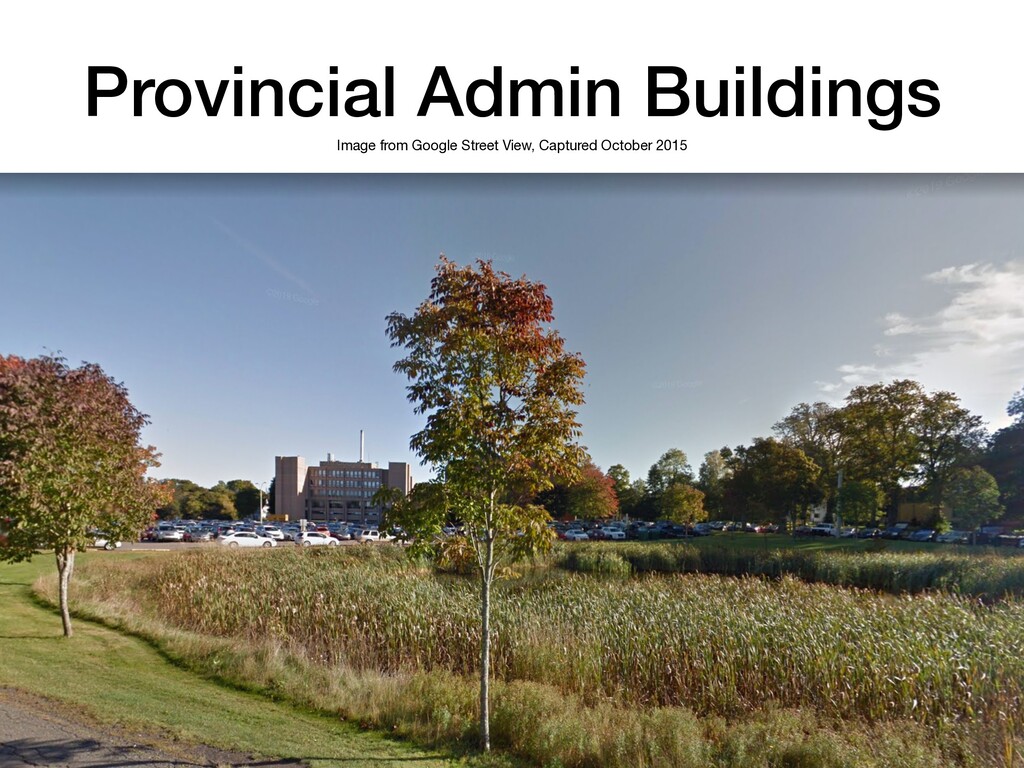
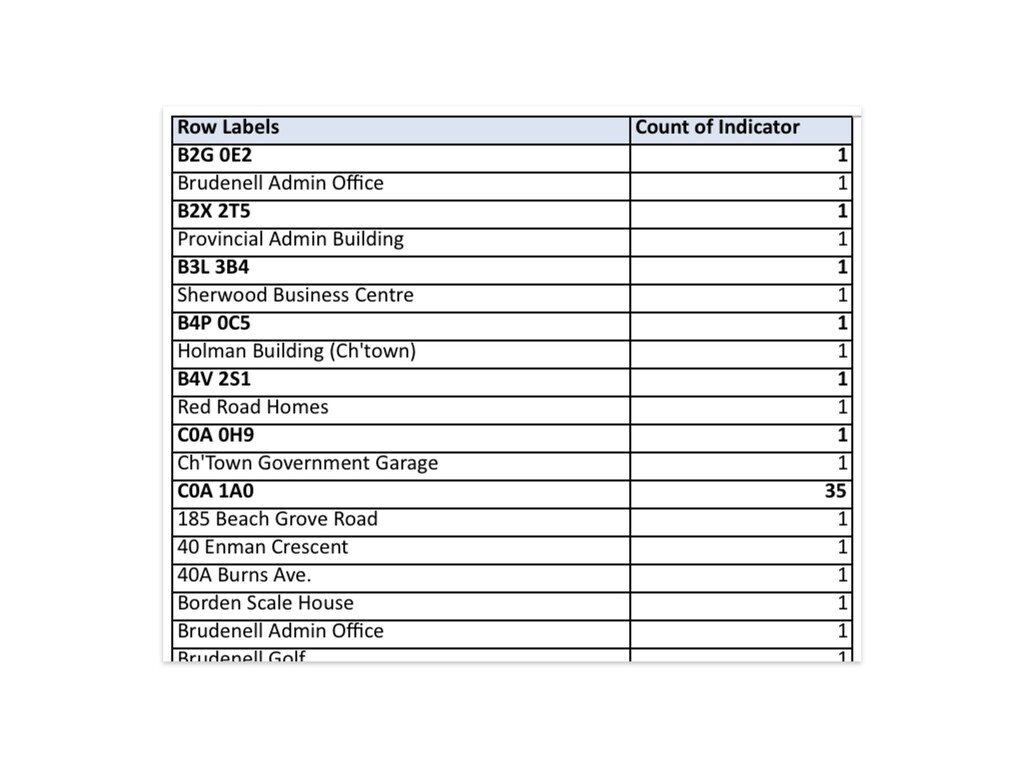
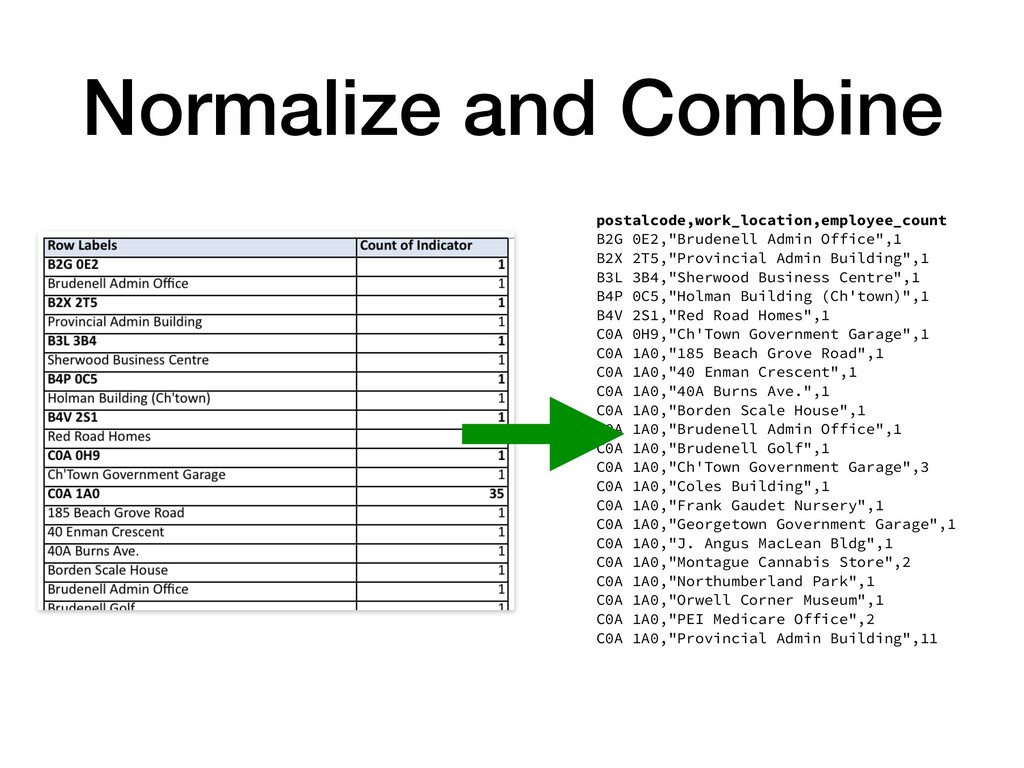
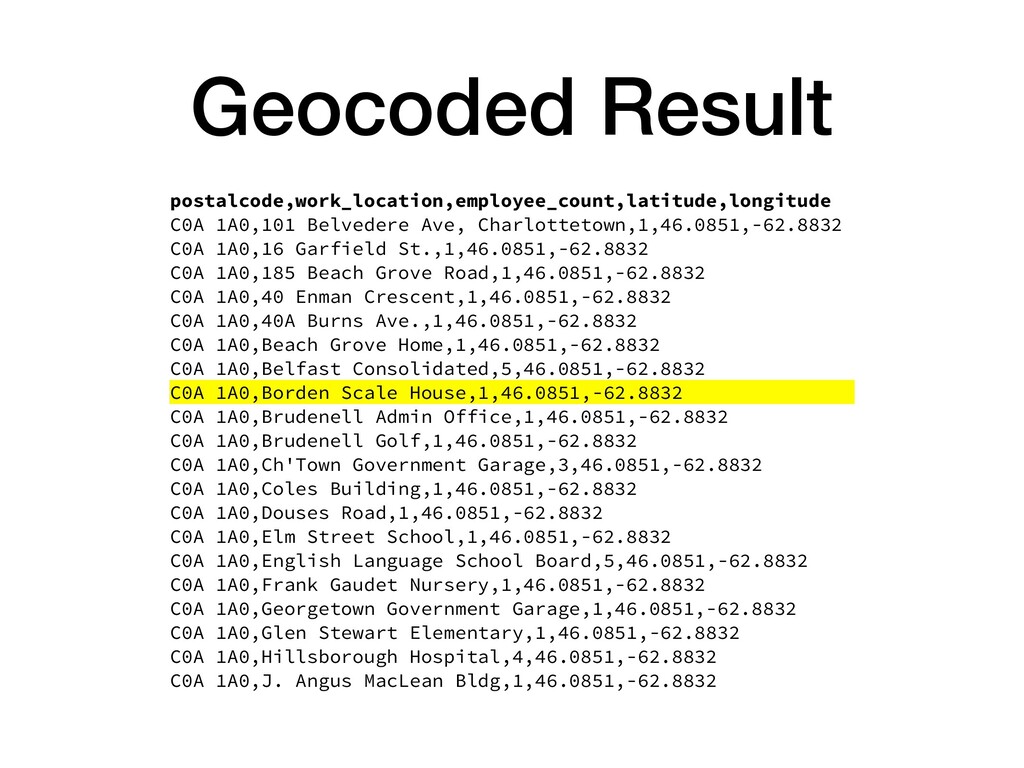
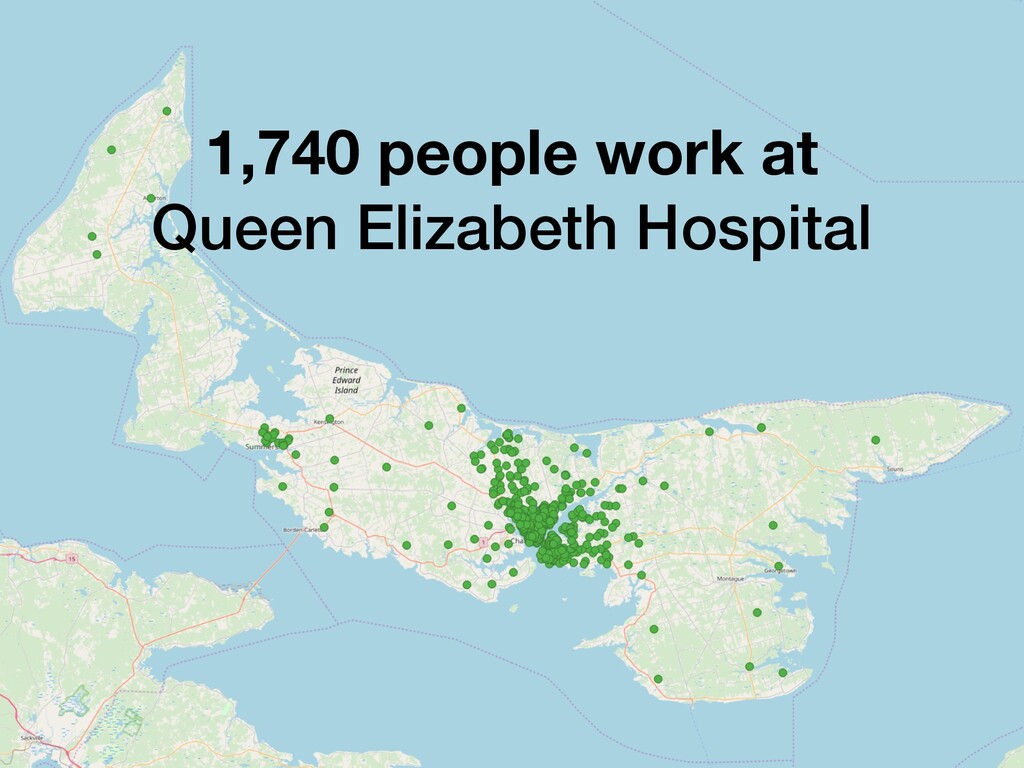
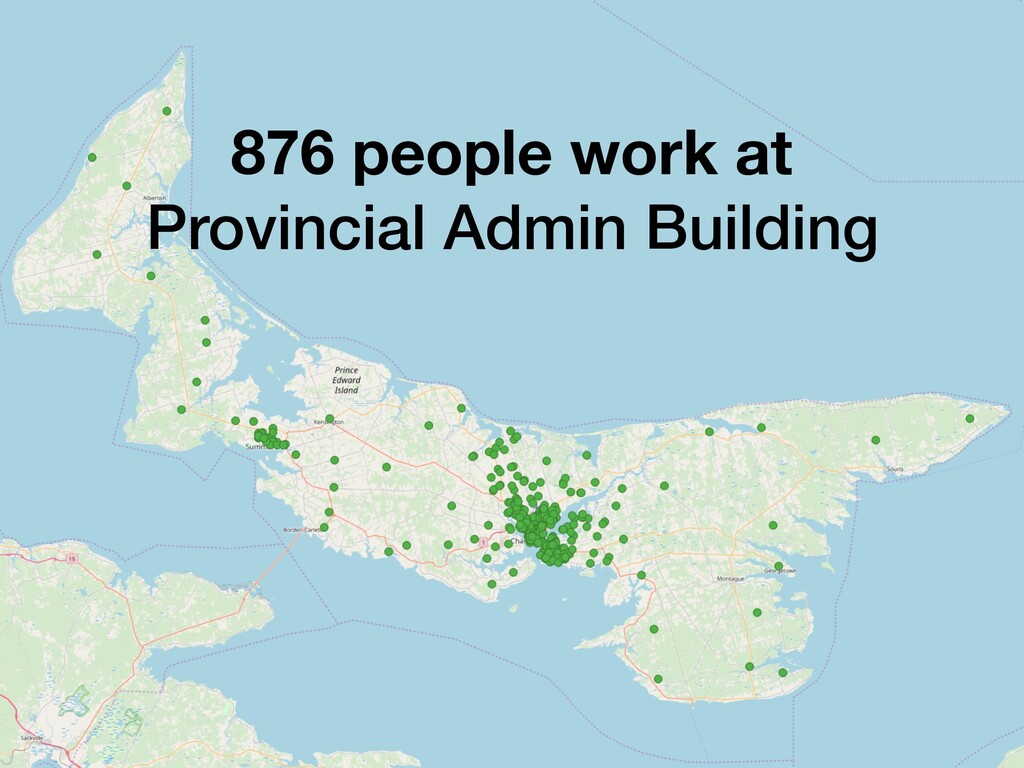
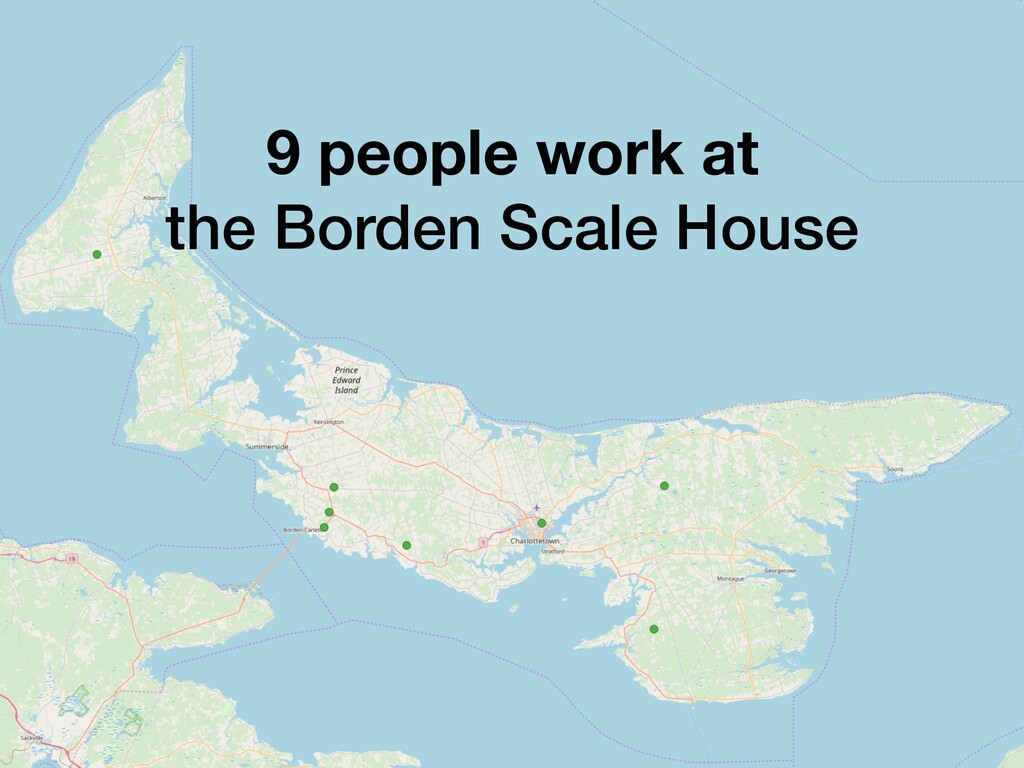
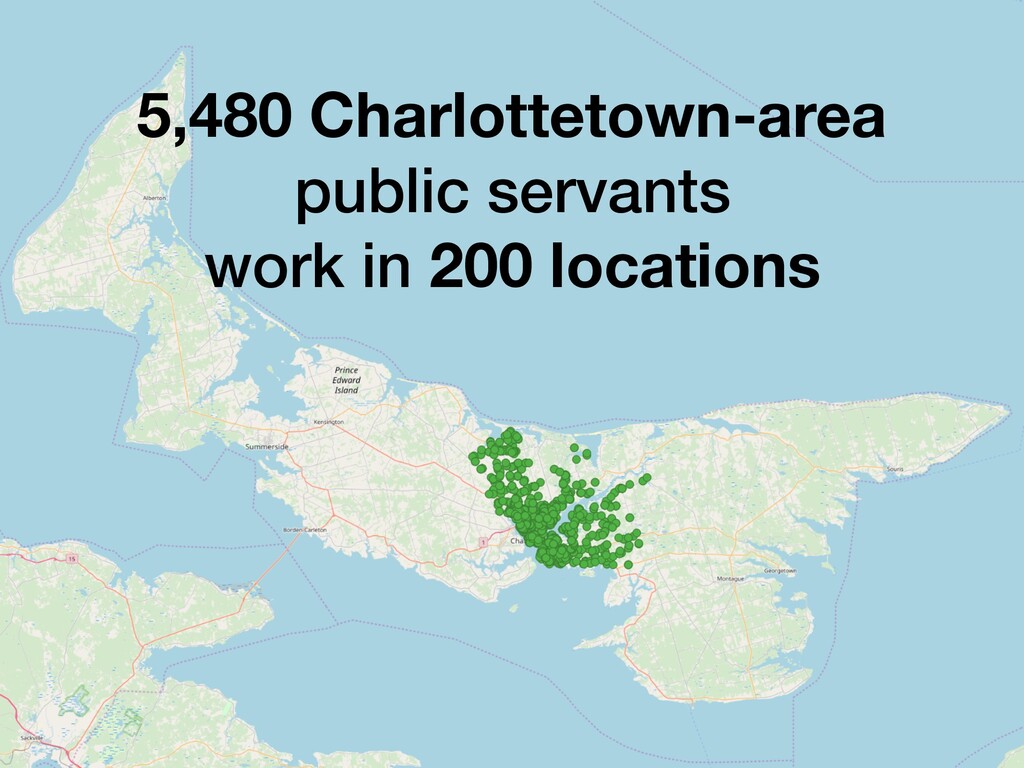
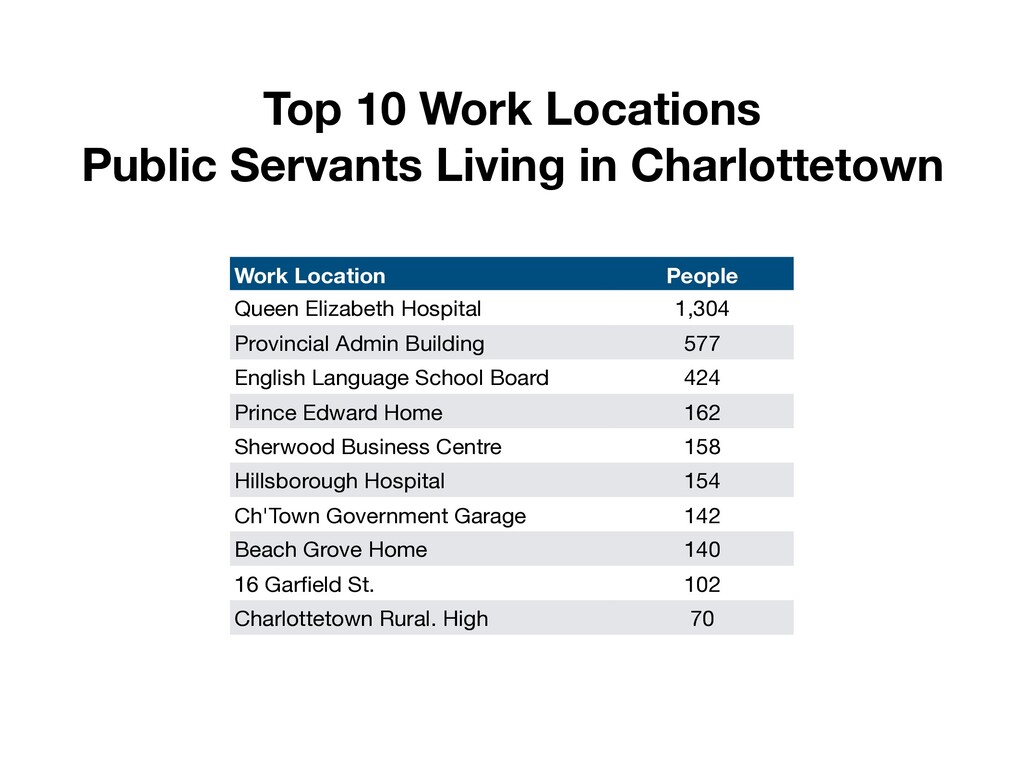
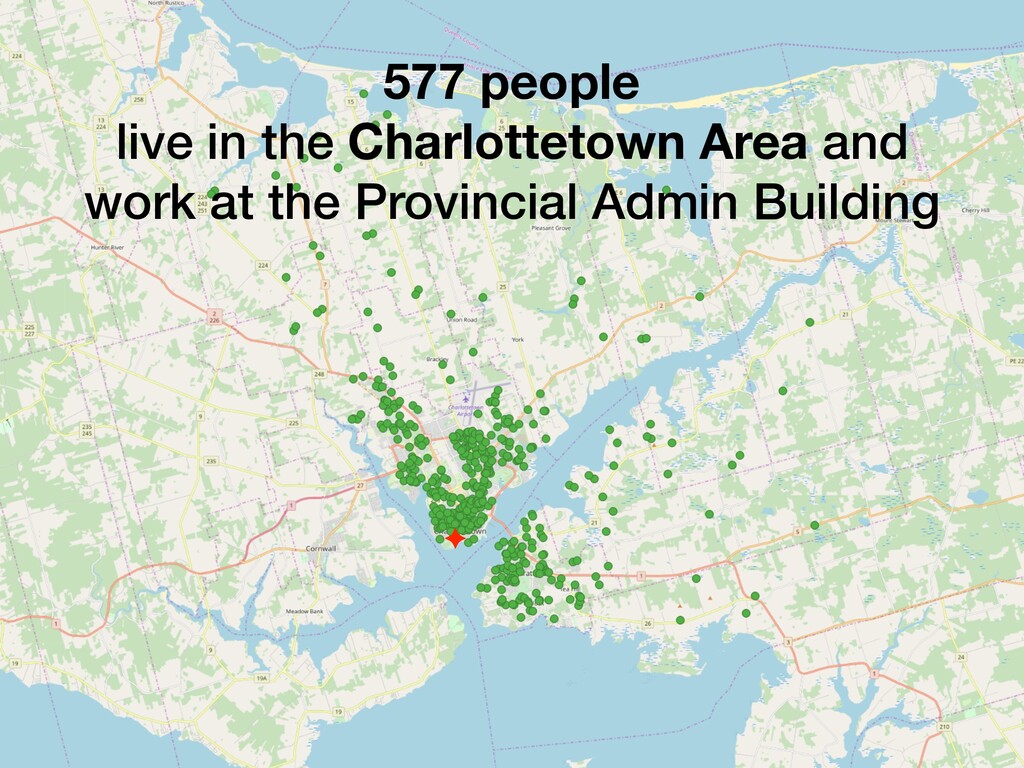
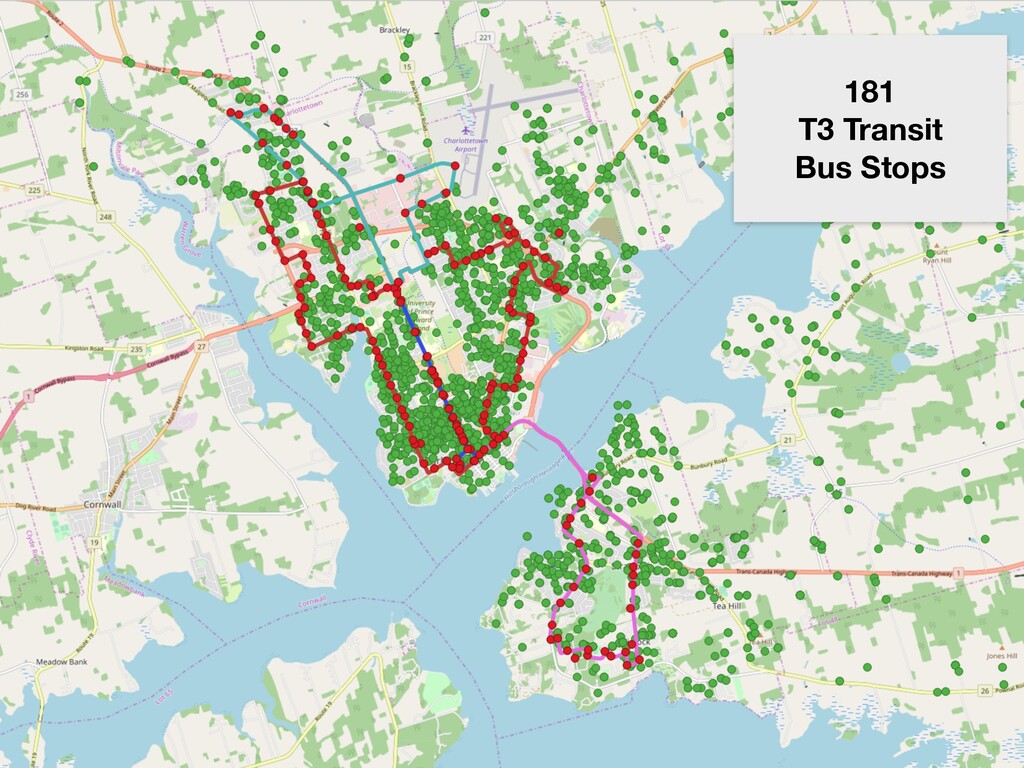
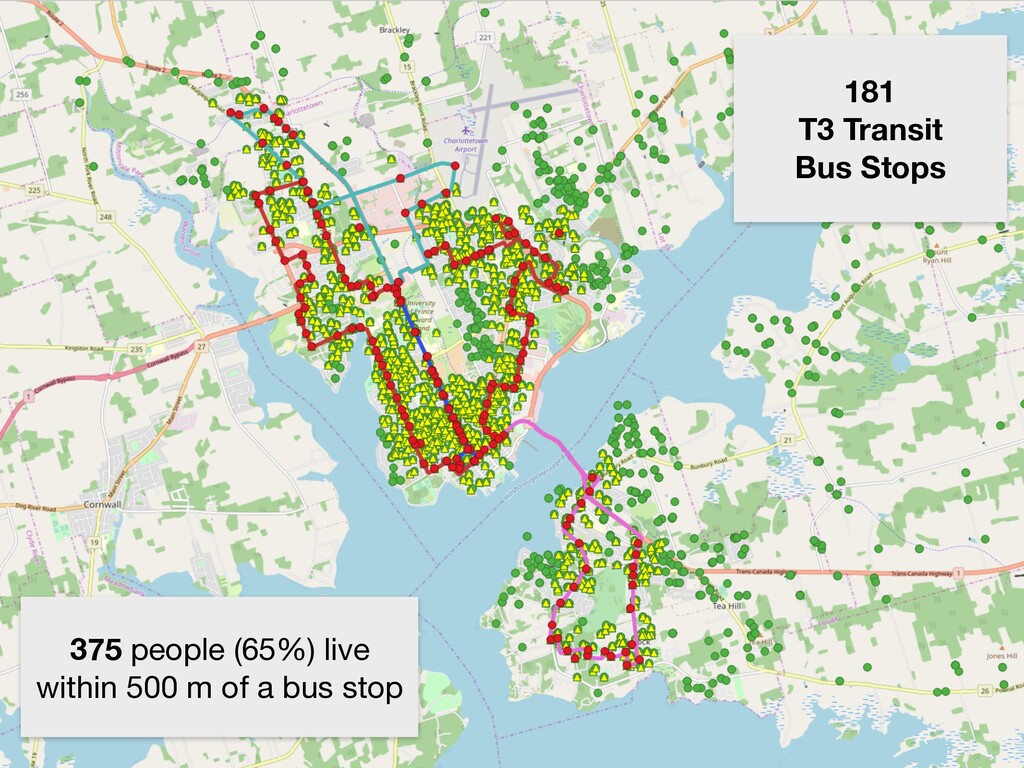
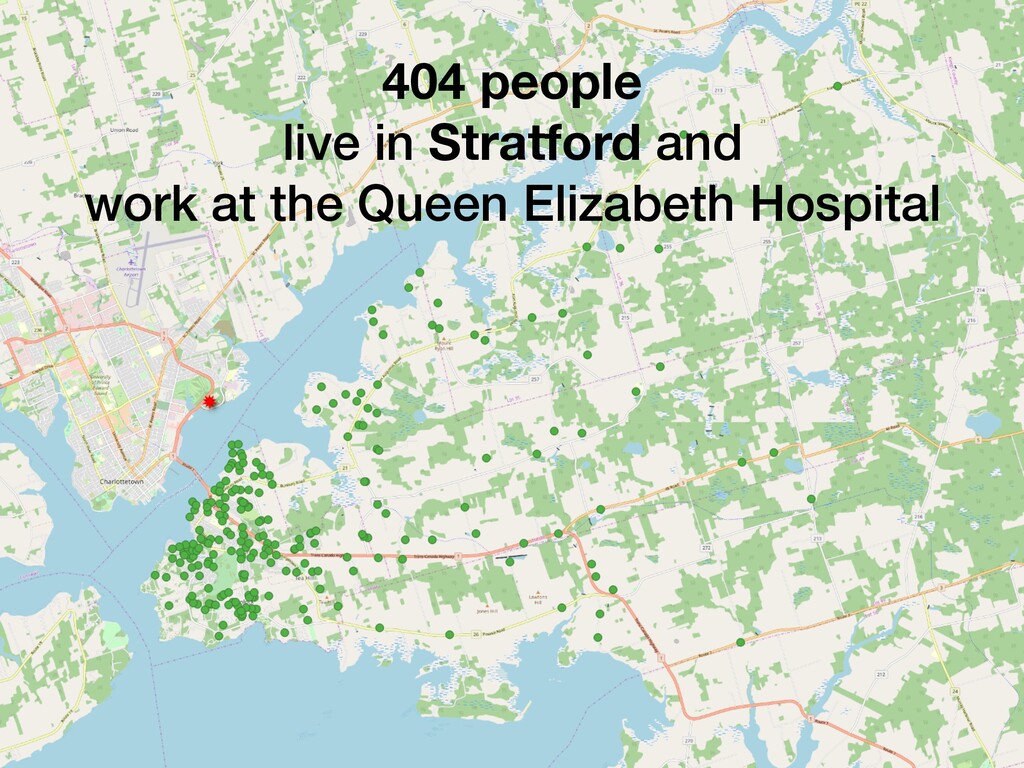
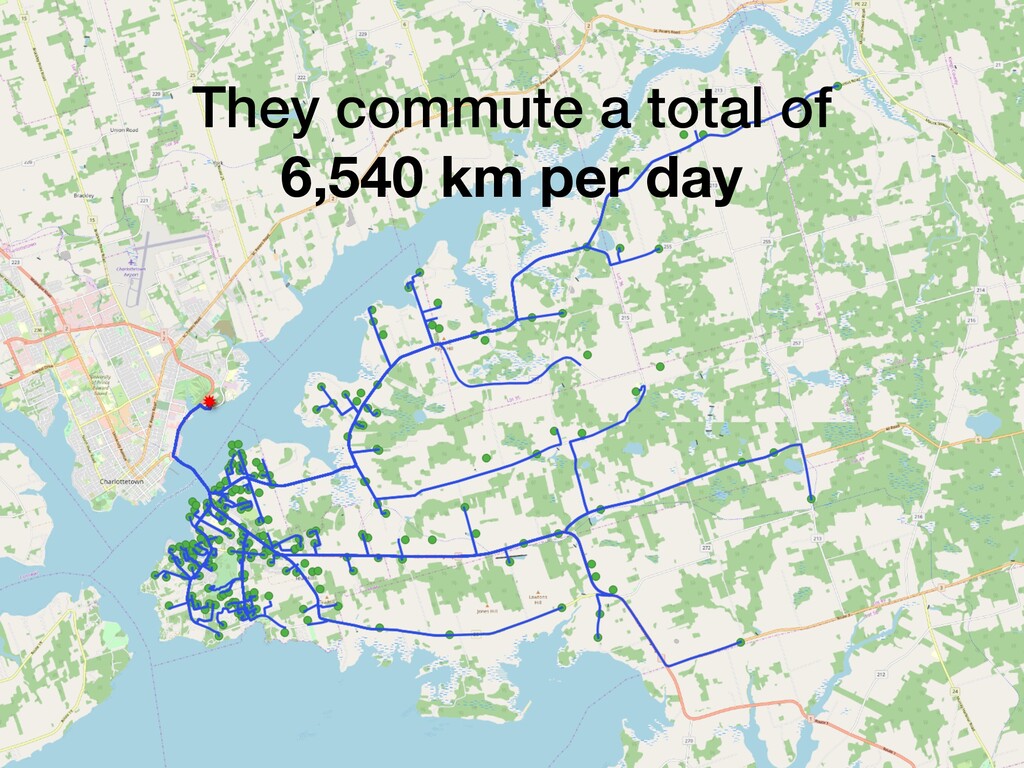
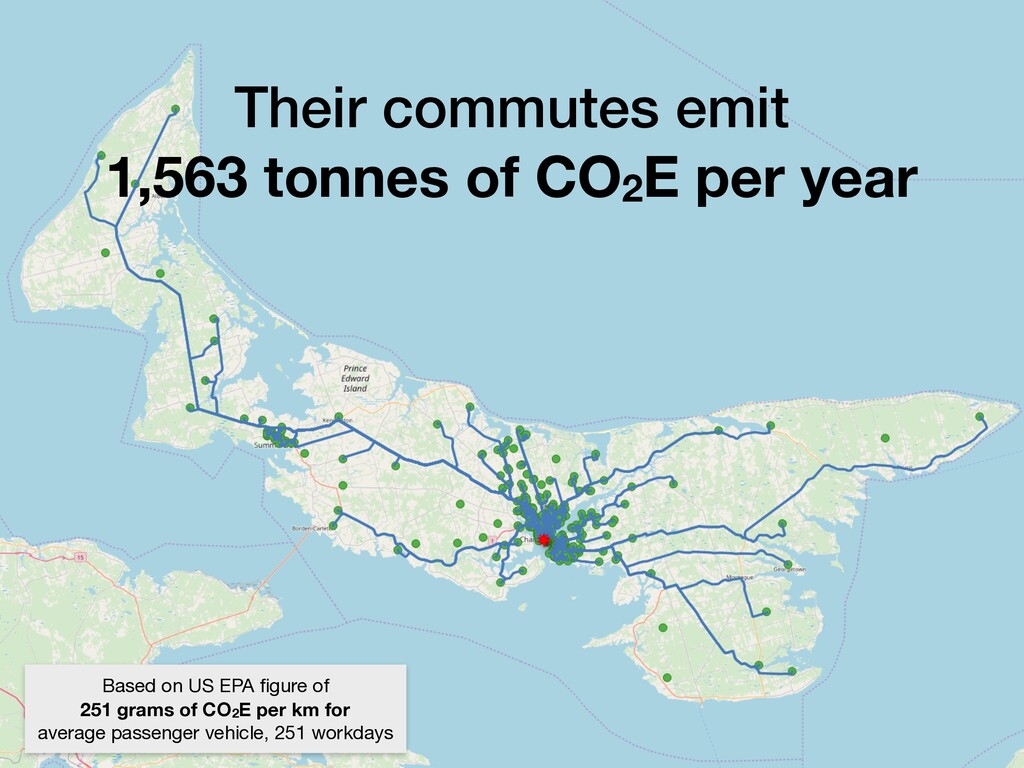
Garfield St.,1,46.0851,-62.8832
    C0A 1A0,185 Beach Grove Road,1,46.0851,-62.8832
    C0A 1A0,40 Enman Crescent,1,46.0851,-62.8832
    C0A 1A0,40A Burns Ave.,1,46.0851,-62.8832
    C0A 1A0,Beach Grove Home,1,46.0851,-62.8832
    C0A 1A0,Belfast Consolidated,5,46.0851,-62.8832
    C0A 1A0,Borden Scale House,1,46.0851,-62.8832
    C0A 1A0,Brudenell Admin Office,1,46.0851,-62.8832
    C0A 1A0,Brudenell Golf,1,46.0851,-62.8832
    C0A 1A0,Ch'Town Government Garage,3,46.0851,-62.8832
    C0A 1A0,Coles Building,1,46.0851,-62.8832
    C0A 1A0,Douses Road,1,46.0851,-62.8832
    C0A 1A0,Elm Street School,1,46.0851,-62.8832
    C0A 1A0,English Language School Board,5,46.0851,-62.8832
    C0A 1A0,Frank Gaudet Nursery,1,46.0851,-62.8832
    C0A 1A0,Georgetown Government Garage,1,46.0851,-62.8832
    C0A 1A0,Glen Stewart Elementary,1,46.0851,-62.8832
    C0A 1A0,Hillsborough Hospital,4,46.0851,-62.8832
    C0A 1A0,J. Angus MacLean Bldg,1,46.0851,-62.8832

    View Slide

  27. QGIS: Open Source Mapping

    View Slide

  28. The homes of
    13,211 public servants
    (who work in 301 different places)

    View Slide

  29. Work Location People
    Queen Elizabeth Hospital 1,740
    Provincial Admin Building 876
    English Language School Board 822
    Prince County Hospital 688
    Ch'Town Government Garage 289
    Prince Edward Home 252
    Beach Grove Home 246
    Hillsborough Hospital 233
    Sherwood Business Centre 215
    Wedgewood Manor 207
    Top 10 Work Locations
    for PEI Public Servants

    View Slide

  30. 1,740 people work at
    Queen Elizabeth Hospital

    View Slide

  31. 876 people work at
    Provincial Admin Building

    View Slide

  32. 46 people work at
    Prince Street Elementary

    View Slide

  33. 9 people work at
    the Borden Scale House

    View Slide

  34. 5,480 Charlottetown-area
    public servants
    work in 200 locations

    View Slide

  35. Work Location People
    Queen Elizabeth Hospital 1,304
    Provincial Admin Building 577
    English Language School Board 424
    Prince Edward Home 162
    Sherwood Business Centre 158
    Hillsborough Hospital 154
    Ch'Town Government Garage 142
    Beach Grove Home 140
    16 Garfield St. 102
    Charlottetown Rural. High 70
    Top 10 Work Locations
    Public Servants Living in Charlottetown

    View Slide

  36. 1,304 people
    live in the Charlottetown Area and
    work at the Queen Elizabeth Hospital

    View Slide

  37. 10 minutes
    20 minutes
    30 minutes
    Walking
    Time to Work
    Isochrones from

    ORS Tools Plug-in for QGIS,

    using Open Route Service
    87 people (7%)

    can walk to work

    in under 30 minutes

    View Slide

  38. 10 minutes
    20 minutes
    30 minutes
    Cycling
    Time to Work
    Isochrones from

    ORS Tools Plug-in for QGIS,

    using Open Route Service
    1,112 people (85%)

    can cycle to work

    in under 30 minutes

    View Slide

  39. 577 people
    live in the Charlottetown Area and
    work at the Provincial Admin Building

    View Slide

  40. 10 minutes
    20 minutes
    30 minutes
    Walking
    Time to Work
    Isochrones from

    ORS Tools Plug-in for QGIS,

    using Open Route Service
    128 people (22%)

    can walk to work

    in under 30 minutes

    View Slide

  41. 10 minutes
    20 minutes
    30 minutes
    Cycling
    Time to Work
    Isochrones from

    ORS Tools Plug-in for QGIS,

    using Open Route Service
    493 people (85%)

    can cycle to work

    in under 30 minutes

    View Slide

  42. T3 Transit
    Charlottetown
    and Stratford
    Routes 2 & 3
    Every Hour
    Clockwise & Counterclockwise
    Route 1
    Every 15 Minutes
    Up and down University Ave.
    Route 7
    Morning and
    Afternoon Runs
    every 30 Minutes
    Route 11
    Morning and
    Afternoon Runs
    every 30 Minutes

    View Slide

  43. 181
    T3 Transit
    Bus Stops

    View Slide

  44. 181
    T3 Transit
    Bus Stops
    375 people (65%) live

    within 500 m of a bus stop

    View Slide

  45. (Using Open Data and GIS
    to Inform Policy and
    Influence Behaviour)

    View Slide

  46. 404 people
    live in Stratford and
    work at the Queen Elizabeth Hospital

    View Slide

  47. They commute a total of
    6,540 km per day

    View Slide

  48. Their commutes emit
    412 tonnes of CO2E per year
    Based on US EPA figure of

    251 grams of CO2E per km for
    average passenger vehicle, 251 workdays

    View Slide

  49. 333 of them can cycle
    to work in less than 30 minutes
    Distances range from 3 km to 11 km.

    Cycle times from 13 to 30 minutes.

    View Slide

  50. Right now those 333 who could
    cycle drive 2,378 km every day

    View Slide

  51. Cycling instead of driving would
    save 149 tonnes of CO2E per year
    Based on US EPA figure of

    251 grams of CO2E per km for
    average passenger vehicle, 251 workdays

    View Slide

  52. 876 people
    work at the
    Provincial Admin Building

    View Slide

  53. They commute a total of
    24,825 km per day

    View Slide

  54. Based on US EPA figure of

    251 grams of CO2E per km for
    average passenger vehicle, 251 workdays
    Their commutes emit
    1,563 tonnes of CO2E per year

    View Slide

  55. At an average
    1.78 tonnes per year
    13,211 employees
    commuting emit
    23,515 tonnes
    of CO2E per year

    View Slide

  56. At an average
    1.78 tonnes per year
    13,211 employees
    commuting emit
    23,515 tonnes
    of CO2E per year
    45% of the 4 tonne per
    year reduction we each
    need to achieve to meet
    our 2030 climate targets.

    View Slide

  57. At an average
    1.78 tonnes per year
    13,211 employees
    commuting emit
    23,515 tonnes
    of CO2E per year
    4% of the
    600,000 tonne per year
    reduction the province
    needs to meet our 2030
    climate targets.

    View Slide

  58. View Slide

  59. View Slide

  60. Detail from 2010 high resolution orthophoto of Charlottetown downtown area, Dept. of Environment, Water and Climate Change, Forests, Fish & Wildlife Division

    View Slide

  61. Detail from 1968 high resolution orthophoto of Charlottetown downtown area, Dept. of Environment, Water and Climate Change, Forests, Fish & Wildlife Division

    View Slide

  62. Slides are online at
    https://ruk.ca/engineers
    These slides are released under a Creative Commons license.
    You are encouraged to distribute them as far and as 

    wide as possible under the terms of the license.

    View Slide