Retensa 10 Year Trends - Employee Turnover Restaurant Industry Report 2016-2026.
Explore Retensa’s 10-year analysis of employee turnover trends in the restaurant industry from 2016–2026. Discover key workforce trends, turnover patterns, and insights to help restaurant businesses improve employee retention and reduce turnover.
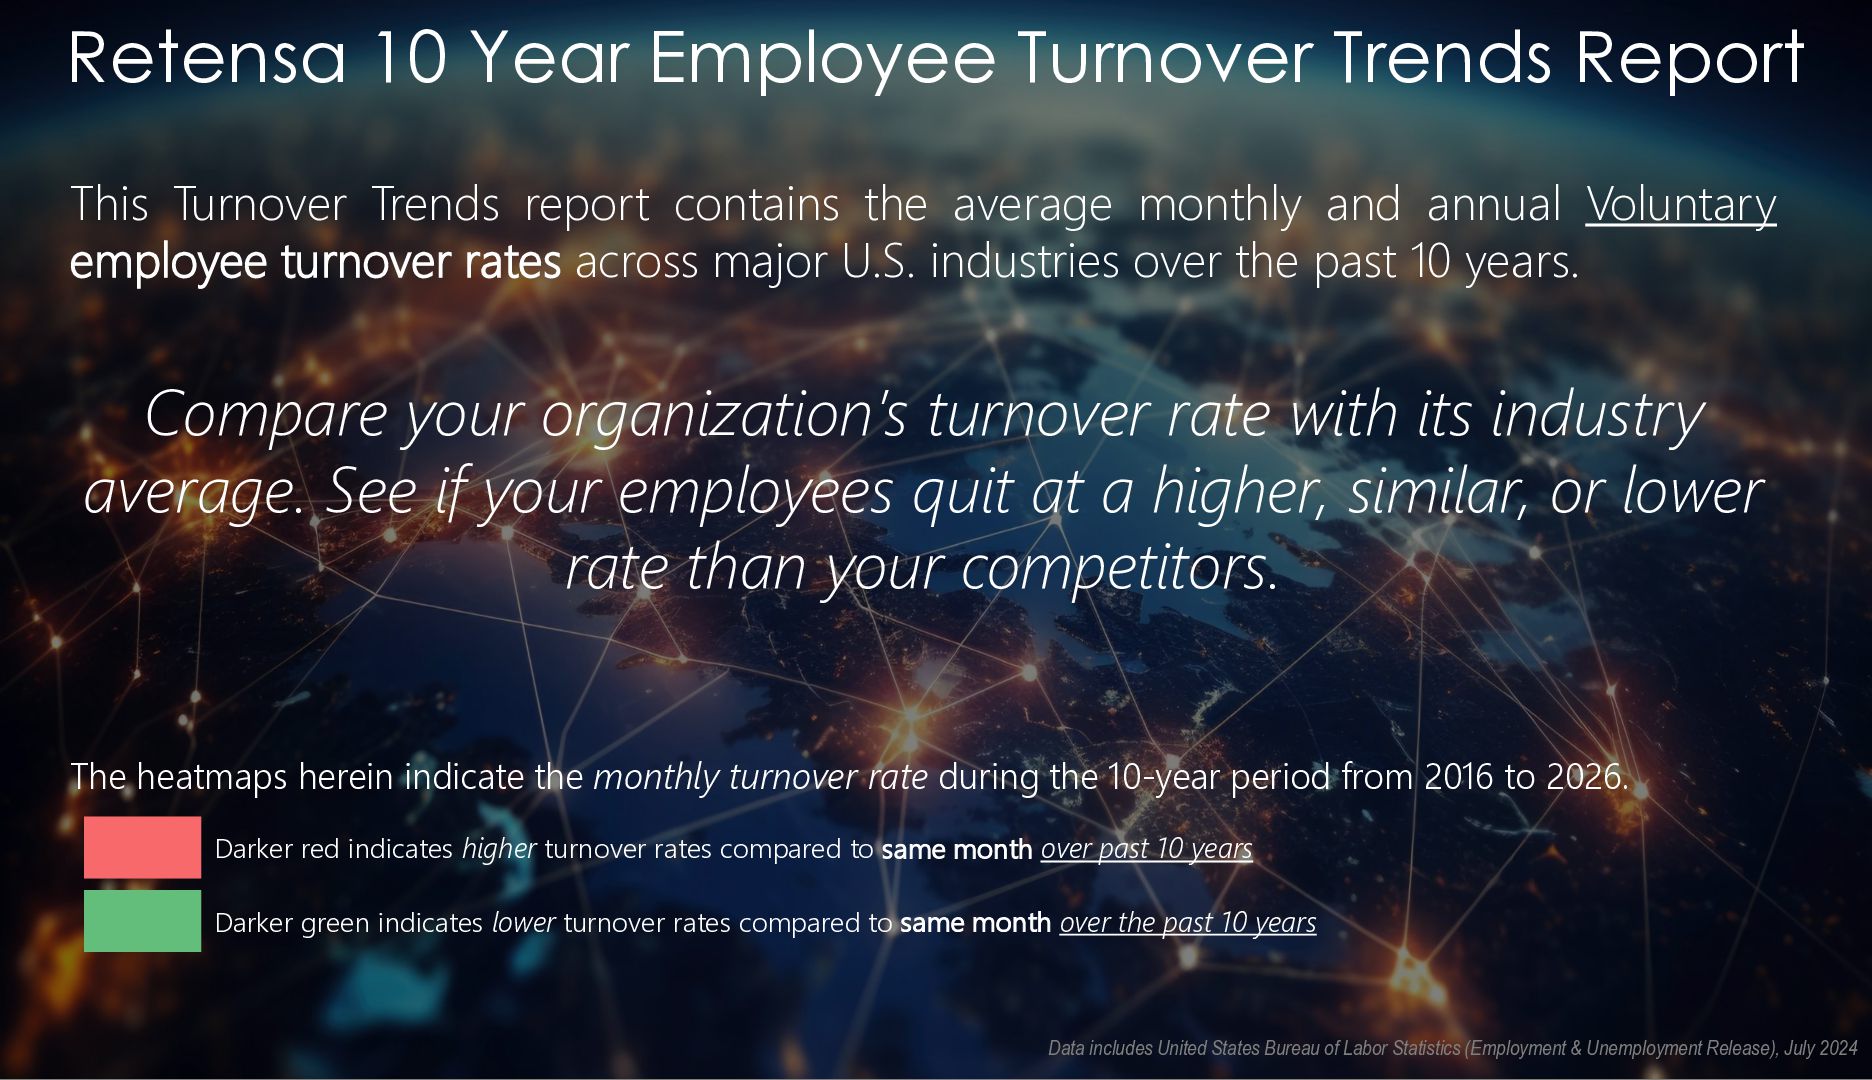
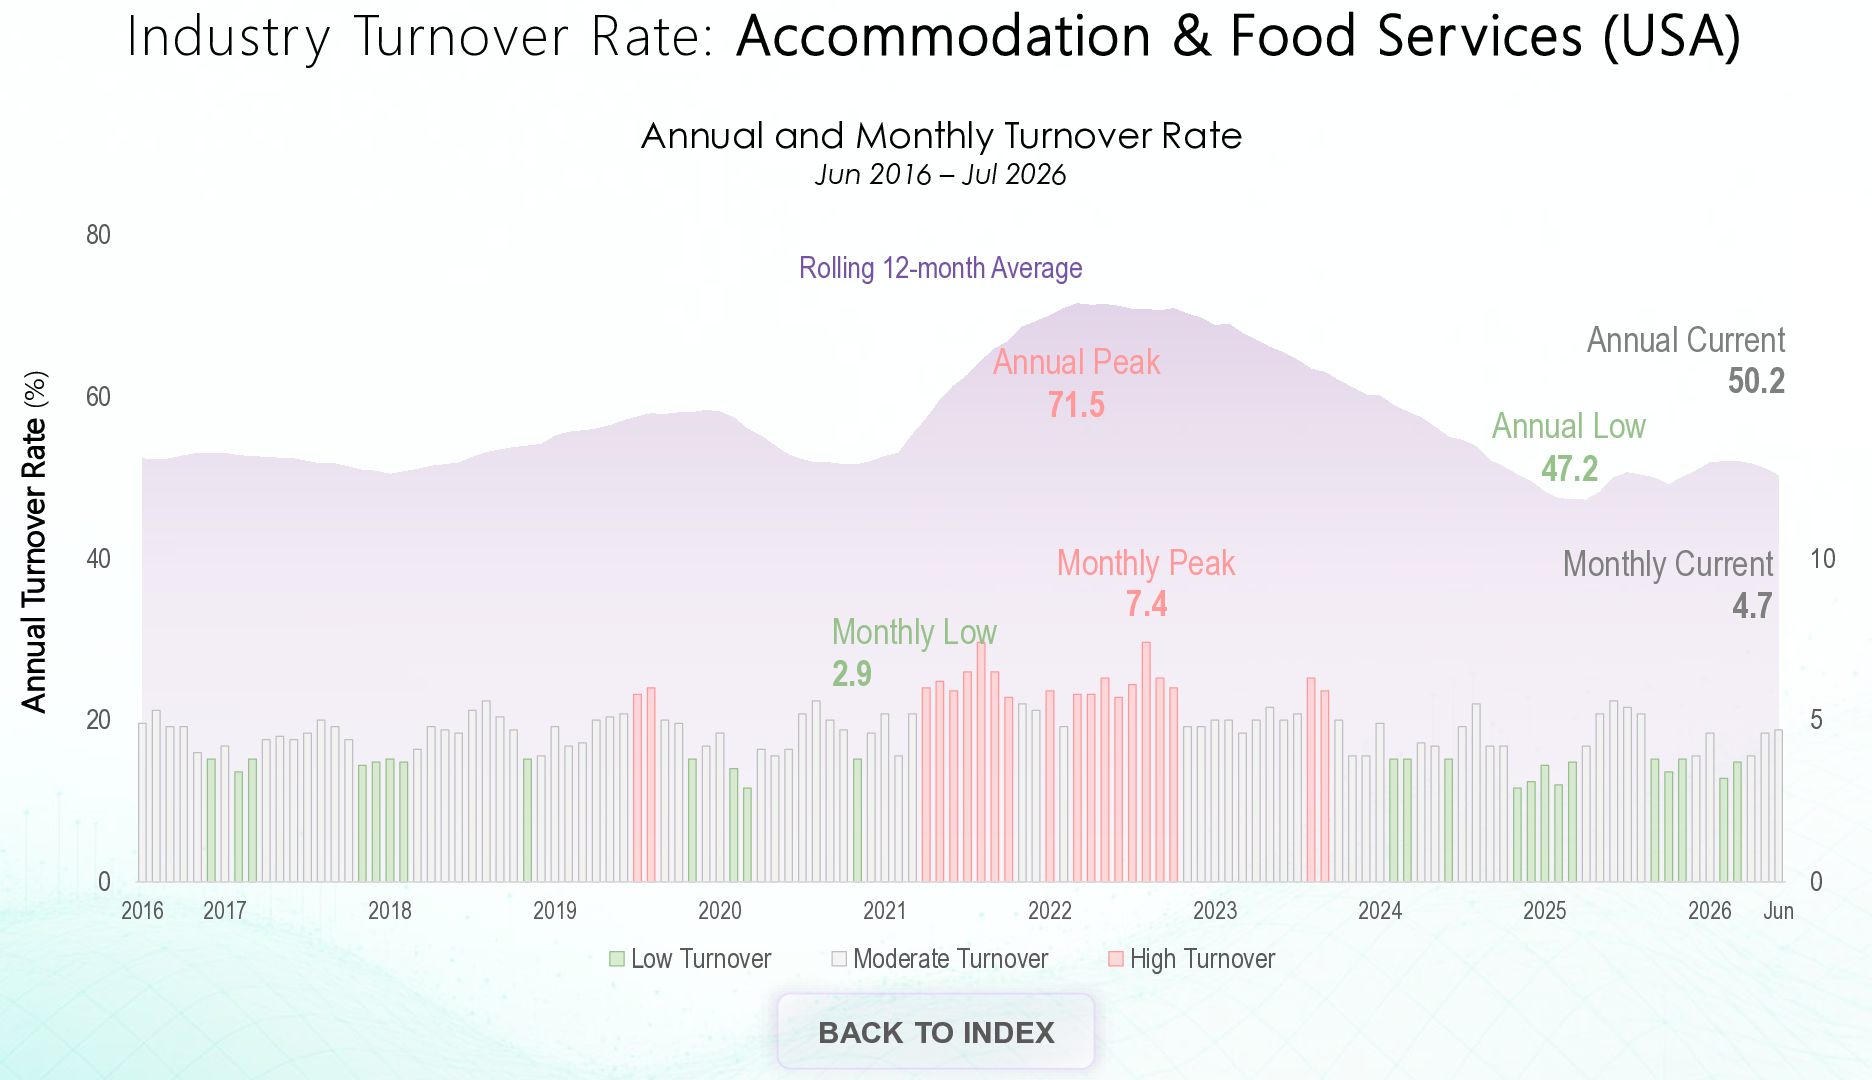
report contains the average monthly and annual Voluntary employee turnover rates across major U.S. industries over the past 10 years. Compare your organization’s turnover rate with its industry average. See if your employees quit at a higher, similar, or lower rate than your competitors. The heatmaps herein indicate the monthly turnover rate during the 10-year period from 2016 to 2026. Darker red indicates higher turnover rates compared to same month over past 10 years Darker green indicates lower turnover rates compared to same month over the past 10 years Data includes United States Bureau of Labor Statistics (Employment & Unemployment Release), July 2024
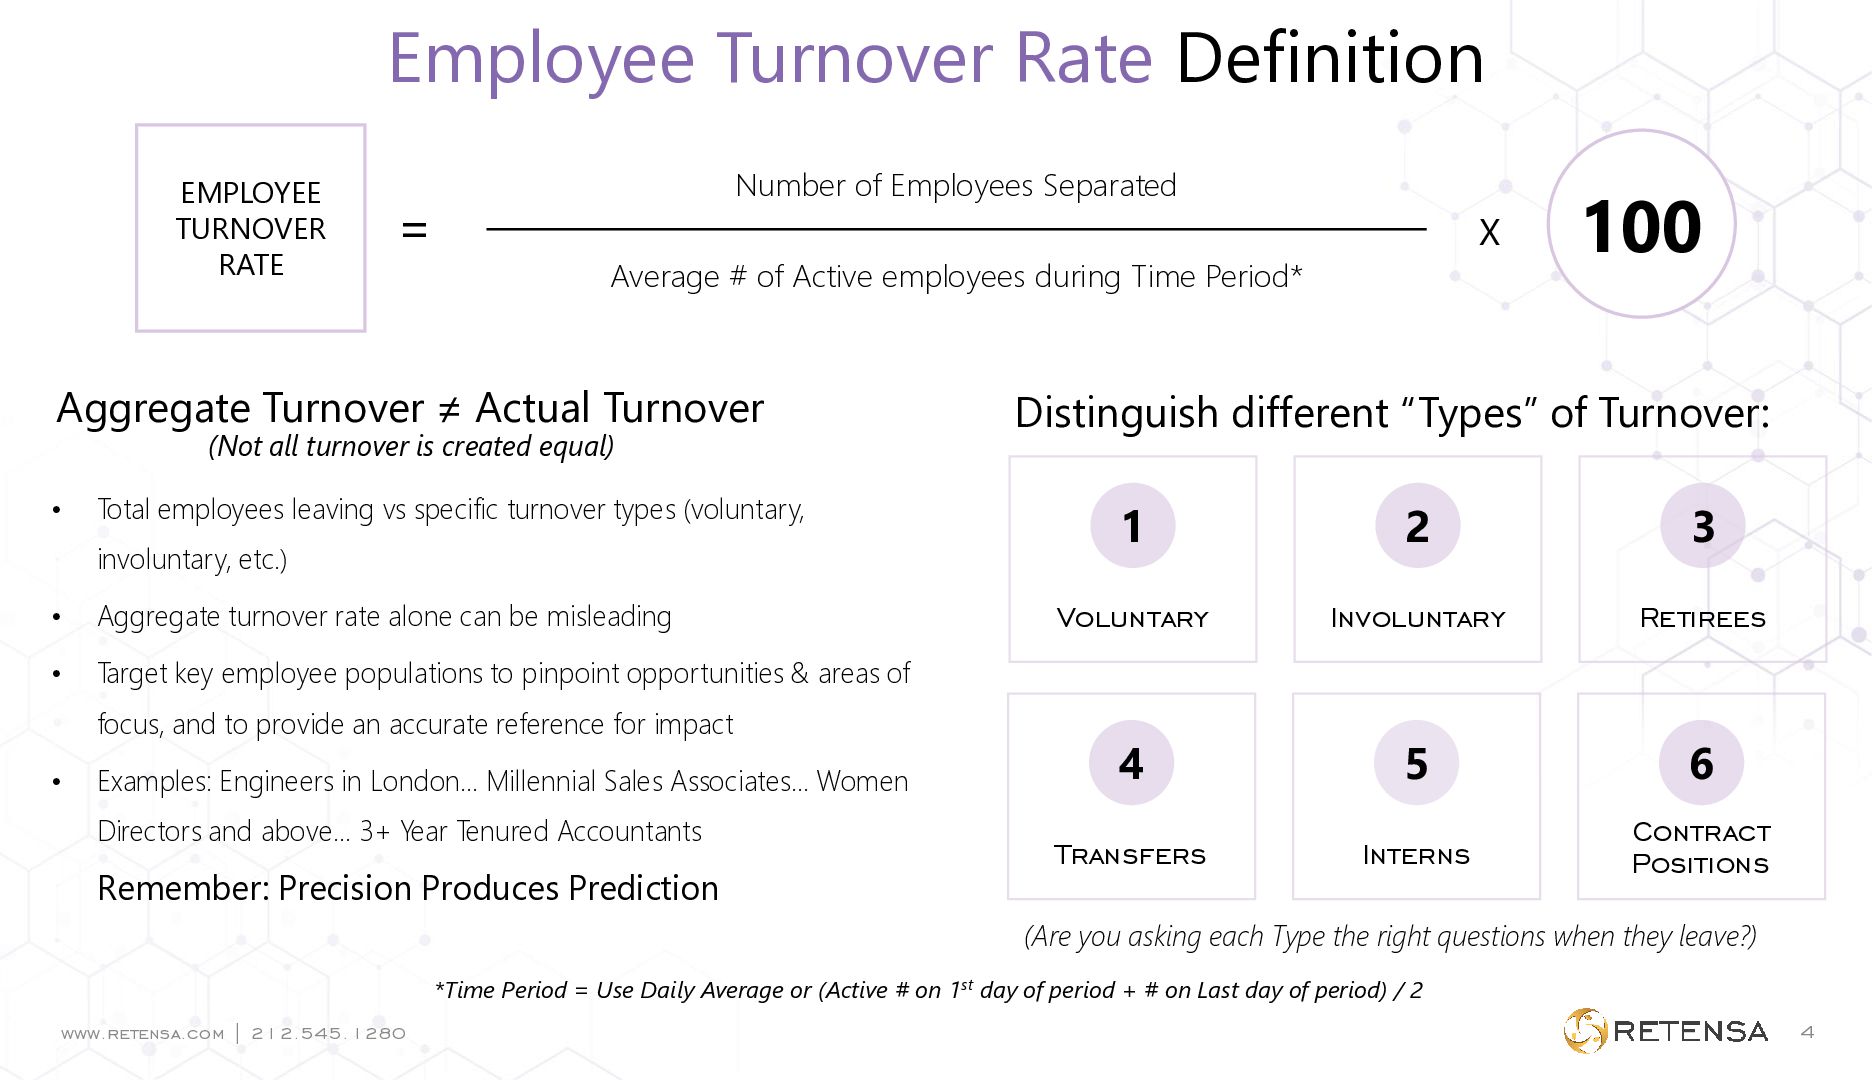
Employees Separated Average # of Active employees during Time Period* Aggregate Turnover ≠ Actual Turnover (Not all turnover is created equal) • Total employees leaving vs specific turnover types (voluntary, involuntary, etc.) • Aggregate turnover rate alone can be misleading • Target key employee populations to pinpoint opportunities & areas of focus, and to provide an accurate reference for impact • X Examples: Engineers in London… Millennial Sales Associates… Women Directors and above… 3+ Year Tenured Accountants Remember: Precision Produces Prediction 100 Distinguish different “Types” of Turnover: 1 2 3 Voluntary Involuntary Retirees 4 5 6 Transfers Interns Contract Positions (Are you asking each Type the right questions when they leave?) *Time Period = Use Daily Average or (Active # on 1st day of period + # on Last day of period) / 2 www.retensa.com | 212.545.1280 www.retensa.com | 212.545.1280 4
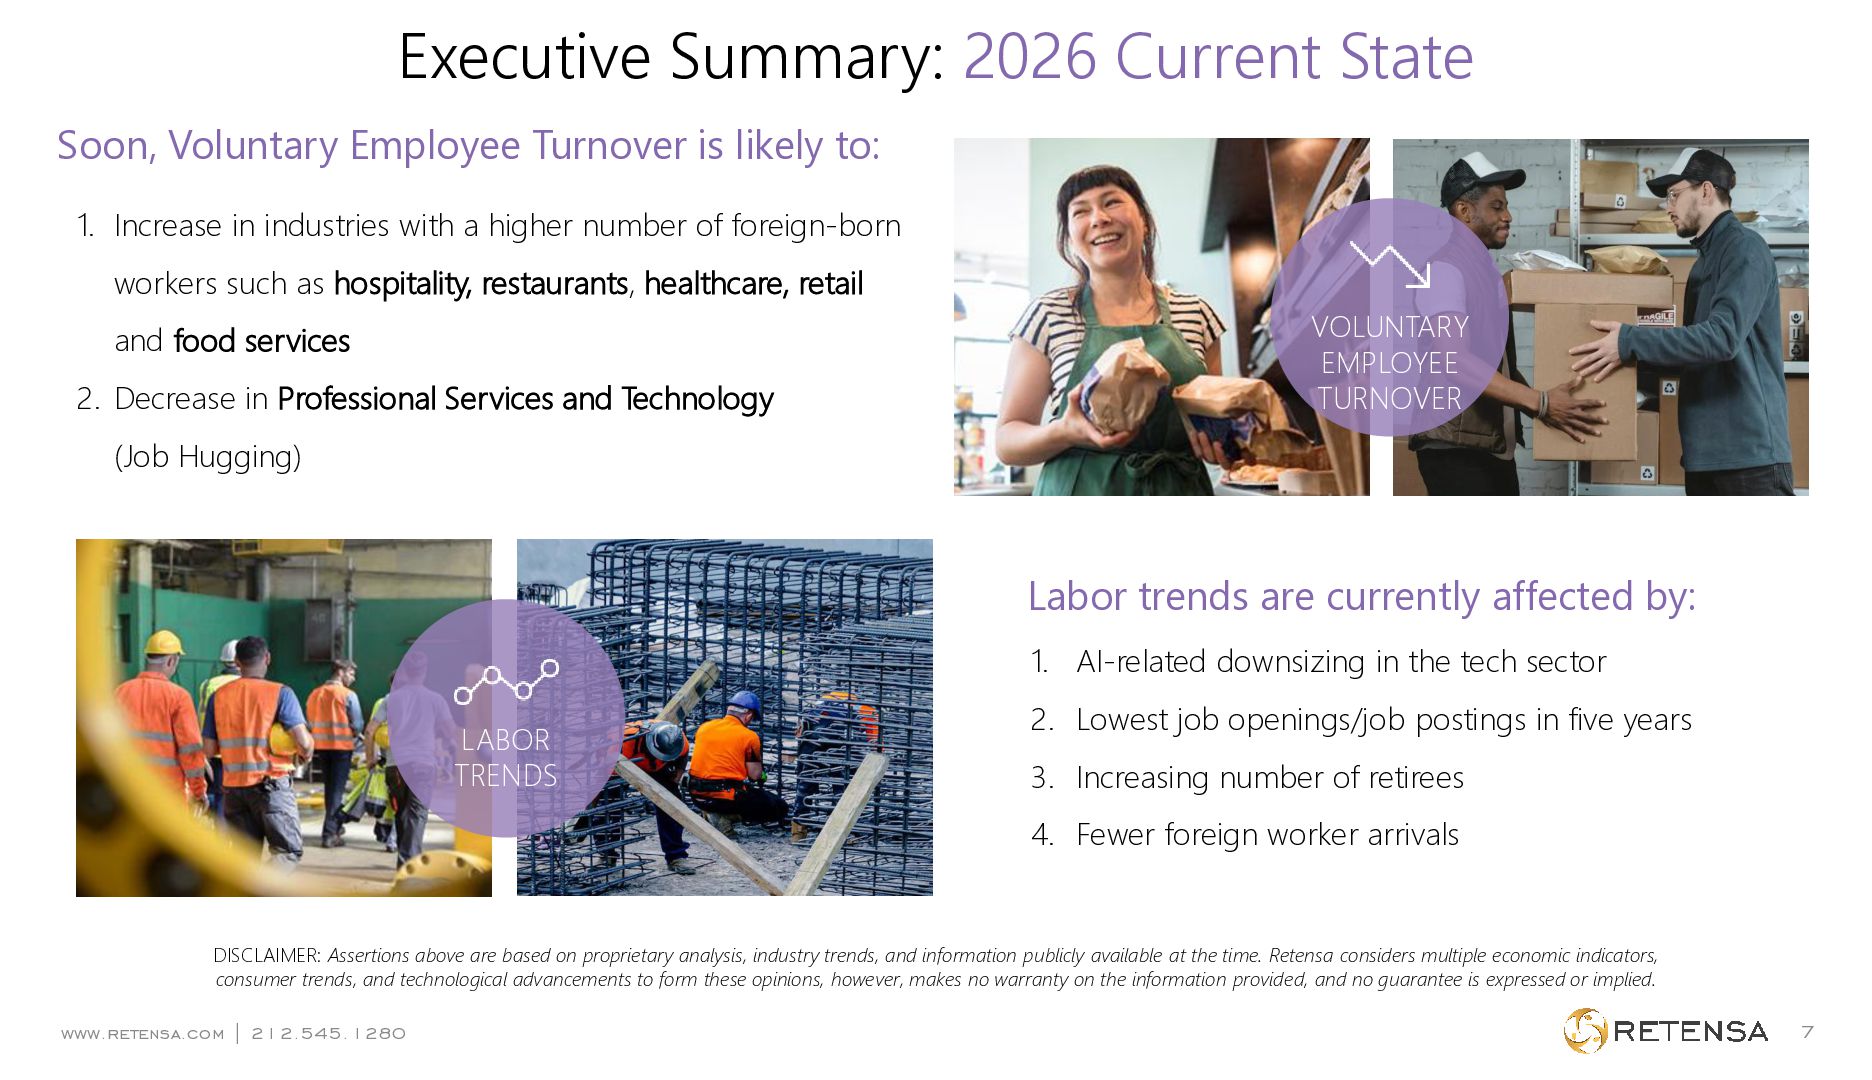
likely to: 1. Increase in industries with a higher number of foreign-born workers such as hospitality, restaurants, healthcare, retail and food services 2. Decrease in Professional Services and Technology VOLUNTARY EMPLOYEE TURNOVER (Job Hugging) Labor trends are currently affected by: 1. AI-related downsizing in the tech sector LABOR TRENDS 2. Lowest job openings/job postings in five years 3. Increasing number of retirees 4. Fewer foreign worker arrivals DISCLAIMER: Assertions above are based on proprietary analysis, industry trends, and information publicly available at the time. Retensa considers multiple economic indicators, consumer trends, and technological advancements to form these opinions, however, makes no warranty on the information provided, and no guarantee is expressed or implied. www.retensa.com | 212.545.1280 www.retensa.com | 212.545.1280 7
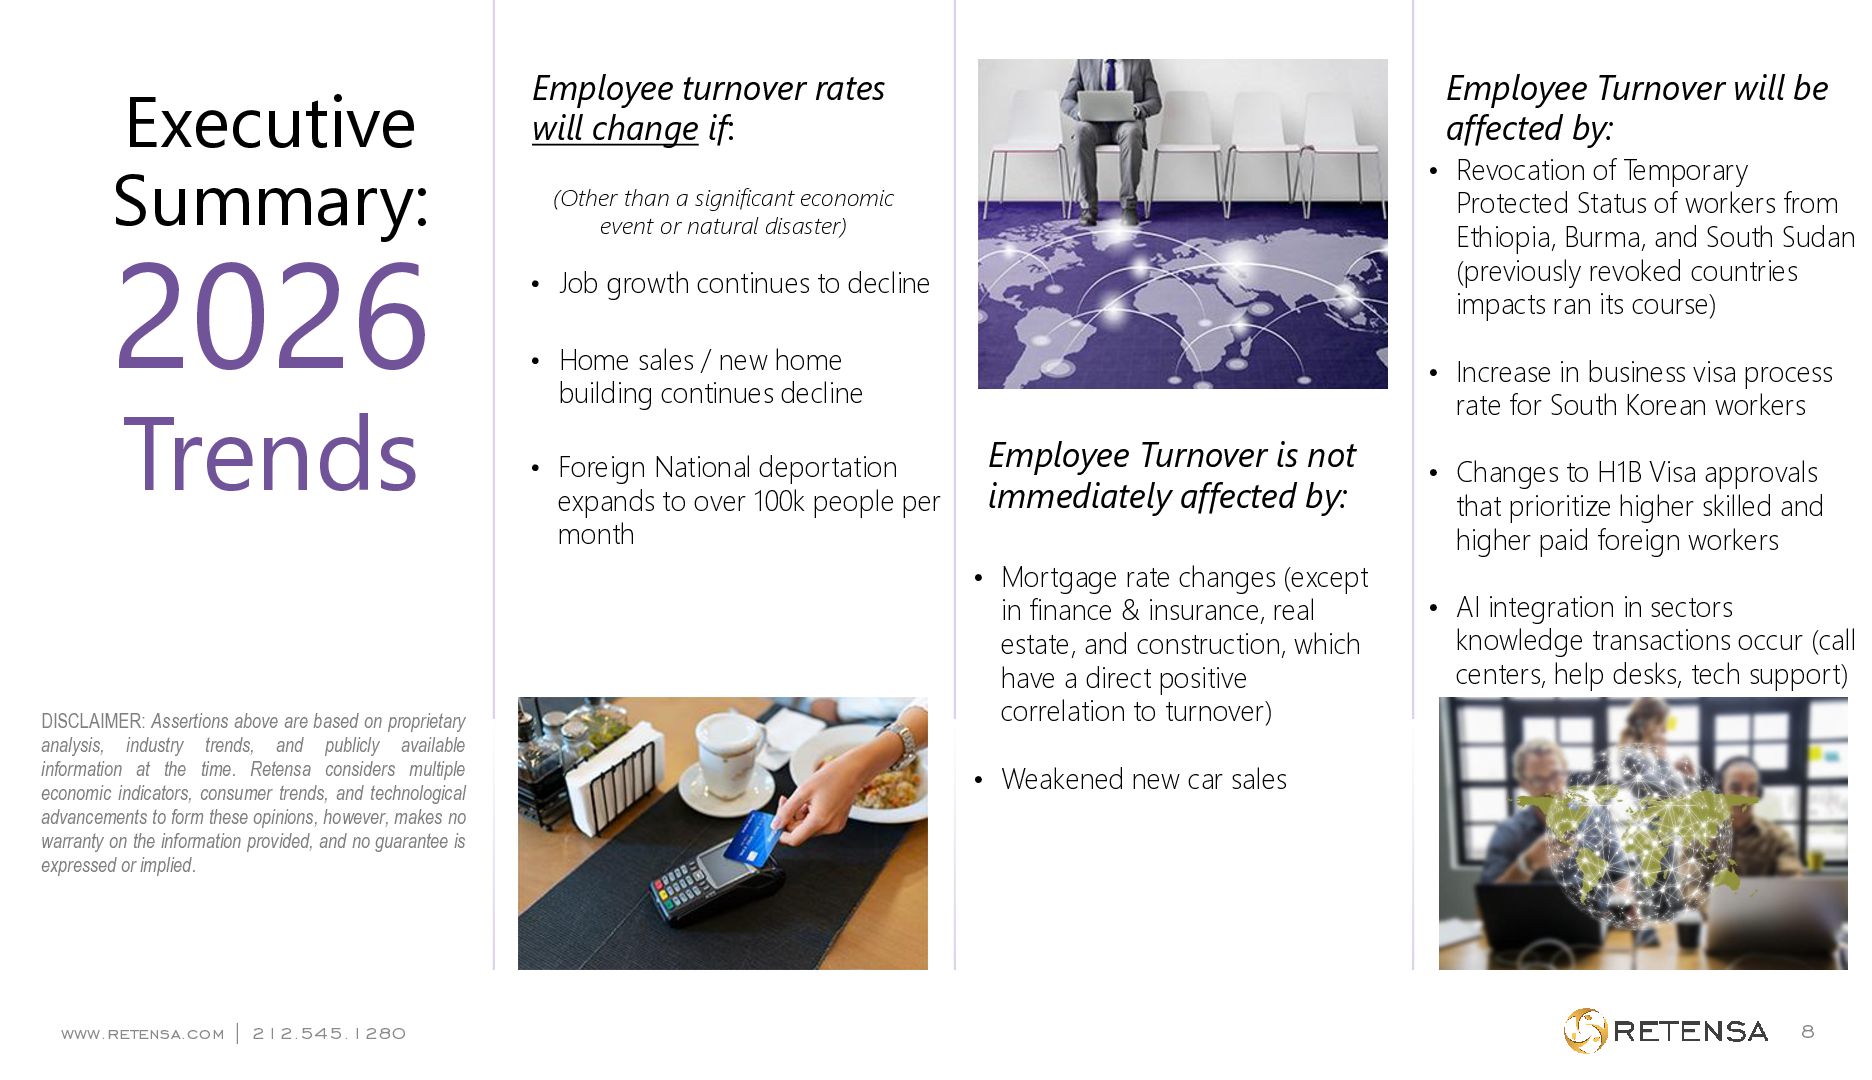
proprietary analysis, industry trends, and publicly available information at the time. Retensa considers multiple economic indicators, consumer trends, and technological advancements to form these opinions, however, makes no warranty on the information provided, and no guarantee is expressed or implied. Employee turnover rates will change if: Employee Turnover will be affected by: • Revocation of Temporary Protected Status of workers from Ethiopia, Burma, and South Sudan (previously revoked countries impacts ran its course) (Other than a significant economic event or natural disaster) • Job growth continues to decline • Home sales / new home building continues decline • Foreign National deportation expands to over 100k people per month • Increase in business visa process rate for South Korean workers Employee Turnover is not immediately affected by: • Mortgage rate changes (except in finance & insurance, real estate, and construction, which have a direct positive correlation to turnover) • Changes to H1B Visa approvals that prioritize higher skilled and higher paid foreign workers • AI integration in sectors knowledge transactions occur (call centers, help desks, tech support) • Weakened new car sales www.retensa.com | 212.545.1280 www.retensa.com | 212.545.1280 8
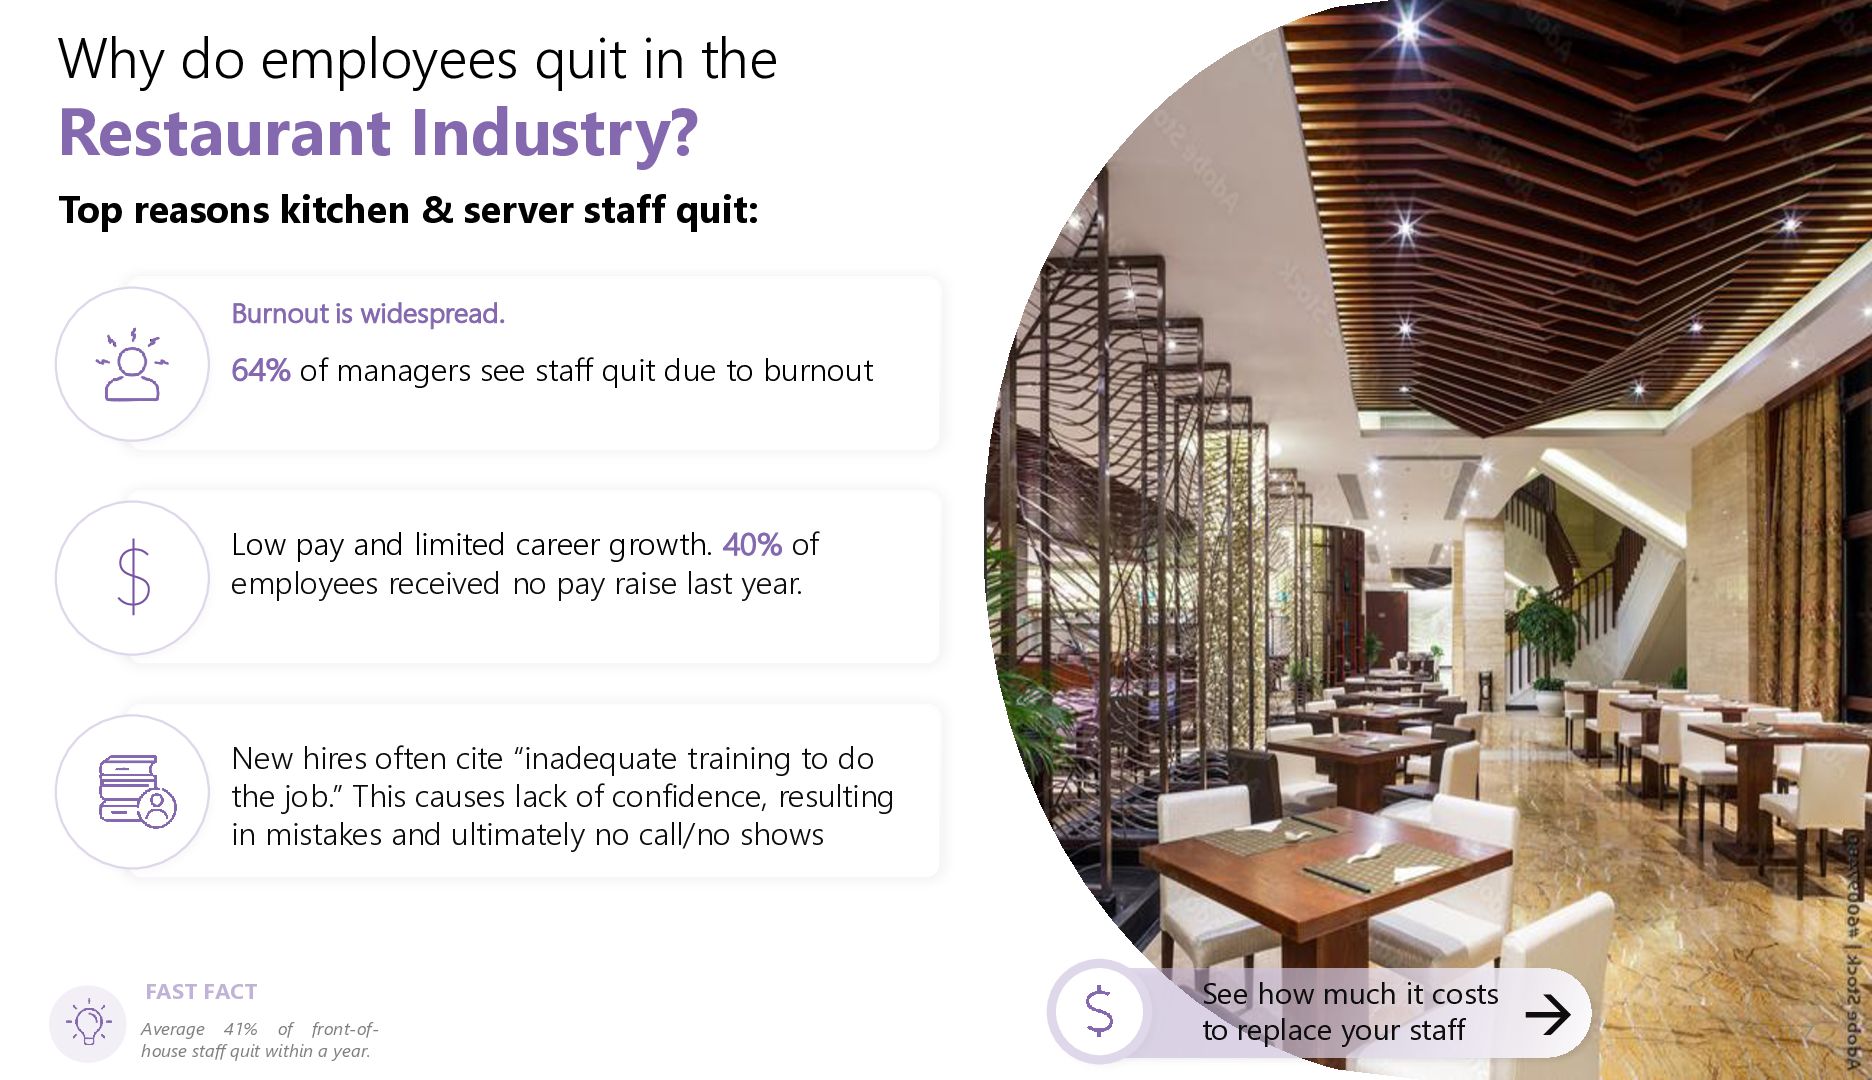
kitchen & server staff quit: Burnout is widespread. 64% of managers see staff quit due to burnout Low pay and limited career growth. 40% of employees received no pay raise last year. New hires often cite “inadequate training to do the job.” This causes lack of confidence, resulting in mistakes and ultimately no call/no shows www.retensa.com | 212.545.1280 FAST FACT Average 41% of front-ofwww.retensa.com | 212.545.1280 house staff quit within a year. See how much it costs to replace your staff → 17
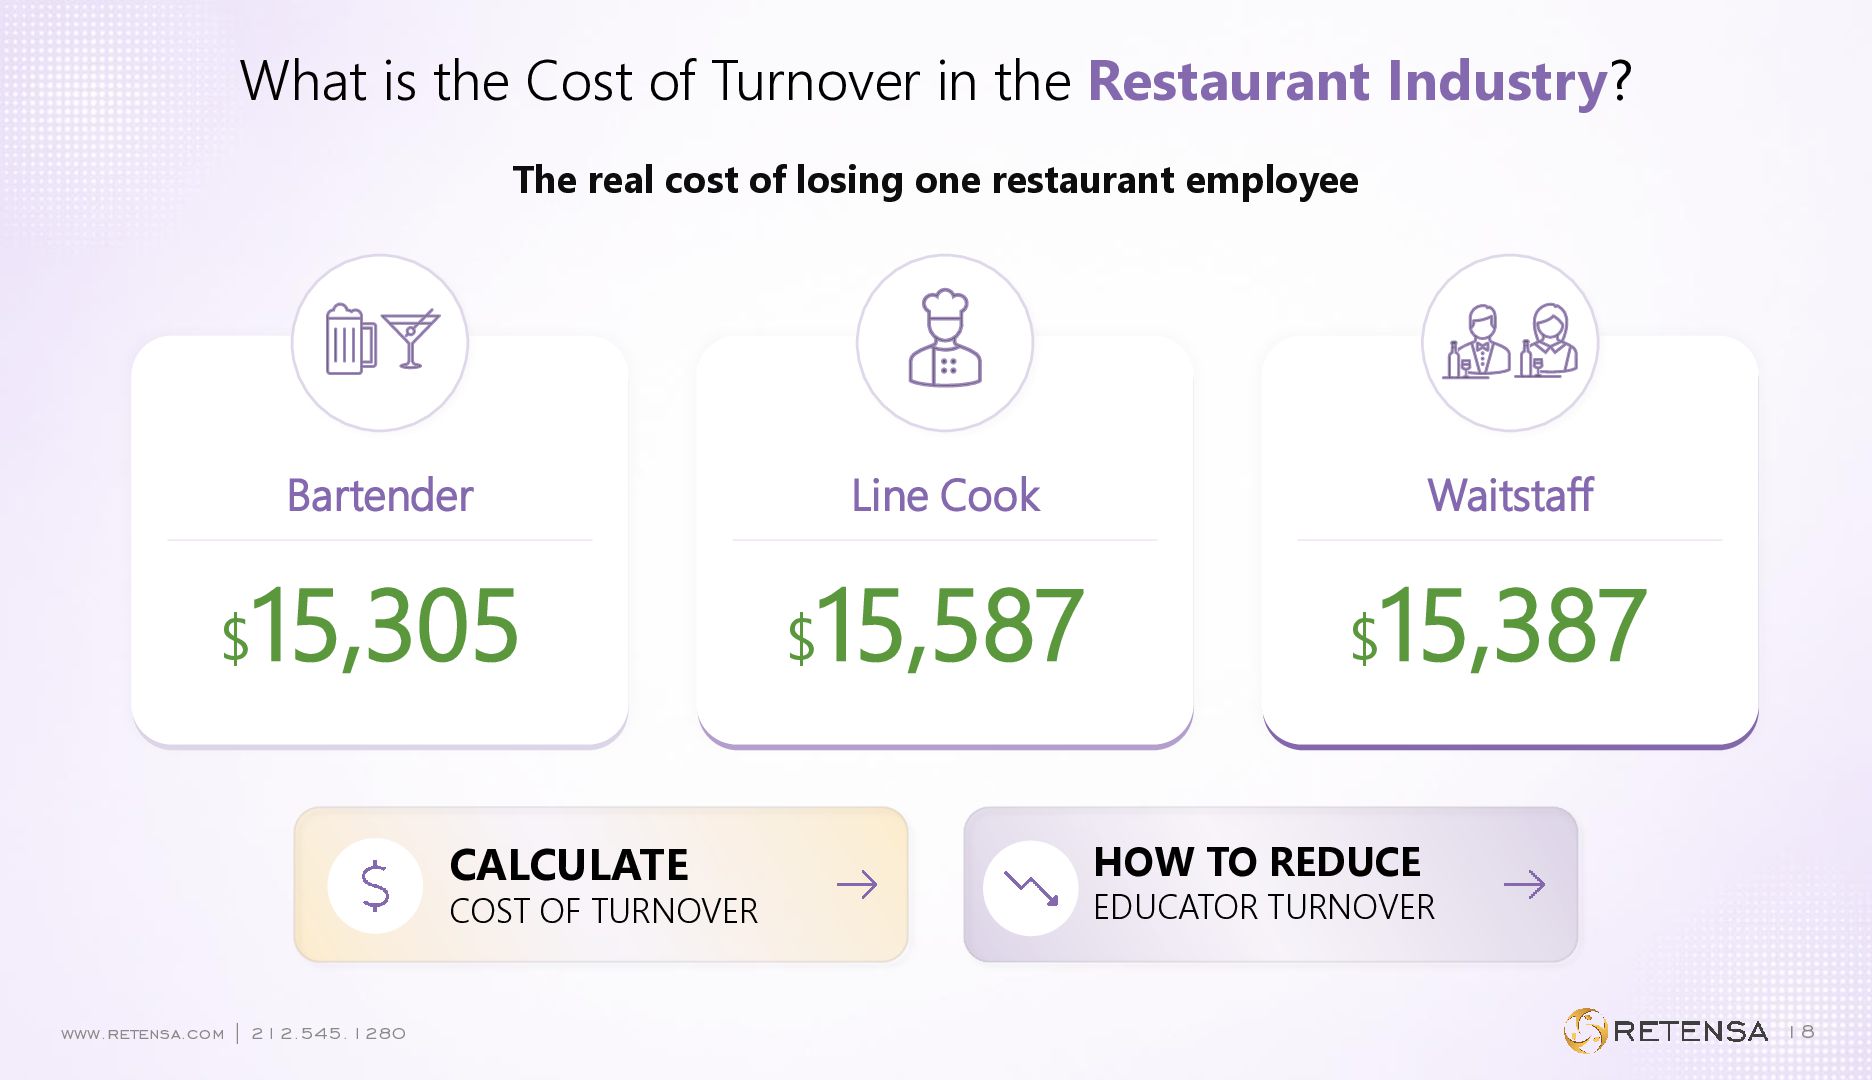
The real cost of losing one restaurant employee Bartender $ 15,305 CALCULATE COST OF TURNOVER CALCULATE COST OF TURNOVER Line Cook $ Waitstaff 15,587 $ 15,387 HOW TO REDUCE EDUCATOR TURNOVER HOW TO REDUCE EDUCATOR TURNOVER www.retensa.com | 212.545.1280 www.retensa.com | 212.545.1280 18
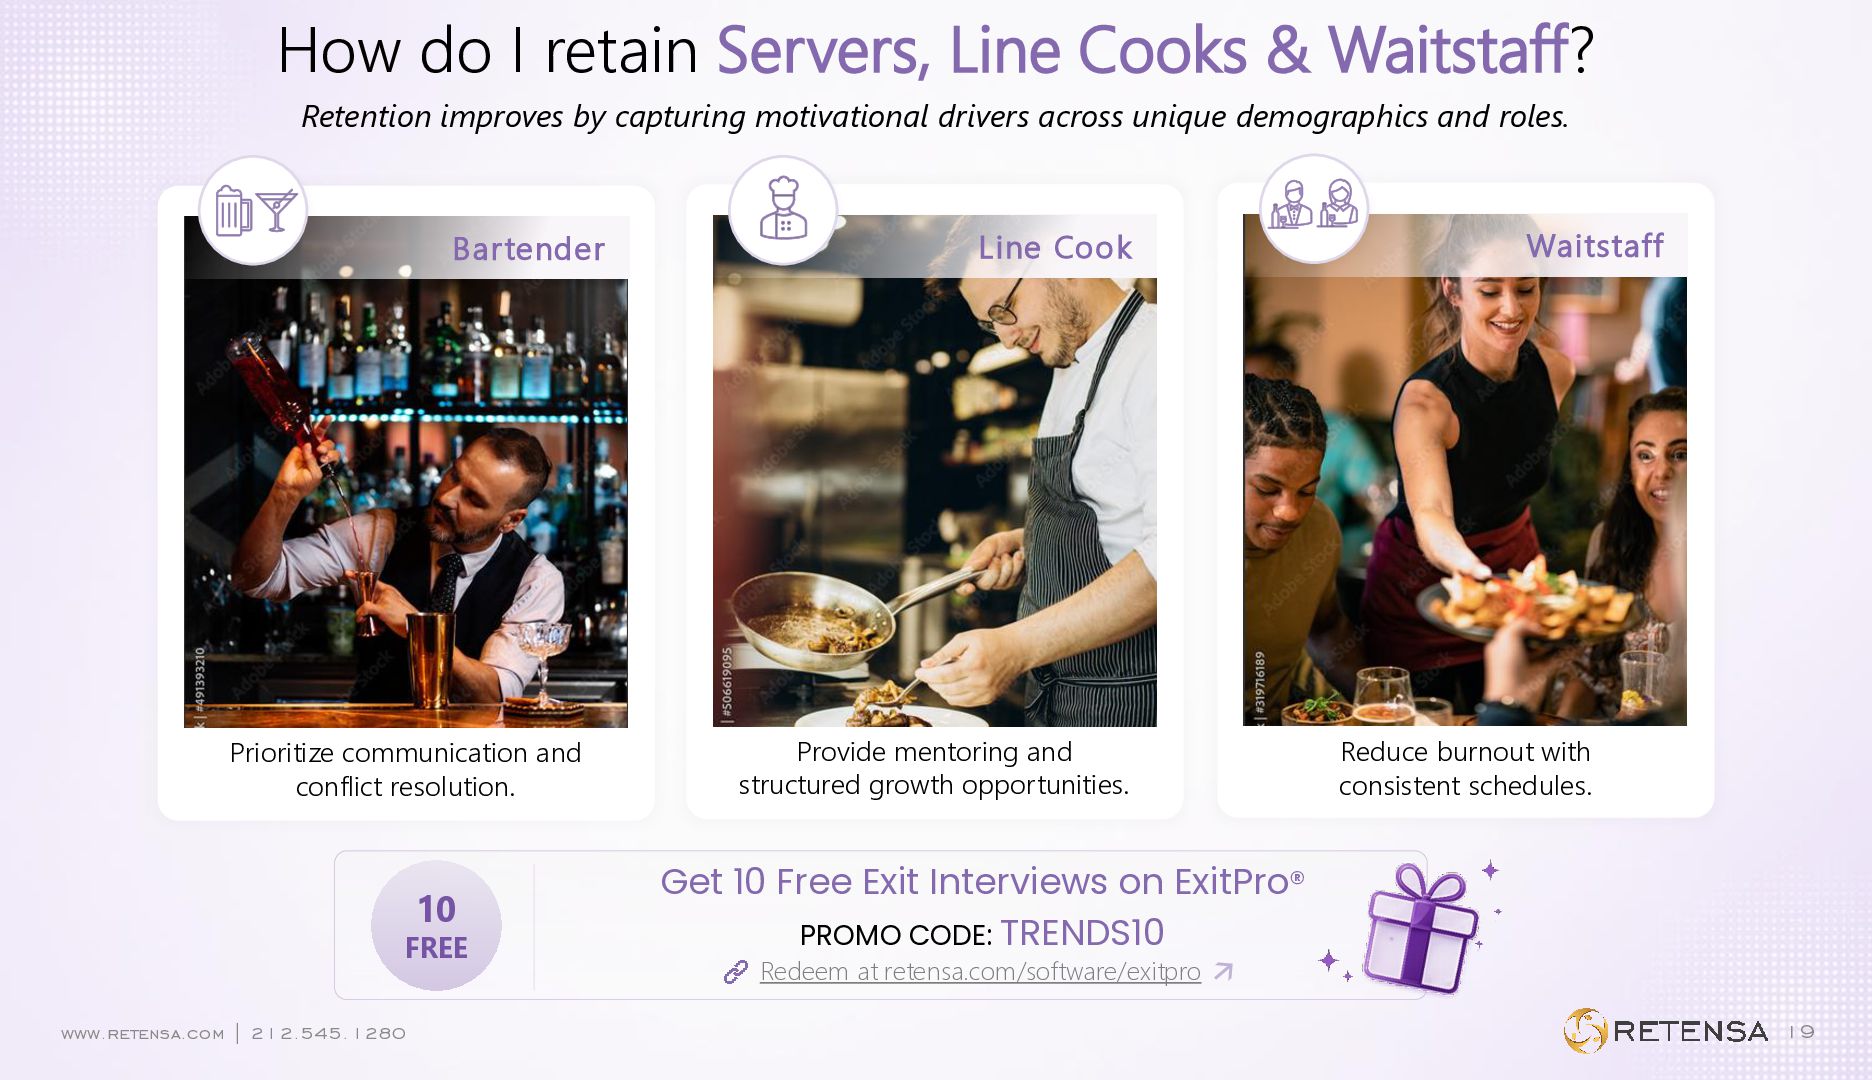
improves by capturing motivational drivers across unique demographics and roles. Bartender Prioritize communication and conflict resolution. 10 FREE Line Cook Provide mentoring and structured growth opportunities. Waitstaff Reduce burnout with consistent schedules. Get 10 Free Exit Interviews on ExitPro® PROMO CODE: TRENDS10 Redeem at retensa.com/software/exitpro www.retensa.com | 212.545.1280 www.retensa.com | 212.545.1280 19


 takemura_yuto
 synergymarketing
 progmat
 behealthy
 kgmotors
 reiwatravel_0405
 tamagakiyuya
 kawanotron
 mercari_inc
 flux
 canvasedge
 kaonavi
 bkeepers
 kristinabergwall1
 marcoroth
 moore
 helmedeiros
 inesmontani
 akademiya2063
 minecr
 michaelherold
 addyosmani
 geoffreycrofte
 mclloyd