$30 off During Our Annual Pro Sale. View Details »

Monitoring Tools 大亂鬥 - AWS CloudWatch

Monitoring Tools 大亂鬥 - AWS CloudWatch

主辦單位:DevOps Taiwan
Date: 2018/05/29

相關分享:

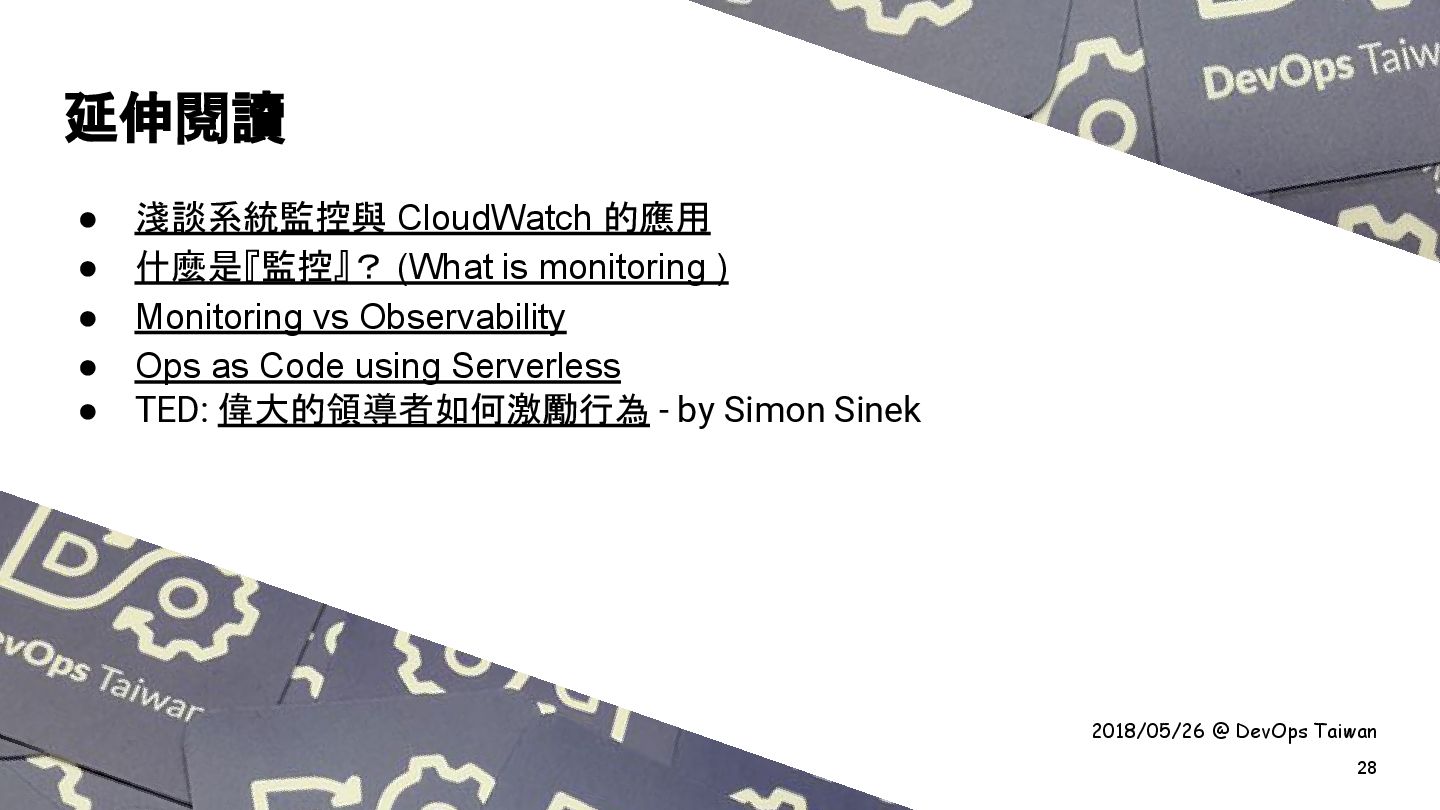
* 淺談系統監控與 AWS CloudWatch 的應用: https://www.slideshare.net/rickhwang/aws-cloudwatch-77145060
* Amazon CloudWatch - Observability and Monitoring: https://www.slideshare.net/rickhwang/amazon-cloudwatch-observability-and-monitoring

Avatar for Rick Hwang

Rick Hwang

May 29, 2018
Tweet

More Decks by Rick Hwang

Other Decks in Education

Transcript

  1. 2018/05/26 @ DevOps Taiwan 打雜@91APP 缺好手,歡迎來聊! 缺:Dev + SRE +

    IT Cloud / AWS / GCP DevOps / SRE Distributed Systems 經營管理 Rick Hwang https://www.gtcafe.com 3 音樂 吉他 鍵盤 編曲 哲學 科幻 金庸 拉低賽 練肖話 都做過惹 FB - SRE Taiwan 義工
  2. 2018/05/26 @ DevOps Taiwan Consideration for Monitoring Tools • Feedback

    and Actions • Observability and Monitoring • Who Needs the Metrics? • Latency: Realtime or Batch • Cost Efficiency 7 目標策略 • Software Engineering • Services, NOT Servers • Event-driven • Programmable • Configurable 執行策略
  3. 2018/05/26 @ DevOps Taiwan 動作 Pipeline 8 蒐集 儲存 分析

    Data Pipeline Observability 觀測:量測、度量 Monitoring 控管、控制 氣象局 政府
  4. 2018/05/26 @ DevOps Taiwan 9 Business (EC, IoT, Backing) Login

    / Logon Shopping Car User Sessions Device Sessions Invention / Stock eDM / SMS Push Shipping QTY GA GMV ROI Tracking Application Servers / Services Tomcat / IIS Nginx / HAProxy RDBMS / NoSQL JVM Heap Size Node.js Task Queue SQS / Kafaka Cache / CDN HTTP Requests HTTP 4XXs / 5XXs LB Latency System / Virtual Machine CPU Utilizations Disk I/O Disk IOPS / Throughput Network I/O Memory Utilizations Disk Usage CPU Credit System Check Instance Check Network Infrastructure Security Traffic Flow Network ACL Firewall AD/DC LDAP IAM AAA DNS SSL 誰・看・哪些指標? Boss Managers Developers Administrators Network Security
  5. 2018/05/26 @ DevOps Taiwan 10 Business (EC, IoT, Backing) Login

    / Logon Shopping Car User Sessions Device Sessions Invention / Stock eDM / SMS Push Shipping QTY GA GMV ROI Tracking Application Servers / Services Tomcat / IIS Nginx / HAProxy RDBMS / NoSQL JVM Heap Size Node.js Task Queue SQS / Kafaka Cache / CDN HTTP Requests HTTP 4XXs / 5XXs LB Latency System / Virtual Machine CPU Utilizations Disk I/O Disk IOPS / Throughput Network I/O Memory Utilizations Disk Usage CPU Credit System Check Instance Check Network Infrastructure Security Traffic Flow Network ACL Firewall AD/DC LDAP IAM AAA DNS SSL 誰・看・哪些指標? Boss Managers Developers Administrators Network Security 全公司看的指標,盡可能標準化! On-Call 要看的指標,盡可能結構化! 值班人員看的系統資源,盡可能自動化! 資安、Infra 要注意,GDPR / APT 很恐怖!
  6. 2018/05/26 @ DevOps Taiwan Why AWS CloudWatch • Serverless Monitoring

    System • Event-driven → Lambda • Managed Storage • Programmable and Automation • Realtime and Backup • CloudWatch 滿足 “Basic Montioring” 的需求 • 不用 Monitoring Monitoring System 13
  7. 14 EC2 Instances Log Shipper Logs Log Groups Log Stream

    A Log Stream B Log Stream C Log Stream N Alarms Filters [ts, hostname, scope=NGX, tcp_all, tcp_time_wait, tcp_established, ...] /var/log/app/*.log 2017-06-11T08:45:01 app1 NGX 47 0 47 0 0 0 2017-06-11T08:45:01 app2 NGX 52 0 52 0 0 0 2017-06-11T08:46:01 app1 NGX 53 0 52 0 0 0 2017-06-11T08:46:01 app2 NGX 52 0 51 0 0 0 2017-06-11T08:47:01 app1 NGX 53 0 53 0 0 0 2017-06-11T08:47:01 app2 NGX 53 0 53 0 0 0 2017-06-11T08:48:01 app1 NGX 59 0 59 0 0 0 2017-06-11T08:48:01 app2 NGX 52 0 51 0 0 0 2017-06-11T08:49:01 app1 NGX 48 0 48 0 0 0 Dashboard Metrics S3 Amazon ES Lambda SNS Topics Export Streaming Push Lambda
  8. 2018/05/26 @ DevOps Taiwan 15 CloudWatch 滿足 “Basic Montioring” 的需求

    不足的怎麼辦? 很少有一個技術可以滿足所有情境
  9. 2018/05/26 @ DevOps Taiwan • 分析:ELK ◦ 架構:複雜、高大上 ◦ 頻率:即時

    ◦ 成本:很貴 (不要問,很恐怖!) ◦ 用途:Aggregation、花花綠綠的圖 • Log 備份:Kinesis Firehose + S3 + Glacier ◦ 架構:分片處理、效能、ETL ◦ 頻率:每分、每刻、每時、每天 ◦ 成本:涓涓流水 (還是有) ◦ 用途:Auditing, Compliance • Athena: BigQuery on AWS ◦ 架構:用就是了 ◦ 用途:報表、分析 ◦ 頻率:每週、每月、每季、每年 ◦ 成本:很低 配套方案 (場景) 16 Partial Realtime (個案) On-Demond (通案) Hourly, Daily (通案) Kinesis Athena ELK
  10. 2018/05/26 @ DevOps Taiwan 動作 Pipeline 17 蒐集 儲存 分析

    S3 CW Logs Kinesis Elasticsearch CW Logs Athena Lambda Grafana Kibana Dashboard CW Agent Elasticsearch Observability 觀測:量測、度量 Monitoring 控管、控制
  11. 2018/05/26 @ DevOps Taiwan 21 指標?誰?做什麼? Boss Managers Developers Administrators

    Network Security 全公司看的指標,盡可能標準化! On-Call 要看的指標,盡可能結構化! 值班人員看的系統資源,盡可能自動化! 資安、Infra 要注意,GDPR / APT 很恐怖!
  12. 2018/05/26 @ DevOps Taiwan 為什麼不選其它監控工具? • 不想自己蓋機器、養機器 • 監控系統做得再好,都只是成本 •

    監控系統不是搞 Big Data、搞 AI • 不想養 Storage Service 22 相關分享: Ops as Code using Serverless
  13. 2018/05/26 @ DevOps Taiwan • 成本 ◦ 金錢、管理 ◦ 技術、溝通

    • 技術 ◦ 架構、效能、儲存 ◦ 安全、可程式化 請想想這些問題 23
  14. 2018/05/26 @ DevOps Taiwan • 活用 SaaS,像是 AWS CloudWatch、GCP Stackdriver

    • 考慮部署:設定成 Configurable、跨區部署 • Log 結構化格式 (csv or json):才可以查 詢、自動化 • 設計 Health Check (Best?) Practice 24 • 利用 Big Data Solution 處理 Log Query 需求,像是 AWS Athena or GCP BigQuery • Log 透過 Shipper (awslogs, statsd, collectd, fluentd, telegraf ... ) 同時傳到 ◦ S3 備份,以符合稽核需求 • 巨量 Log Streaming 資料需要有 Queue 協助 ◦ AWS Kinesis Firehose ◦ GCP Pub/Sub
  15. 2018/05/26 @ DevOps Taiwan • Feedback and Actions • Observability

    and Monitoring • Who Needs the Metrics? • Latency: Realtime or Batch • Cost Efficiency Consideration for Monitoring Tools 26 目標策略 • Software Engineering • Services, NOT Servers • Event-driven • Programmable • Configurable 執行策略
  16. 2018/05/26 @ DevOps Taiwan 延伸閱讀 • 淺談系統監控與 CloudWatch 的應用 •

    什麼是『監控』? (What is monitoring ) • Monitoring vs Observability • Ops as Code using Serverless • TED: 偉大的領導者如何激勵行為 - by Simon Sinek 28