Upgrade to Pro — share decks privately, control downloads, hide ads and more …

prefig

 prefig

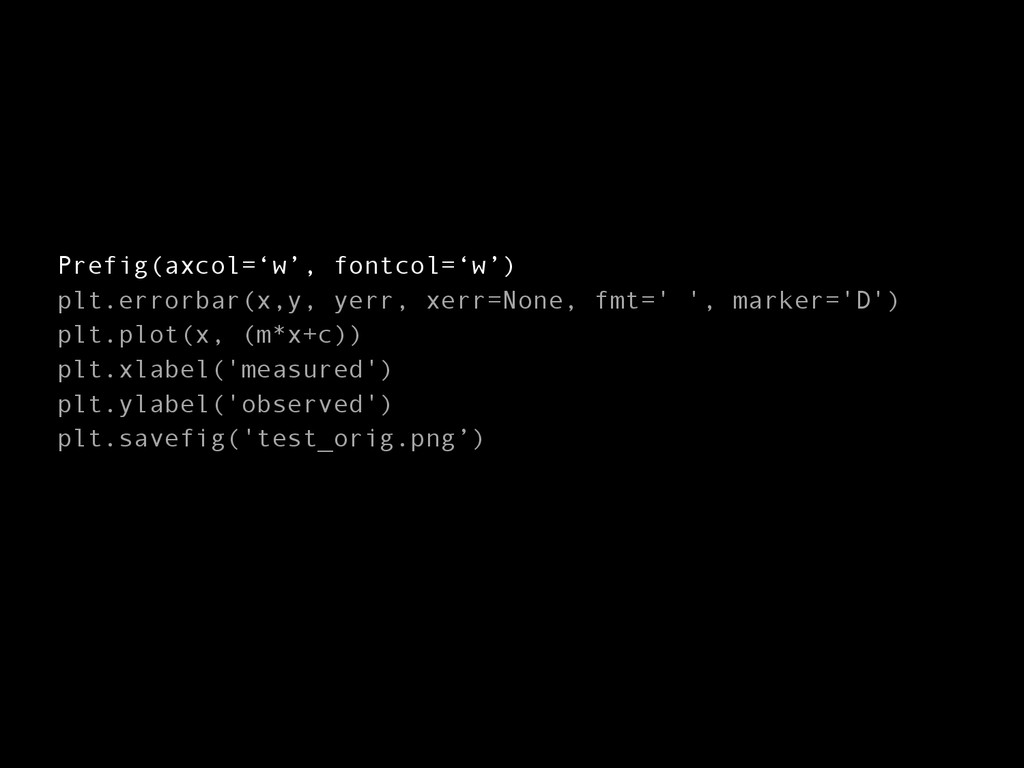
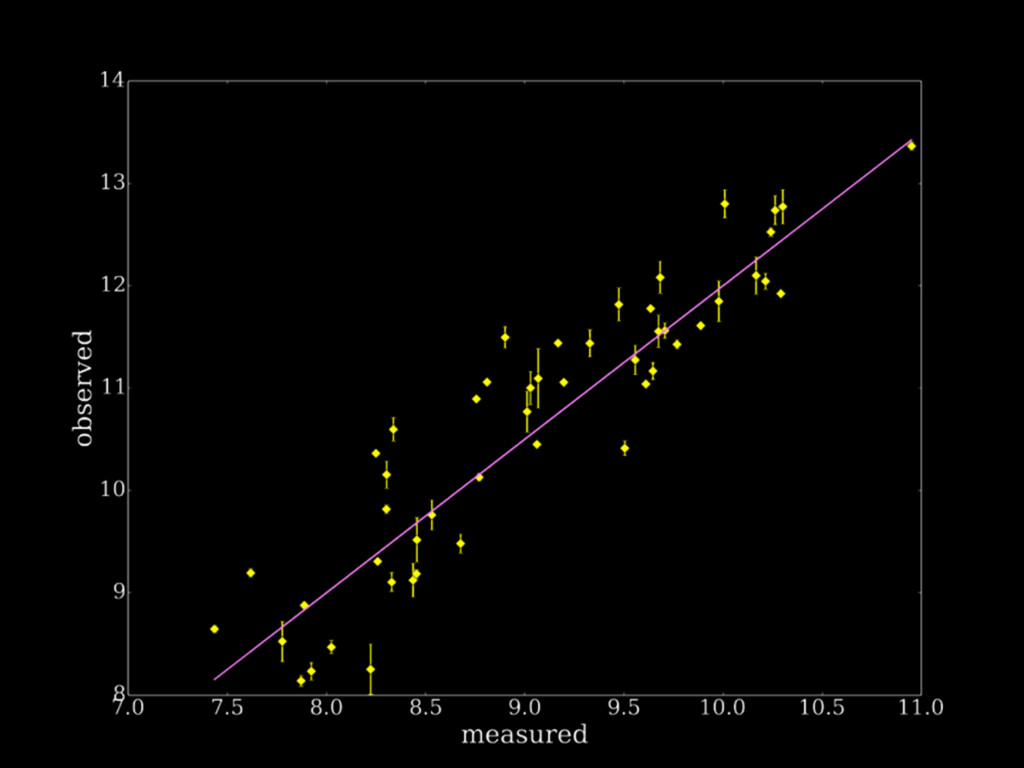
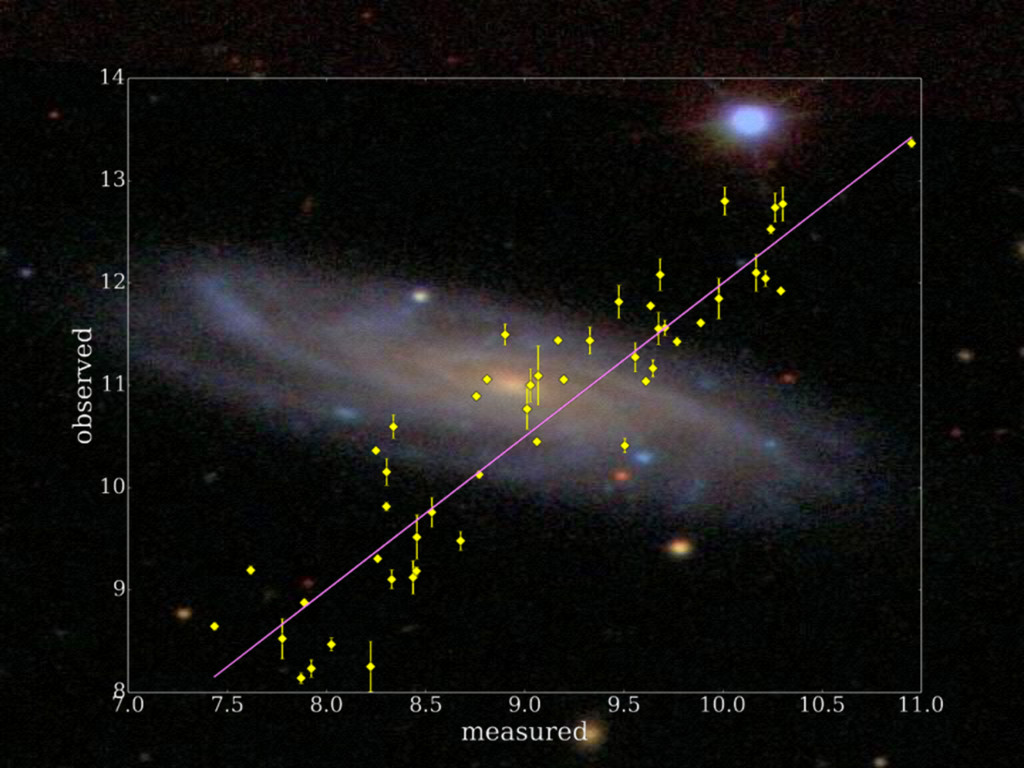
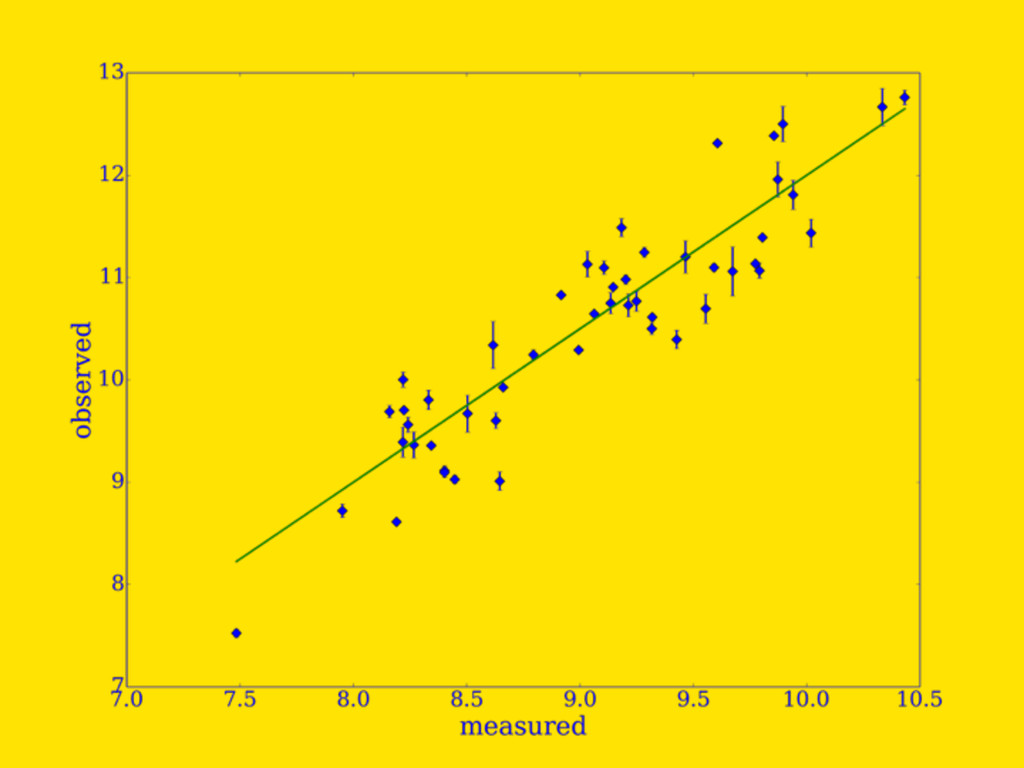
Lightning talk given at the Python in Astronomy (#pyastro15) workshop at the Lorentz Center, Leiden University. prefig is a python figure class which allows you to produce poster and presentation worthy plots in matplotlib by replacing one line of code.

rjsmethurst

April 23, 2015
Tweet

More Decks by rjsmethurst

Other Decks in Programming

Transcript

  1. plt.figure() plt.errorbar(x, y, yerr, xerr=None, fmt=' ', marker='D') plt.plot(x, (m*x+c))

    plt.xlabel('measured') plt.ylabel('observed') plt.savefig('test_orig.png’)
  2. Prefig(axcol=‘w’, fontcol=‘w’) plt.errorbar(x,y, yerr, xerr=None, fmt=' ', marker='D') plt.plot(x, (m*x+c))

    plt.xlabel('measured') plt.ylabel('observed') plt.savefig('test_orig.png’)