Upgrade to Pro — share decks privately, control downloads, hide ads and more …

Causal Salad in Human Evolution & Ecology — EHBEA 2019 Plenary

Causal Salad in Human Evolution & Ecology — EHBEA 2019 Plenary

Richard McElreath

April 26, 2019
Tweet

More Decks by Richard McElreath

Other Decks in Science

Transcript

  1. Causal Salad in
    Human Evolution
    & Ecology
    Richard McElreath

    @rlmcelreath
    Max Planck Institute for Evolutionary Anthropology

    View Slide

  2. View Slide

  3. Mom’s RS
    Daughter’s RS

    View Slide

  4. Mom’s RS
    Daughter’s RS
    What is influence of mom on daughter?
    Include mom’s birth order in regression?

    View Slide

  5. Department of Human Behavior, Ecology and Culture

    View Slide

  6. Retire statistical significance
    Valentin Amrhein, Sander Greenland, Blake McShane and more than 800 signatories
    call for an end to hyped claims and the dismissal of possibly crucial effects.
    ILLUSTRATION BY DAVID PARKINS
    2019

    View Slide

  7. View Slide

  8. 2016
    ASA Statement on Statistical Significance and P-Values
    1. Introduction
    Increased quantification of scientific research and a prolifera-
    tion of large, complex datasets in recent years have expanded the
    scope of applications of statistical methods. This has created new
    avenues for scientific progress, but it also brings concerns about
    conclusions drawn from research data. The validity of scientific
    conclusions, including their reproducibility, depends on more
    than the statistical methods themselves. Appropriately chosen
    techniques, properly conducted analyses and correct interpre-
    tation of statistical results also play a key role in ensuring that
    conclusions are sound and that uncertainty surrounding them
    is represented properly.
    Underpinning many published scientific conclusions is the
    concept of “statistical significance,” typically assessed with an
    index called the p-value. While the p-value can be a use-
    ful statistical measure, it is commonly misused and misinter-
    preted. This has led to some scientific journals discouraging
    the use of p-values, and some scientists and statisticians recom-
    a proposed
    context is a m
    tions, togethe
    the null hypo
    such as no diff
    of a relations
    smaller the p
    bility of the d
    ing assumptio
    incompatibili
    or providing
    underlying as
    2. P-values do n
    ied hypothes
    were produc
    Researche
    ment about t
    probability th
    data. The p-v
    rah Mayo, Michele Millar, Charles Poole, Ken Rothman, Stephen
    Senn, Dalene Stangl, Philip Stark and Steve Ziliak for sharing
    their insightful perspectives.
    Of special note is the following article, which is a significant
    contribution to the literature about p-values and statistical
    significance.
    Greenland, S., Senn, S.J., Rothman, K.J., Carlin, J.B., Poole, C., Good-
    man, S.N. and Altman, D.G.: “Statistical Tests, P-values, Confidence
    Intervals, and Power: A Guide to Misinterpretations.”
    Though there was disagreement on exactly what the state-
    ment should say, there was high agreement that the ASA should
    be speaking out about these matters.
    Let us be clear. Nothing in the ASA statement is new. Statisti-
    cians and others have been sounding the alarm about these mat-
    ters for decades, to little avail. We hoped that a statement from
    the world’s largest professional association of statisticians would
    open a fresh discussion and draw renewed and vigorous atten-
    tion to changing the practice of science with regards to the use
    of statistical inference.
    P-
    r Li
    r M
    wi
    r M
    tio
    r Ro
    ca
    r Se
    r St
    r St
    r Zi
    sta
    Refere
    America
    Lim
    polic
    Gelman,
    [onl
    n
    -
    t
    m
    e
    n
    -
    g
    -
    y
    )
    -
    s
    e
    h
    -
    ing assumptions used to calculate the p-value hold. This
    incompatibility can be interpreted as casting doubt on
    or providing evidence against the null hypothesis or the
    underlying assumptions.
    2. P-values do not measure the probability that the stud-
    ied hypothesis is true, or the probability that the data
    were produced by random chance alone.
    Researchers often wish to turn a p-value into a state-
    ment about the truth of a null hypothesis, or about the
    probability that random chance produced the observed
    data. The p-value is neither. It is a statement about data
    in relation to a specified hypothetical explanation, and is
    not a statement about the explanation itself.
    3. Scientific conclusions and business or policy decisions
    should not be based only on whether a p-value passes
    a specific threshold.
    Practices that reduce data analysis or scientific infer-
    ence to mechanical “bright-line” rules (such as “p <
    0.05”) for justifying scientific claims or conclusions can
    lead to erroneous beliefs and poor decision making. A
    conclusion does not immediately become “true” on one
    side of the divide and “false” on the other. Researchers
    should bring many contextual factors into play to derive
    scientific inferences, including the design of a study,

    View Slide

  9. Illustration: Julia Suits

    View Slide

  10. Causal Salad
    • Unconscious causal model
    • Vague connections between
    theory, hypotheses, statistics
    • No explicit logic for
    • Control variables
    • Omitted variables
    • Any association causal?

    View Slide

  11. Knowing a causal relationship means
    being able to accurately predict the
    consequences of an intervention.
    From Van Lente &
    Dunlavey Action
    Philosophers!

    View Slide

  12. Inconvenient Truths
    • Covariates create confounds
    • Prediction not causal inference
    • Data not enough
    • Reproducibility not enough

    View Slide

  13. Pleasing Truths
    • Causal inference possible in
    observational studies
    • Explicit causal models aid design
    and analysis
    • Algorithmic framework exists: 

    do-calculus
    • Don’t need best, just better

    View Slide

  14. Mom’s RS
    Daughter’s RS
    Include mom’s birth order in regression?

    View Slide

  15. Elwert 2013 Graphical Causal Models, Handbook of Causal Analysis for Social Research
    Structural Causal Models
    Directed acyclic graphs (DAGs)
    Partially directed acyclic graphs (PDAGs)
    265
    b
    Dj
    (t+1) Uj
    Hj Dj
    (t+1)
    Mi,j
    Mi,j
    Di
    (t) Ui
    Hi Di
    (t)
    ial network analysis is endogenous selection bias. Mij
    , marital status of woman i and man
    stics influencing marital choice and vital status; H, health in old age. (a) Computing the
    implies conditioning on Mij
    , which induces an association between Di
    and Dj
    even if D
    (b) If Di
    affects Dj
    only if i and j are married (effect modification), then the existence o
    n the DAG, Di
    !Dj
    and Mij
    !Dj
    . Conditioning on either one of Hi
    or Hj
    would block the
    nditioning on the social tie Mij
    and allow for the identification of the causal effect of D

    View Slide

  16. Structural Causal Models
    From Paul Hünermund (@PHuenermund)

    View Slide

  17. 2nd edition contains
    lots of DAGs
    xcelab.net/rm/sr2
    password: tempest

    View Slide

  18. Elemental Confounds
    X Y
    Z

    View Slide

  19. Elemental Confounds
    X Y
    Z
    1. The Fork

    View Slide

  20. Elemental Confounds
    X Y
    Z
    2. The Pipe

    View Slide

  21. Elemental Confounds
    X Y
    Z
    3. The Collider

    View Slide

  22. Elemental Confounds
    switch power
    light
    3. The Collider

    View Slide

  23. Elemental Confounds
    switch ON power ?
    light OFF
    3. The Collider

    View Slide

  24. Elemental Confounds
    newsworthy rigorous
    published in nature
    3. The Collider

    View Slide

  25. Elemental Confounds
    X Y
    Z
    The Fork
    X Y
    Z
    The Pipe
    X Y
    Z
    The Collider
    inference = f (theory, data, statistics)

    View Slide

  26. Elemental Confounds
    • Given a DAG, can:
    • deduce identification strategy
    • design identification strategy
    • compute intervention
    • test some aspects of DAG
    • communicate assumptions
    X Y
    Z
    X Y
    Z
    X Y
    Z

    View Slide

  27. Mom’s RS
    Daughter’s RS
    Include mom’s birth order in regression?

    View Slide

  28. Kin Effects & Haunted Graphs
    Grandparent Child
    Interdisciplinary perspectives on grandparental investment: a
    journey towards causality
    David A Coalla,b, Sonja Hilbrandc,d, Rebecca Seare and Ralph Hertwigd
    aSchool of Medical and Health Sciences, Edith Cowan University, Joondalup, WA, Australia;bDivision of
    Psychiatry, School of Medicine, University of Western Australia, Crawley, WA, Australia;cDepartment of
    Psychology, University of Basel, Basel, Switzerland;dCenter for Adaptive Rationality, Max Planck Institute for
    Human Development, Berlin, Germany;eDepartment of Population Health, London School of Hygiene and
    Tropical Medicine, London, UK
    ABSTRACT
    Why do grandparents invest so heavily in their grandchildren and
    what impact does this investment have on families? A multitude
    of factors influence the roles grandparents play in their families.
    Here, we present an interdisciplinary perspective of
    grandparenting incorporating theory and research from
    evolutionary biology, sociology and economics. Discriminative
    grandparental solicitude, biological relatedness and the impact of
    resource availability are three phenomena used to illustrate how
    these perspectives, within such a multi-level approach, add value
    by complementing not competing with each other. Changing
    demographics mean there is greater demand and opportunity for
    ARTICLE HISTORY
    Received 15 November 2017
    Accepted 23 January 2018
    KEYWORDS
    Grandparents;
    interdisciplinary perspectives;
    grandparent health;
    grandparental investment;
    grandchild development
    CONTEMPORARY SOCIAL SCIENCE, 2018
    https://doi.org/10.1080/21582041.2018.1433317

    View Slide

  29. Kin Effects & Haunted Graphs
    Grandparent
    Parent
    Child

    View Slide

  30. Kin Effects & Haunted Graphs
    Grandparent
    Parent
    Child
    U1

    View Slide

  31. Kin Effects & Haunted Graphs
    Grandparent
    Parent
    Child
    U1
    U2

    View Slide

  32. Code at https://gist.github.com/rmcelreath
    Kin Effects & Haunted Graphs
    Grandparent
    Parent
    Child
    U1
    U2
    Simulate 1000 families:
    + +

    – +
    +

    View Slide

  33. Code at https://gist.github.com/rmcelreath
    Kin Effects & Haunted Graphs
    G
    (Intercept)
    -1 0 1 2 3
    Value
    child ~ grandparent
    Grandparent
    Parent
    Child
    U1
    U2

    View Slide

  34. Code at https://gist.github.com/rmcelreath
    Kin Effects & Haunted Graphs
    P
    G
    (Intercept)
    -0.5 0.0 0.5 1.0 1.5
    Value
    child ~ grandparent + parent
    G
    (Intercept)
    -1 0 1 2 3
    Value
    child ~ grandparent

    View Slide

  35. Kin Effects & Haunted Graphs
    Grandparent
    Parent
    Child
    U1
    U2
    P
    G
    (Intercept)
    -0.5 0.0 0.5 1.0 1.5
    Value
    child ~ grandparent + parent
    Code at https://gist.github.com/rmcelreath

    View Slide

  36. No Dodging Theory
    • Simpson’s paradox: Reversal of association
    when covariate is added to model
    • Purely statistical phenomenon
    • Uninterpretable without a causal model
    P
    G
    (Intercept)
    -0.5 0.0 0.5 1.0 1.5
    Value
    child ~ grandparent + parent

    View Slide

  37. Mom’s RS
    Daughter’s RS
    Include mom’s birth order in regression?

    View Slide

  38. What Can Cross-Cultural Correlations Teach
    Us about Human Nature?
    Thomas V. Pollet & Joshua M. Tybur &
    Willem E. Frankenhuis & Ian J. Rickard
    Published online: 5 August 2014
    # Springer Science+Business Media New York 2014
    Abstract Many recent evolutionary psychology and human behavioral ecology studies
    have tested hypotheses by examining correlations between variables measured at a
    group level (e.g., state, country, continent). In such analyses, variables collected for
    each aggregation are often taken to be representative of the individuals present within
    them, and relationships between such variables are presumed to reflect individual-level
    processes. There are multiple reasons to exercise caution when doing so, including: (1)
    the ecological fallacy, whereby relationships observed at the aggregate level do not
    accurately represent individual-level processes; (2) non-independence of data points,
    which violates assumptions of the inferential techniques used in null hypothesis testing;
    and (3) cross-cultural non-equivalence of measurement (differences in construct valid-
    ity between groups). We provide examples of how each of these gives rise to problems
    (e.g., Marlowe et al. 2008, 2011), and sexual dimorphism (Wells 20
    Fig. 1 Three levels at which hypotheses can be analyzed: between groups, betw
    groups, and within individuals over time. Note: Interactions between levels might exi
    if the differences between individuals, or the developmental trajectories of individuals
    Re-evaluating the link between brain size
    and behavioural ecology in primates
    Lauren E. Powell1, Karin Isler2 and Robert A. Barton1
    1

    View Slide

  39. Martin 1993 Primate Origins: Plugging the Gaps
    Comparative Confounds
    REVIEW ARTICLE
    10
    11
    12
    13
    14
    15
    16
    7
    . - ...
    - -.- - - - -'
    :
    .... .. \
    , .
    . ',' .'
    . , ,
    ...... .....
    \
    ' ......... .
    , .
    '----.-----'
    Full tree
    10
    11
    12
    13
    14
    15
    16
    .........................
    30/0 Sample

    View Slide

  40. Comparative Confounds
    Brain Range

    View Slide

  41. Comparative Confounds
    Brain Range
    (Plasticity)

    View Slide

  42. Comparative Confounds
    Brain Range
    (Plasticity)
    Extinction

    View Slide

  43. Comparative Confounds
    Brain Range
    (Plasticity)
    Extinction

    View Slide

  44. Comparative Confounds
    Brain Range
    (Plasticity)
    Extinction
    +

    +
    Only brainy species surviving are
    those who are also plastic.
    Code at https://gist.github.com/rmcelreath

    View Slide

  45. Code at https://gist.github.com/rmcelreath
    Comparative Confounds
    Brain Range
    (Plasticity)
    Extinction
    +

    +
    brain
    (Intercept)
    0.0 0.5 1.0 1.5
    Value
    range ~ brain

    View Slide

  46. Comparative Confounds
    Brain Range
    “Phylogeny”

    View Slide

  47. Comparative Confounds
    COMMENTARY
    doi:10.1111/evo.12832
    Irrational exuberance for resolved species
    trees
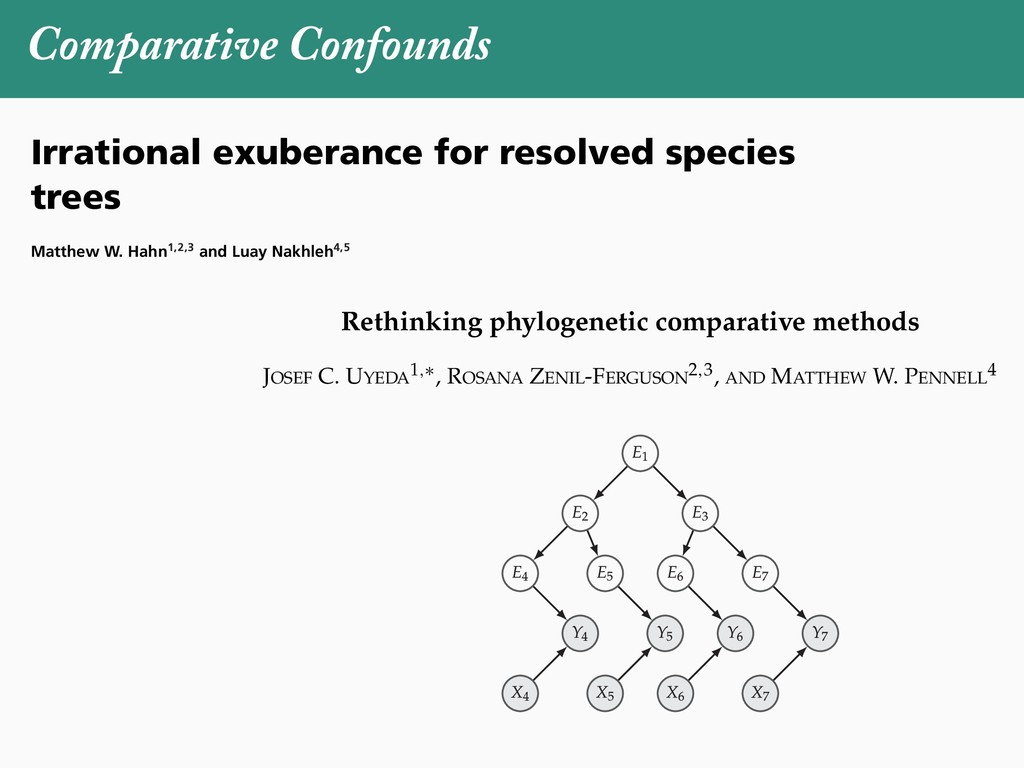
    Matthew W. Hahn1,2,3 and Luay Nakhleh4,5
    1Department of Biology, Indiana University, Bloomington, Indiana 47405
    2School of Informatics and Computing, Indiana University, Bloomington, Indiana 47405
    3E-mail: [email protected]
    4Department of Computer Science, Rice University, Houston, Texas 77005
    5BioSciences, Rice University, Houston, Texas 77005
    Received November 15, 2015
    Accepted November 30, 2015
    Phylogenomics has largely succeeded in its aim of accurately inferring species trees, even when there are high levels of discordance
    among individual gene trees. These resolved species trees can be used to ask many questions about trait evolution, including the
    direction of change and number of times traits have evolved. However, the mapping of traits onto trees generally uses only a
    single representation of the species tree, ignoring variation in the gene trees used to construct it. Recognizing that genes underlie
    traits, these results imply that many traits follow topologies that are discordant with the species topology. As a consequence,
    standard methods for character mapping will incorrectly infer the number of times a trait has evolved. This phenomenon, dubbed
    “hemiplasy,” poses many problems in analyses of character evolution. Here we outline these problems, explaining where and
    when they are likely to occur. We offer several ways in which the possible presence of hemiplasy can be diagnosed, and discuss
    multiple approaches to dealing with the problems presented by underlying gene tree discordance when carrying out character
    mapping. Finally, we discuss the implications of hemiplasy for general phylogenetic inference, including the possible drawbacks
    of the widespread push for “resolved” species trees.
    Points of View
    Syst. Biol. 67(6):1091–1109, 2018
    © The Author(s) 2018. Published by Oxford University Press, on behalf of the Society of Systematic Biologists. All rights reserved.
    For Permissions, please email: [email protected]
    DOI:10.1093/sysbio/syy031
    Advance Access publication April 25, 2018
    Rethinking phylogenetic comparative methods
    JOSEF C. UYEDA
    1,∗, ROSANA ZENIL-FERGUSON
    2,3, AND MATTHEW W. PENNELL
    4
    1Department of Biological Sciences, Virginia Polytechnic Institute and State University, 926 West Campus Drive, Blacksburg,
    2Department of Biological Sciences, University of Idaho, 875 Perimeter Drive, Moscow, ID 83844 USA;
    3Department of Ecology, Evolution and Behavior, University of Minnesota, 1479 Gortner Avenue, St. Paul, MN 55108
    4Department of Zoology and Biodiversity Research Centre, University of British Columbia, #4200-6700 University Blvd., Vancouver
    ∗Correspondence to be sent to: Department of Biological Sciences, Virginia Polytechnic Institute and State University, Blacksbur
    E-mail: [email protected]
    Received: 21 November 2017; reviews returned: 17 March 2018; accepted: 17 April 2018
    Associate Editor: Nicholas Matzke
    Abstract.—As a result of the process of descent with modification, closely related species tend to be similar to one
    a myriad different ways. In statistical terms, this means that traits measured on one species will not be independ
    measured on others. Since their introduction in the 1980s, phylogenetic comparative methods (PCMs) have been
    a solution to this problem. In this article, we argue that this way of thinking about PCMs is deeply misleading. N
    this sowed widespread confusion in the literature about what PCMs are doing but has led us to develop metho
    susceptible to the very thing we sought to build defenses against—unreplicated evolutionary events. Through
    Studies, we demonstrate that the susceptibility to singular events is indeed a recurring problem in comparative b
    ited by: YS MANUSCRIPT CATEGORY: Points of View
    04 SYSTEMATIC BIOLOGY VOL. 67
    A B

    View Slide

  48. Mom’s RS
    Daughter’s RS
    Include mom’s birth order in regression?

    View Slide

  49. Bette and Barbara
    • Simulate:
    • Mom (X) has no direct influence on daughter (Y)
    • X and Y confounded by common U
    • Birth order (B) reduces mom’s RS (X)
    X
    U
    Y
    B
    Code at https://gist.github.com/rmcelreath

    View Slide

  50. Bette and Barbara
    X
    (Intercept)
    -0.2 0.0 0.2 0.4 0.6 0.8 1.0
    Value
    AIC = 1761
    Code at https://gist.github.com/rmcelreath
    X
    U
    Y
    B

    View Slide

  51. Bette and Barbara
    X
    (Intercept)
    -0.2 0.0 0.2 0.4 0.6 0.8 1.0
    Value
    AIC = 1761
    B
    X
    (Intercept)
    -0.2 0.0 0.2 0.4 0.6 0.8 1.0
    Value
    AIC = 1674
    Code at https://gist.github.com/rmcelreath

    View Slide

  52. Model Comparison Is No Solution
    • Confounding variables will improve predictions,
    until we (or nature) intervene
    • AIC cannot identify causal relationships
    B
    X
    (Intercept)
    -0.2 0.0 0.2 0.4 0.6 0.8 1.0
    Value
    AIC = 1674

    View Slide

  53. Thinking Causally, not Statistically
    • Can use these data to infer X Y
    • Need to use B as an instrument
    • Requires simultaneous equations
    • Right stat model depends upon causal model
    X
    U
    Y
    B

    View Slide

  54. Causal Salad Digested
    • Data are not enough
    • Causal model influences design
    • Causal model influences
    analysis
    • Causal model communicates
    assumptions
    • Large interdisciplinary
    community

    View Slide

  55. 2nd edition contains
    lots of DAGs
    xcelab.net/rm/sr2
    password: tempest

    View Slide

  56. View Slide