Upgrade to Pro — share decks privately, control downloads, hide ads and more …

No Silver Bullets : OBIEE Performance in the Real World

No Silver Bullets : OBIEE Performance in the Real World

Are you involved in the design and development of OBIEE systems and want to know the best way to go about ensuring good performance? Maybe you've an existing OBIEE system with performance “challenges” that you need to diagnose?
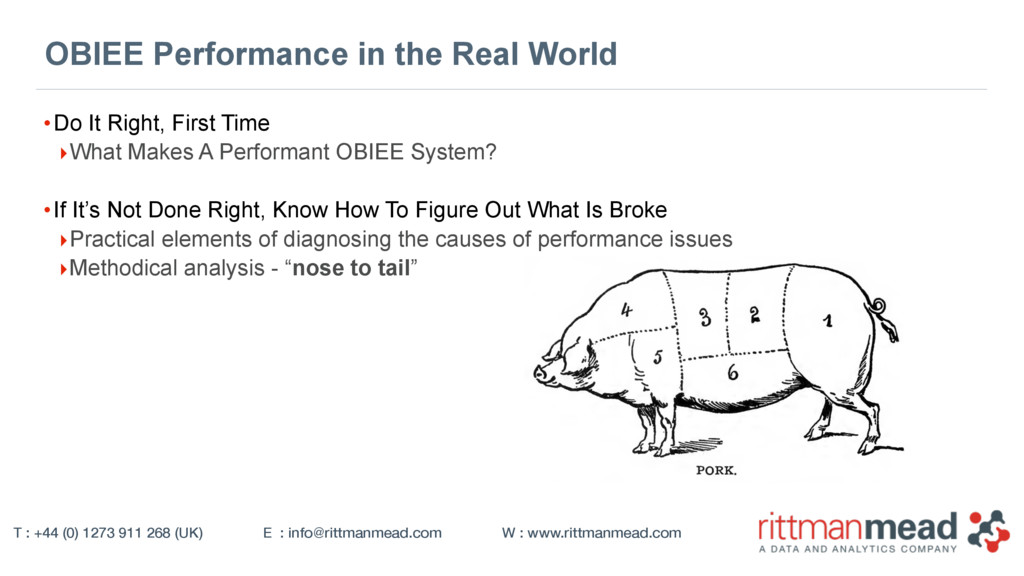
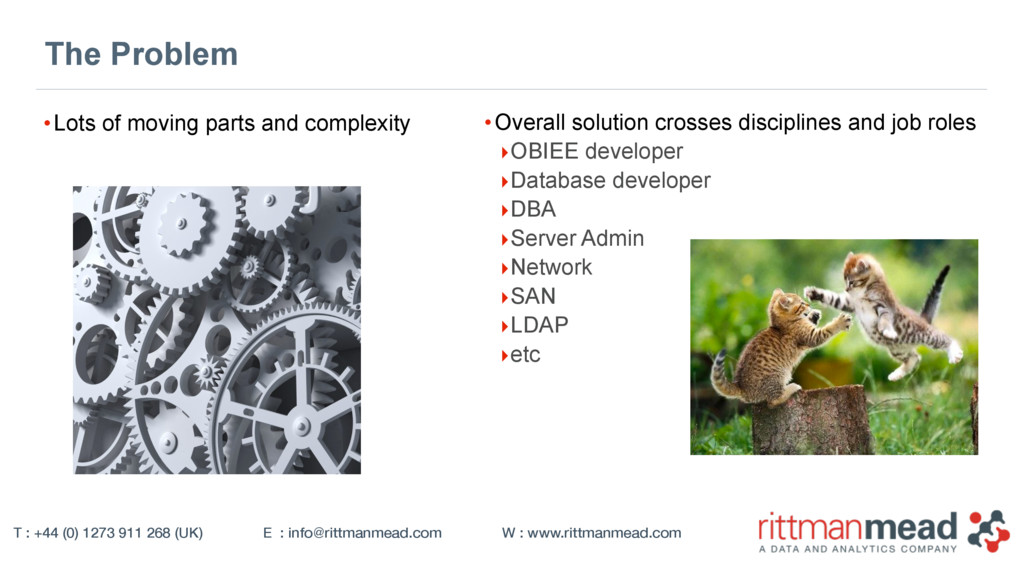
This presentation looks at the practical elements of diagnosing the causes of performance issues in OBIEE, and discusses good practices to observe when developing new systems.

Robin Moffatt

January 22, 2015
Tweet

More Decks by Robin Moffatt

Other Decks in Technology

Transcript

  1. T : +44 (0) 1273 911 268 (UK) E : [email protected] W : www.rittmanmead.com
    No Silver Bullets : OBIEE Performance
    in the Real World

    Robin Moffatt, Principal Consultant
    Rittman Mead
    Riga Dev Day, 22 January 2015

    View Slide

  2. T : +44 (0) 1273 911 268 (UK) or (888) 631-1410 (USA) or 

    +61 3 9596 7186 (Australia & New Zealand) or +91 997 256 7970 (India)
    E : [email protected]
    W : www.rittmanmead.com
    •Principal Consultant with Rittman Mead
    •Previously OBIEE/DW developer at large UK retailer
    •Previously SQL Server DBA, Business Objects, 

    DB2, COBOL….

    •Newly minted Oracle ACE! 

    •Frequent blogger for Rittman Mead : http://ritt.md/rmoff
    •Twitter: @rmoff
    •IRC: rmoff / #obihackers / freenode
    T : +44 (0) 1273 911 268 (UK) or (888) 631-1410 (USA) or 

    +61 3 9596 7186 (Australia & New Zealand) or +91 997 256 7970 (India)
    E : [email protected]
    W : www.rittmanmead.com
    About Me

    View Slide

  3. T : +44 (0) 1273 911 268 (UK) or (888) 631-1410 (USA) or 

    +61 3 9596 7186 (Australia & New Zealand) or +91 997 256 7970 (India)
    E : [email protected]
    W : www.rittmanmead.com
    T : +44 (0) 1273 911 268 (UK) or (888) 631-1410 (USA) or 

    +61 3 9596 7186 (Australia & New Zealand) or +91 997 256 7970 (India)
    E : [email protected]
    W : www.rittmanmead.com
    About Rittman Mead
    •Oracle BI and DW Gold partner
    •Winner of five UKOUG Partner of the Year awards in 2013 and 2014 - including BI
    •World leading specialist partner for technical excellence, 

    solutions delivery and innovation in Oracle BI
    •Approximately 80 consultants worldwide
    •All expert in Oracle BI and DW
    •Offices in US (Atlanta), Europe, Australia and India
    •Skills in broad range of supporting Oracle tools:
    ‣OBIEE, OBIA
    ‣ODIEE
    ‣Essbase, Oracle OLAP
    ‣GoldenGate
    ‣Endeca

    View Slide

  4. T : +44 (0) 1273 911 268 (UK) E : [email protected] W : www.rittmanmead.com
    OBIEE Performance in the Real World
    •Do It Right, First Time
    ‣What Makes A Performant OBIEE System?
    •If It’s Not Done Right, Know How To Figure Out What Is Broke
    ‣Practical elements of diagnosing the causes of performance issues
    ‣Methodical analysis - “nose to tail”

    View Slide

  5. T : +44 (0) 1273 911 268 (UK) E : [email protected] W : www.rittmanmead.com
    The Requirement

    View Slide

  6. T : +44 (0) 1273 911 268 (UK) E : [email protected] W : www.rittmanmead.com
    The Problem
    •Lots of moving parts and complexity •Overall solution crosses disciplines and job roles
    ‣OBIEE developer
    ‣Database developer
    ‣DBA
    ‣Server Admin
    ‣Network
    ‣SAN
    ‣LDAP
    ‣etc

    View Slide

  7. T : +44 (0) 1273 911 268 (UK) E : [email protected] W : www.rittmanmead.com
    The Additional Problem

    View Slide

  8. T : +44 (0) 1273 911 268 (UK) E : [email protected] W : www.rittmanmead.com
    Performance Beyond the “Best Practices”
    •Tear down the reliance on
    “Best Practice”, but with a
    viable, better, alternative
    instead.

    View Slide

  9. T : +44 (0) 1273 911 268 (UK) E : [email protected]ttmanmead.com W : www.rittmanmead.com
    The Only Answer
    EVIDENCE-BASED 

    DESIGN AND DIAGNOSTICS

    View Slide

  10. T : +44 (0) 1273 911 268 (UK) E : [email protected] W : www.rittmanmead.com
    Time Profile
    •To understand why is it slow, we first must understand where is it slow
    •Approach championed by Cary Millsap / Method-R
    •“Thinking Clearly About Performance” (2010)
    Performance improvement is proportional to how much a
    program uses the thing you improved.
    — Amdahl’s Law


    View Slide

  11. T : +44 (0) 1273 911 268 (UK) E : [email protected] W : www.rittmanmead.com
    The OBIEE stack
    Request
    Response
    BI Server
    BI Server
    Presentation
    Services
    Managed Server
    Managed Server
    JavaHost
    Presentation
    Services
    Web Browser
    Web Browser
    BI Plug-in
    BI Plug-in
    DWH
    [ ... ]
    [ ... ]
    DWH
    [ ... ]
    [ ... ]
    User WebLogic Server OBIEE system components Data Source(s)
    Network
    Network
    Not all components listed, eg cluster controller
    -------------------- SQL Request, logical request hash:
    810510fe
    SET VARIABLE QUERY_SRC_CD='Report',SAW_SRC_PATH='/shared/Test/test1 jan\/feb';SELECT
    0 s_0,
    "Sales - Fact Sales"."Dim Products"."Product Type" s_1,
    "Sales - Fact Sales"."Dim Times"."Month" s_2,
    SORTKEY("Sales - Fact Sales"."Dim Times"."Month") s_3,
    "Sales - Fact Sales"."Fact Sales"."Cost" s_4
    FROM "Sales - Fact Sales"
    C1 C2 C3 C4
    ---------- -------------------- -------------------- ----------
    4636.93 Bread Assortments FEB-2000 200002
    4583.53 Bread Assortments JAN-2000 200001
    3445.16 Bread Clubs FEB-2000 200002
    3542.49 Bread Clubs JAN-2000 200001
    4735.63 Cold Drinks FEB-2000 200002
    4565.21 Cold Drinks JAN-2000 200001
    4604.19 Gifts & Baskets FEB-2000 200002
    […]
    -------------------------------------------------------------------------------------------
    s_0 s_1 s_2 s_3 s_4
    -------------------------------------------------------------------------------------------
    0 Bread Assortments JAN-2000 200001 4583.53
    0 Bread Clubs JAN-2000 200001 3542.49
    0 Cold Drinks JAN-2000 200001 4565.21
    0 Gifts & Baskets JAN-2000 200001 4608.01
    0 Hot Drinks JAN-2000 200001 5768.62
    […]
    Sending query to database named orcl (id:

    connection pool named Connection Pool 01
    select sum(T117.FCAST_COST_AMT) as c1,
    T107.PROD_TYPE_DESC as c2,
    T127.MONTH_DESC as c3,
    T127.MONTH_YYYYMM as c4
    from
    GCBC_SALES.TIMES T127 /* Dim_TIMES */ ,
    GCBC_SALES.PRODUCTS T107 /* Dim_PRODUCTS */ ,
    GCBC_SALES.SALES T117 /* Fact_SALES */

    View Slide

  12. T : +44 (0) 1273 911 268 (UK) E : [email protected] W : www.rittmanmead.com
    Time Profile in Action
    •End-user reports a response time of 40 seconds.
    •How can we make it faster? 

    ‣Where did the time get spent?
    Response
    BI Server
    Managed Server
    Presentation
    Services
    Web Browser BI Plug-in
    User WebLogic Server OBIEE system components
    DB Query 1
    25 seconds
    DB Query 2
    5 seconds
    Data
    Processing
    10 seconds
    Page Generation
    5 seconds
    DWH
    Data Source(s)
    DWH
    Time, seconds
    Component

    View Slide

  13. T : +44 (0) 1273 911 268 (UK) E : [email protected] W : www.rittmanmead.com
    Time Profile in Action
    Step Action
    Response
    Time (s)
    %
    1 Physical SQL 1 execute on DB 25.00 62.5
    2 Physical SQL 2 execute on DB [5.00] —
    3 BI Server does work on DB results 10.00 25.0
    4 Presentation Services generates page 5.00 12.5
    Total 40.00 100.0
    DB Query 1
    DB Query 2
    Data Processing
    Page Generation
    Time profile shows clearly :
    1.Improve performance of Query 1
    2.Push work into single query

    View Slide

  14. T : +44 (0) 1273 911 268 (UK) E : [email protected] W : www.rittmanmead.com
    Deep Dive into BI Server Time from nqquery.log
    Elapsed
    Response
    Physical
    Physical Query x
    Physical Query 1 BI Server
    processing
    (federation,
    calculation,
    aggregation)
    Send to client, wait for
    acknowledgement
    Eg. Presentation Services
    generating pivot tables,
    table scrolling/paging, etc.
    Compilation
    DB Connect
    Logical Query Summary
    Stats: [...] Compilation
    time c (seconds)
    Physical query response
    time p1 (seconds)
    Physical query response
    time px (seconds)
    Logical Query Summary Stats: Elapsed time e
    Logical Query Summary Stats: [...] Response time r
    Physical Query Summary Stats:
    [...] DB-connect time d (seconds) r - d - c - max(p)
    e - r
    http://ritt.md/nqquery

    View Slide

  15. T : +44 (0) 1273 911 268 (UK) E : [email protected] W : www.rittmanmead.com
    Usage Tracking’s blind spot
    •Usage Tracking is good, but it omits the Total Elapsed Time
    •This can hide problems:
    •Usage Tracking is great, but do be aware of this potential limitation to your visibility of where
    time has gone.
    Elapsed
    Response
    Send to client, wait for
    acknowledgement
    nqquery.log: Logical Query Summary Stats: [...] Response time r
    Usage Tracking: S_NQ_ACCT.TOTAL_TIME_SEC
    nqquery.log: Logical Query Summary Stats: Elapsed time e
    Usage Tracking: [Not Available]
    uh oh!

    View Slide

  16. T : +44 (0) 1273 911 268 (UK) E : [email protected] W : www.rittmanmead.com
    Request
    Response
    Iterative Approach
    •Be sure to account for all time, end-to-end (nose to tail)
    •Expand time profile to focus on where the time is going in particular
    •In reality, time profile based on BI Server alone will help in a lot of cases
    BI Server
    Managed Server
    Presentation
    Services
    Web Browser BI Plug-in
    User WebLogic Server OBIEE system components
    DWH
    Data Source(s)
    DWH
    Network
    Network
    nqquery.log
    sawlog.log EM Active Reports, V$SQL, etc
    Browser tools WLS logs

    View Slide

  17. T : +44 (0) 1273 911 268 (UK) E : [email protected] W : www.rittmanmead.com
    Digging Deeper with DMS Metrics
    •OBIEE supports Fusion Middleware’s Dynamic Monitoring System (DMS)
    •Once we have found WHERE the time has gone, DMS metrics are one
    way to help us find out WHY
    •Hundreds of low-level metrics, ranging from the obvious 

    (BI Server Total Sessions) 

    to the less obvious (Peak_DXEParameterizedImpl_Count)

    View Slide

  18. T : +44 (0) 1273 911 268 (UK) E : [email protected] W : www.rittmanmead.com
    Accessing DMS Metrics
    •DMS Spy
    •opmn
    •EM FMC
    •EM12c
    •obi-metrics-agent 

    + graphite 

    + grafana
    http://ritt.md/oma-intro

    View Slide

  19. T : +44 (0) 1273 911 268 (UK) E : [email protected] W : www.rittmanmead.com
    Response time
    Number of concurrent users
    •Performance: Response time is slow for one user
    •Capacity: Response time degrades as user concurrency increases
    •Fix Performance problems at root cause; adding capacity alone is generally not sensible
    •Improve the performance of an underlying Capacity problem and you might offset the need to add
    any additional capacity at all.
    Is your problem Performance or Capacity?
    Bad
    Good

    View Slide

  20. T : +44 (0) 1273 911 268 (UK) E : [email protected] W : www.rittmanmead.com
    Performance Diagnostics Approach
    •Performance
    ‣Build a time profile
    ‣Don’t know where to start? Try Usage Tracking or nqquery.log
    -Long running queries
    -Logical queries returning lots of data to the client
    -Logical queries returning lots of data from the DB but small % to the client
    -Logical queries requiring lots of physical queries
    •Capacity
    ‣Examine capacity metrics (OS, DMS) over time
    ‣Correlate with reported problems
    Queuing DMS metrics:
    Oracle BI DB Connection Pool/* -> Current Queued Requests
    Oracle BI PS Chart Engine -> Current Charts Queued
    Oracle BI PS Query Cache -> Current Queued Queries
    Oracle BI PS Thread Pools/* -> Current Jobs Queued
    Oracle BI Thread Pool/* -> Current Queued Requests

    View Slide

  21. T : +44 (0) 1273 911 268 (UK) E : [email protected] W : www.rittmanmead.com
    So What Does “Good” Look Like?

    View Slide

  22. T : +44 (0) 1273 911 268 (UK) E : [email protected] W : www.rittmanmead.com
    This Is Not “Best Practice”
    •There is no one right way : It Depends
    The only “best practice” you should be using all the
    time is “Use Your Brain”.
    — Steven Robbins / Tom Kyte

    View Slide

  23. T : +44 (0) 1273 911 268 (UK) E : [email protected] W : www.rittmanmead.com
    The Bucket List of Performance Gains
    ★ Don’t Do It
    ★ Do It Only Once
    ★ Do It Less Often
    ★ Do It More Efficiently
    (h/t Greg Rahn)

    View Slide

  24. T : +44 (0) 1273 911 268 (UK) E : [email protected] W : www.rittmanmead.com
    ‘Database Pushdown’ (Do It More Efficiently)
    •Reduce the amount of work/data handled further up the stack
    •Federation across sources can be a challenge
    ‣c.f. BI Server caching
    BI Server
    Managed Server
    Presentation Services
    Web Browser
    BI Plug-in
    DWH
    [ ... ]
    User WebLogic Server OBIEE system components Data Source(s)
    Network
    Network

    View Slide

  25. T : +44 (0) 1273 911 268 (UK) E : [email protected] W : www.rittmanmead.com
    Feeding the Excel Monster (Don’t Do It/Do It More Efficiently)
    •What’s being done with the data once it’s in Excel?
    ‣Could it be done in OBIEE instead?
    •Alternatives to Export from Analysis/Dashboard:
    ‣Oracle have specific recommendations (DocID
    1558070.1 p.13)
    -Favour CSV export over Excel
    -Favour BI Publisher export over OBIEE Analysis Export
    ‣Use Logical SQL against BI Server’s ODBC/JDBC
    interface directly
    ‣Dump direct from the database

    View Slide

  26. T : +44 (0) 1273 911 268 (UK) E : [email protected] W : www.rittmanmead.com
    Don’t Do It / Do It Less Often
    •“Filter Early”
    •Table Prompt != Filter

    •Report by Exception
    •Make sure Dashboards have 

    default/mandatory prompts

    (http://ritt.md/obi-prompts)
    Yes, please
    do….
    •Be smart about Dashboard and Analysis design - don’t cram everything into one page
    •Less clutter : Better user experience & Better performance

    View Slide

  27. T : +44 (0) 1273 911 268 (UK) E : [email protected] W : www.rittmanmead.com
    Not forgetting …
    •Do It More Efficiently
    ‣Aggregation

    •Do It Less Often
    ‣BI Server caching
    •Database optimisation (partitioning, indexing, parallelism, statistics, etc)

    •Balanced Hardware configuration

    View Slide

  28. T : +44 (0) 1273 911 268 (UK) E : [email protected] W : www.rittmanmead.com
    OBIEE Performance in the Real World
    •Do It Right, First Time
    •Methodical analysis - “nose to tail”
    EVIDENCE-BASED 

    DESIGN AND DIAGNOSTICS

    View Slide

  29. T : +44 (0) 1273 911 268 (UK) E : [email protected] W : www.rittmanmead.com
    #EOF
    ✴email: [email protected]
    ✴web: http://ritt.md/rmoff
    ✴twitter: @rmoff
    ✴IRC: rmoff / #obihackers / freenode

    View Slide

  30. T : +44 (0) 1273 911 268 (UK) E : [email protected] W : www.rittmanmead.com
    References & Further Reading
    •Cary Millsap - “Thinking Clearly About Performance”
    ‣http://queue.acm.org/detail.cfm?id=1854041

    •Blog series: OBIEE and Performance
    ‣http://ritt.md/obiee-performance

    •obi-metrics-agent
    ‣http://ritt.md/oma-intro

    •Greg Rahn - “The Core Performance Fundamentals Of Oracle Data Warehousing – Balanced
    Hardware Configuration”
    ‣http://wp.me/p3cJT-by

    •Oracle documentation - “Oracle® Database 2 Day + Data Warehousing Guide - Balanced Hardware Configuration”
    ‣E25555-03

    View Slide

  31. T : +44 (0) 1273 911 268 (UK) E : [email protected] W : www.rittmanmead.com
    No Silver Bullets : OBIEE Performance
    in the Real World

    Robin Moffatt, Principal Consultant
    Rittman Mead
    Riga Dev Day, 22 January 2015

    View Slide