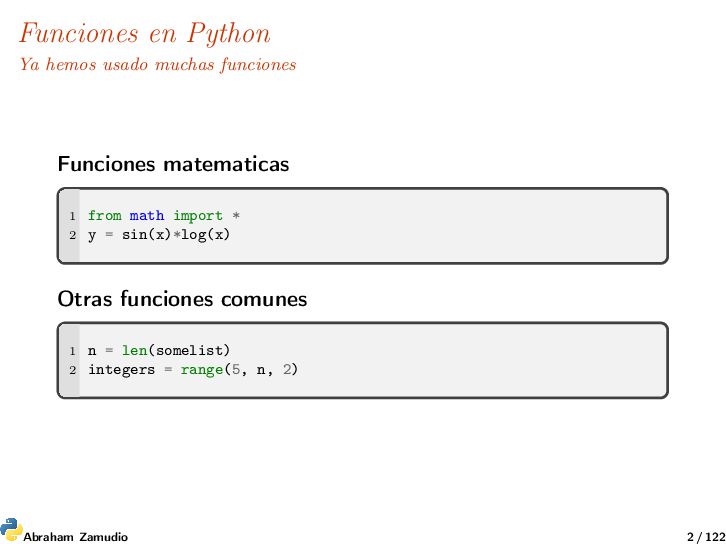
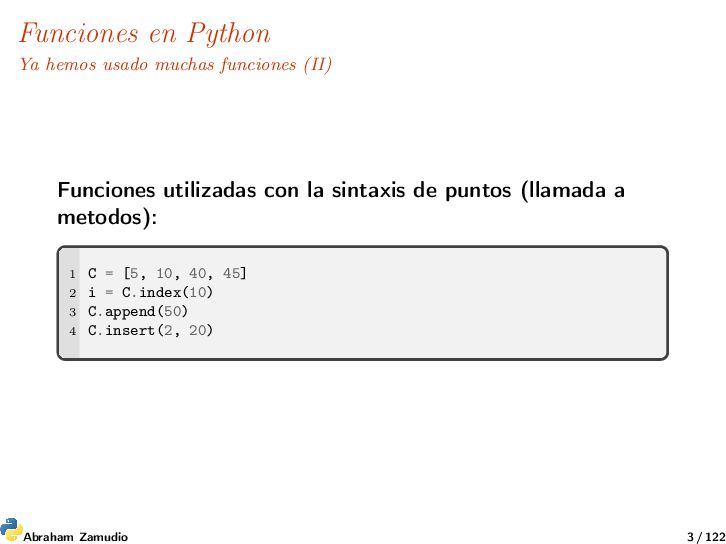
utilizadas con la sintaxis de puntos (llamada a metodos): 1 C = [5, 10, 40, 45] 2 i = C.index(10) 3 C.append(50) 4 C.insert(2, 20) Abraham Zamudio 3 / 122
el termino función significa mas que solo una función matemática. Una función es una colección de sentencias que puedes ejecutar donde y cuando quieras en el programa. Una función puede to- mar objetos de entrada (argumentos) y producir objetos de salida (retorna resultados) .Las funciones ayudan a organizar los progra- mas, los hacen más comprensibles, más cortos, las funciones son reutilizables y más fácil de extender. Def. de función Def. de función Abraham Zamudio 4 / 122
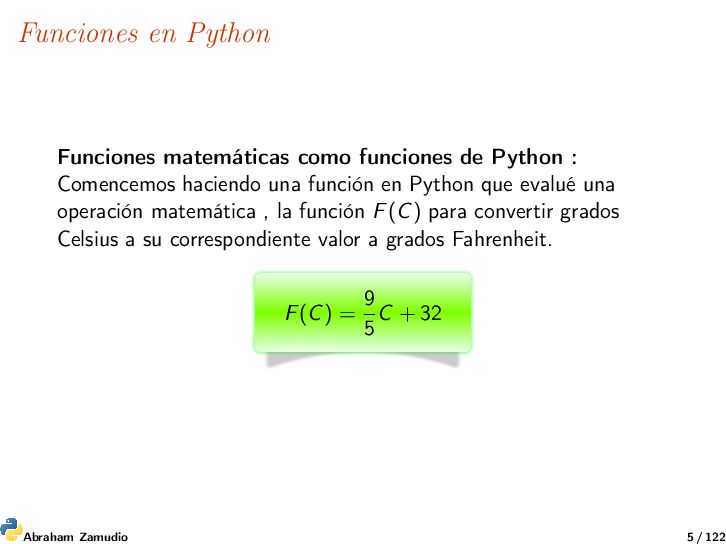
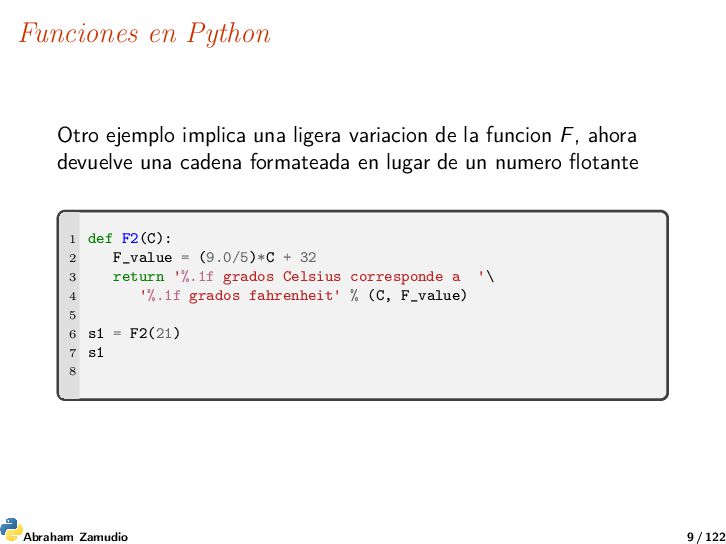
Comencemos haciendo una función en Python que evalué una operación matemática , la función F(C) para convertir grados Celsius a su correspondiente valor a grados Fahrenheit. F(C) = 9 5 C + 32 Abraham Zamudio 5 / 122
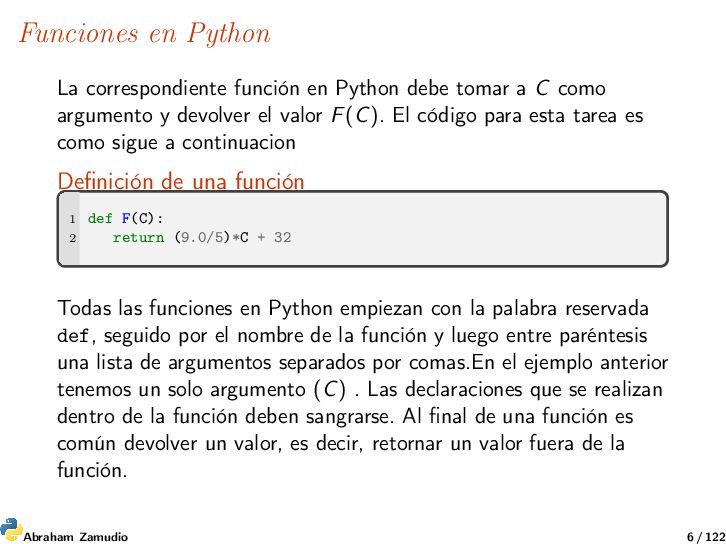
a C como argumento y devolver el valor F(C). El código para esta tarea es como sigue a continuacion Definición de una función 1 def F(C): 2 return (9.0/5)*C + 32 Todas las funciones en Python empiezan con la palabra reservada def, seguido por el nombre de la función y luego entre paréntesis una lista de argumentos separados por comas.En el ejemplo anterior tenemos un solo argumento (C) . Las declaraciones que se realizan dentro de la función deben sangrarse. Al final de una función es común devolver un valor, es decir, retornar un valor fuera de la función. Abraham Zamudio 6 / 122
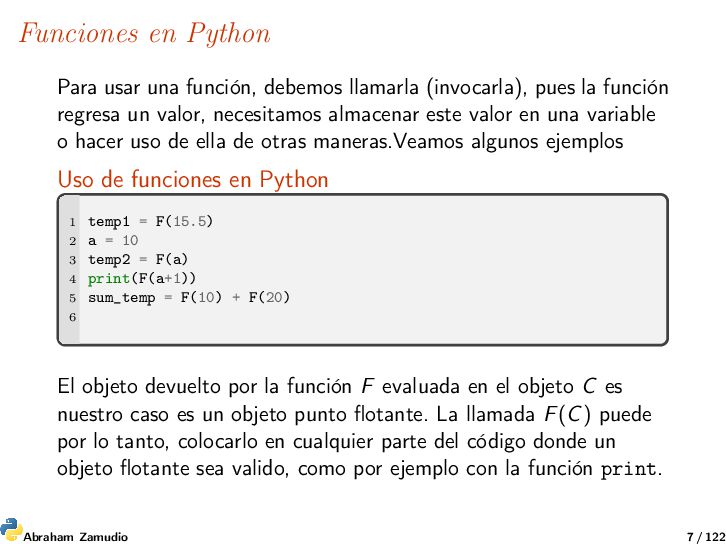
pues la función regresa un valor, necesitamos almacenar este valor en una variable o hacer uso de ella de otras maneras.Veamos algunos ejemplos Uso de funciones en Python 1 temp1 = F(15.5) 2 a = 10 3 temp2 = F(a) 4 print(F(a+1)) 5 sum_temp = F(10) + F(20) 6 El objeto devuelto por la función F evaluada en el objeto C es nuestro caso es un objeto punto flotante. La llamada F(C) puede por lo tanto, colocarlo en cualquier parte del código donde un objeto flotante sea valido, como por ejemplo con la función print. Abraham Zamudio 7 / 122
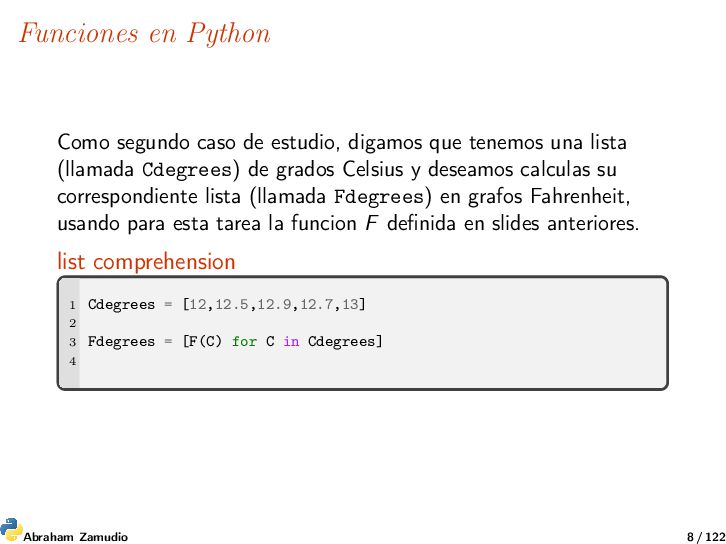
tenemos una lista (llamada Cdegrees) de grados Celsius y deseamos calculas su correspondiente lista (llamada Fdegrees) en grafos Fahrenheit, usando para esta tarea la funcion F definida en slides anteriores. list comprehension 1 Cdegrees = [12,12.5,12.9,12.7,13] 2 3 Fdegrees = [F(C) for C in Cdegrees] 4 Abraham Zamudio 8 / 122
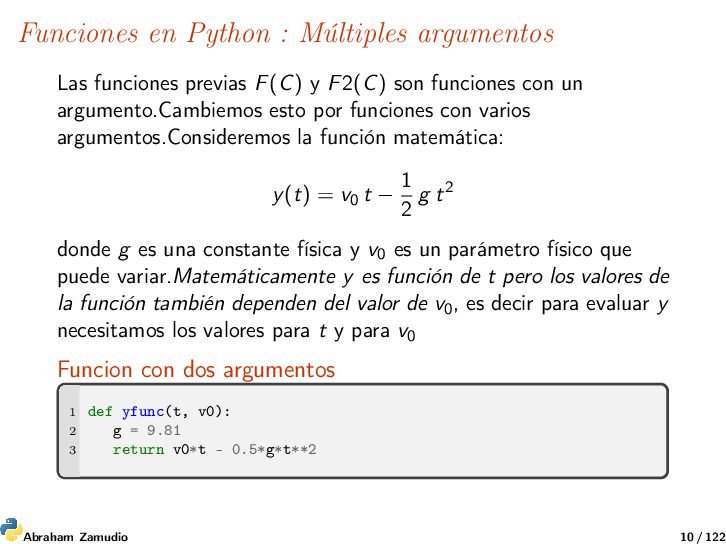
y F2(C) son funciones con un argumento.Cambiemos esto por funciones con varios argumentos.Consideremos la función matemática: y(t) = v0 t − 1 2 g t2 donde g es una constante física y v0 es un parámetro físico que puede variar.Matemáticamente y es función de t pero los valores de la función también dependen del valor de v0, es decir para evaluar y necesitamos los valores para t y para v0 Funcion con dos argumentos 1 def yfunc(t, v0): 2 g = 9.81 3 return v0*t - 0.5*g*t**2 Abraham Zamudio 10 / 122
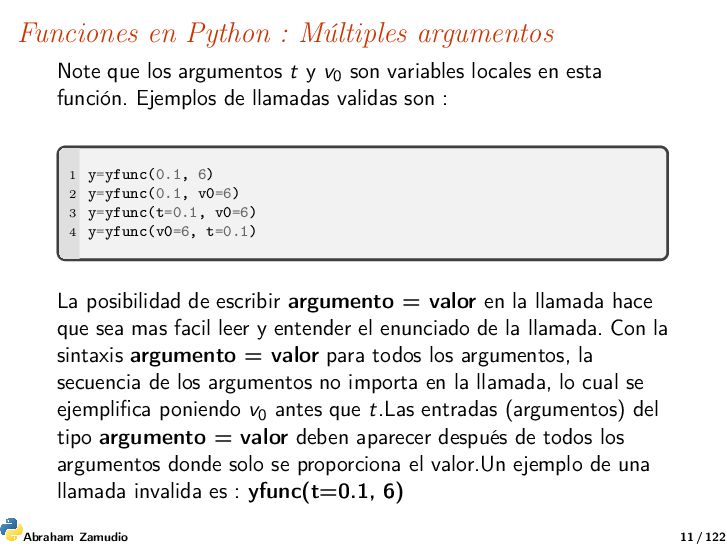
t y v0 son variables locales en esta función. Ejemplos de llamadas validas son : 1 y=yfunc(0.1, 6) 2 y=yfunc(0.1, v0=6) 3 y=yfunc(t=0.1, v0=6) 4 y=yfunc(v0=6, t=0.1) La posibilidad de escribir argumento = valor en la llamada hace que sea mas facil leer y entender el enunciado de la llamada. Con la sintaxis argumento = valor para todos los argumentos, la secuencia de los argumentos no importa en la llamada, lo cual se ejemplifica poniendo v0 antes que t.Las entradas (argumentos) del tipo argumento = valor deben aparecer después de todos los argumentos donde solo se proporciona el valor.Un ejemplo de una llamada invalida es : yfunc(t=0.1, 6) Abraham Zamudio 11 / 122
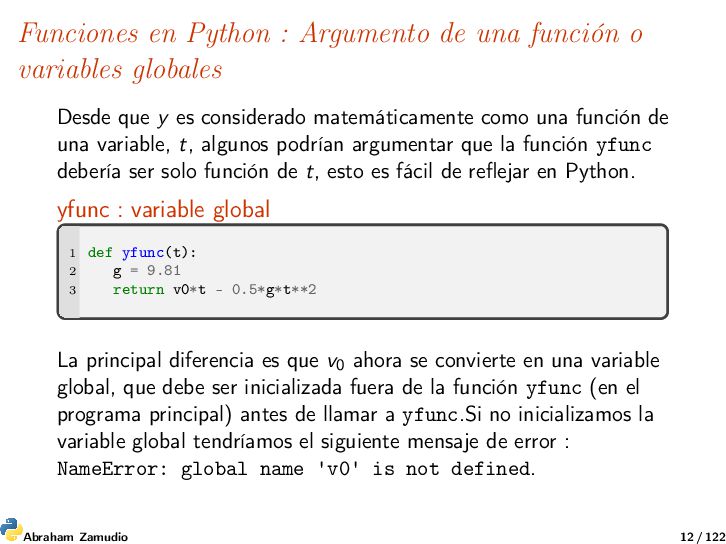
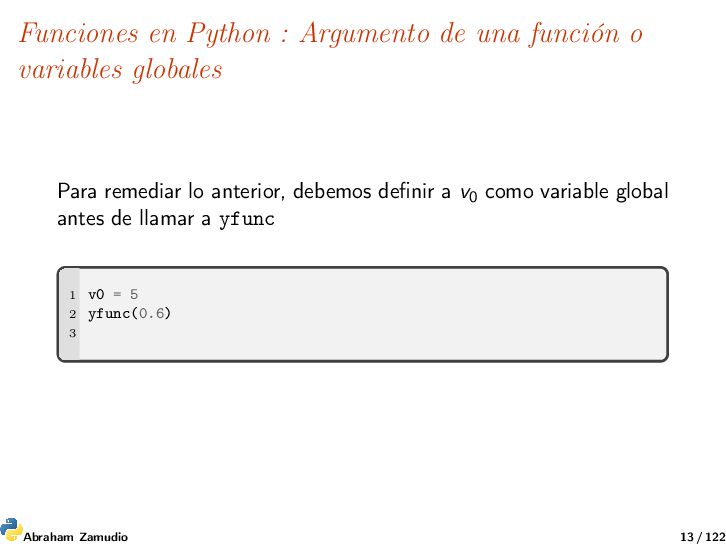
globales Desde que y es considerado matemáticamente como una función de una variable, t, algunos podrían argumentar que la función yfunc debería ser solo función de t, esto es fácil de reflejar en Python. yfunc : variable global 1 def yfunc(t): 2 g = 9.81 3 return v0*t - 0.5*g*t**2 La principal diferencia es que v0 ahora se convierte en una variable global, que debe ser inicializada fuera de la función yfunc (en el programa principal) antes de llamar a yfunc.Si no inicializamos la variable global tendríamos el siguiente mensaje de error : NameError: global name 'v0' is not defined. Abraham Zamudio 12 / 122
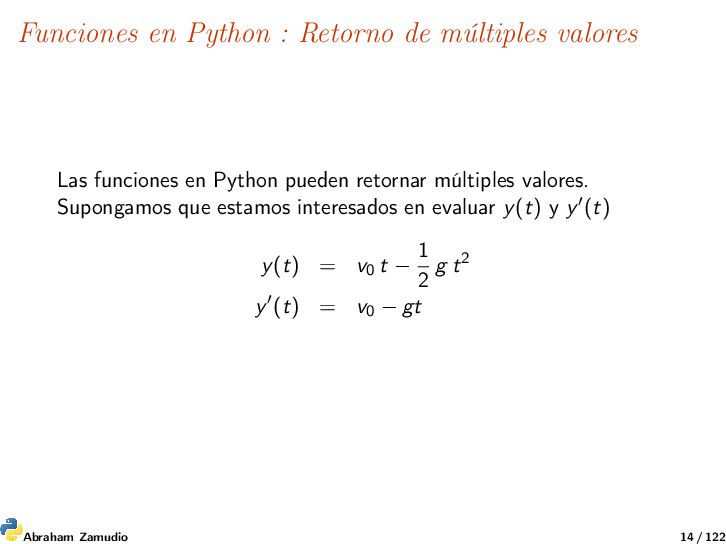
en Python pueden retornar múltiples valores. Supongamos que estamos interesados en evaluar y(t) y y (t) y(t) = v0 t − 1 2 g t2 y (t) = v0 − gt Abraham Zamudio 14 / 122
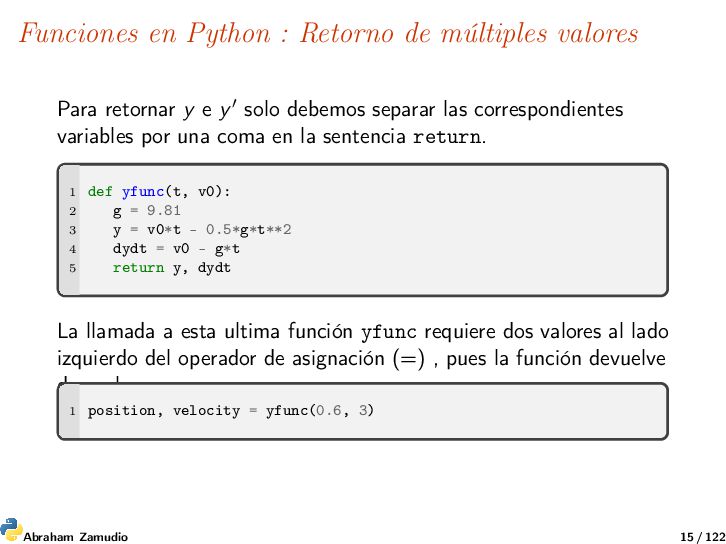
y e y solo debemos separar las correspondientes variables por una coma en la sentencia return. 1 def yfunc(t, v0): 2 g = 9.81 3 y = v0*t - 0.5*g*t**2 4 dydt = v0 - g*t 5 return y, dydt La llamada a esta ultima función yfunc requiere dos valores al lado izquierdo del operador de asignación (=) , pues la función devuelve dos valores. 1 position, velocity = yfunc(0.6, 3) Abraham Zamudio 15 / 122
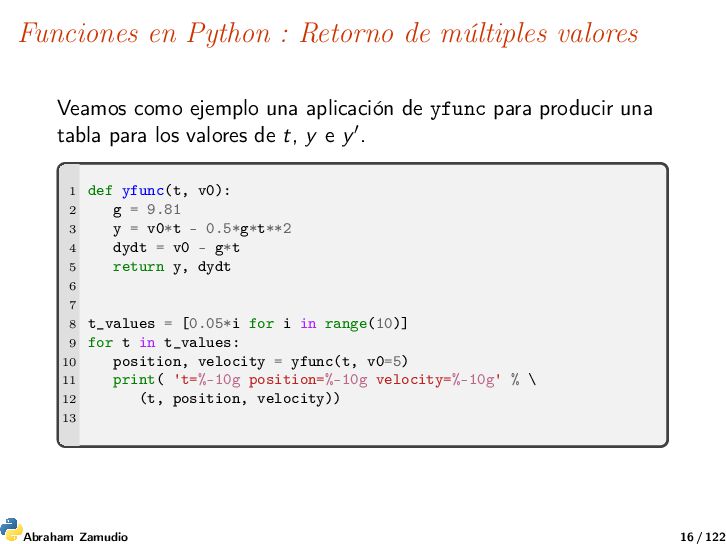
ejemplo una aplicación de yfunc para producir una tabla para los valores de t, y e y . 1 def yfunc(t, v0): 2 g = 9.81 3 y = v0*t - 0.5*g*t**2 4 dydt = v0 - g*t 5 return y, dydt 6 7 8 t_values = [0.05*i for i in range(10)] 9 for t in t_values: 10 position, velocity = yfunc(t, v0=5) 11 print( 't=%-10g position=%-10g velocity=%-10g' % \ 12 (t, position, velocity)) 13 Abraham Zamudio 16 / 122
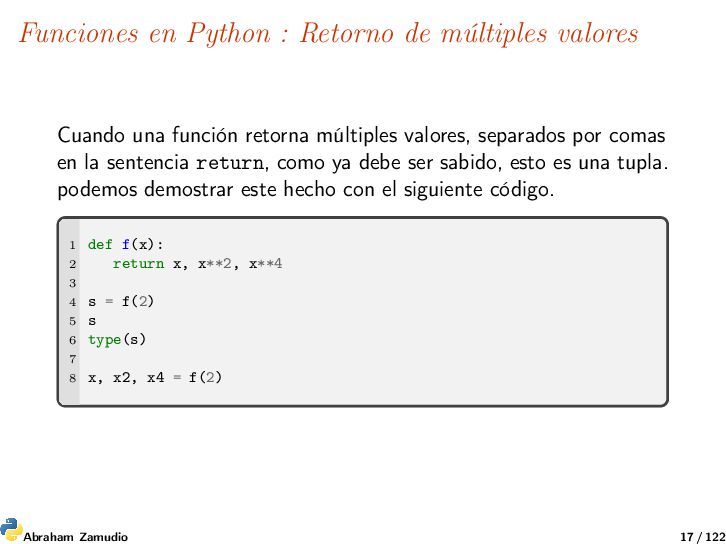
función retorna múltiples valores, separados por comas en la sentencia return, como ya debe ser sabido, esto es una tupla. podemos demostrar este hecho con el siguiente código. 1 def f(x): 2 return x, x**2, x**4 3 4 s = f(2) 5 s 6 type(s) 7 8 x, x2, x4 = f(2) Abraham Zamudio 17 / 122
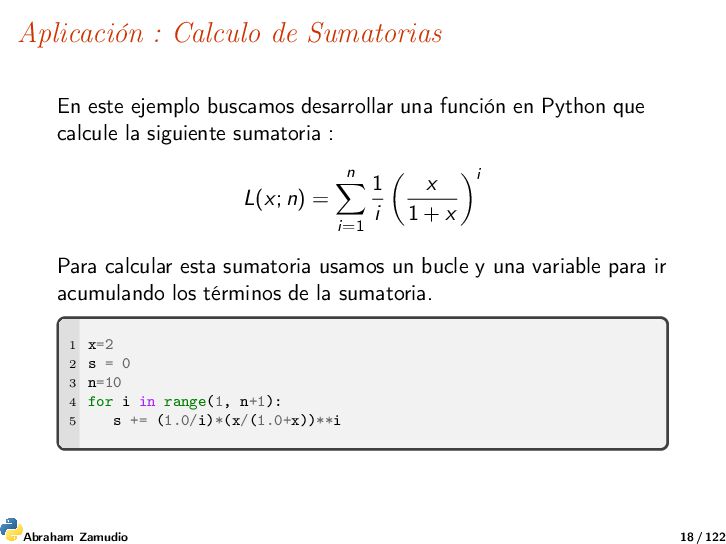
una función en Python que calcule la siguiente sumatoria : L(x; n) = n i=1 1 i x 1 + x i Para calcular esta sumatoria usamos un bucle y una variable para ir acumulando los términos de la sumatoria. 1 x=2 2 s = 0 3 n=10 4 for i in range(1, n+1): 5 s += (1.0/i)*(x/(1.0+x))**i Abraham Zamudio 18 / 122
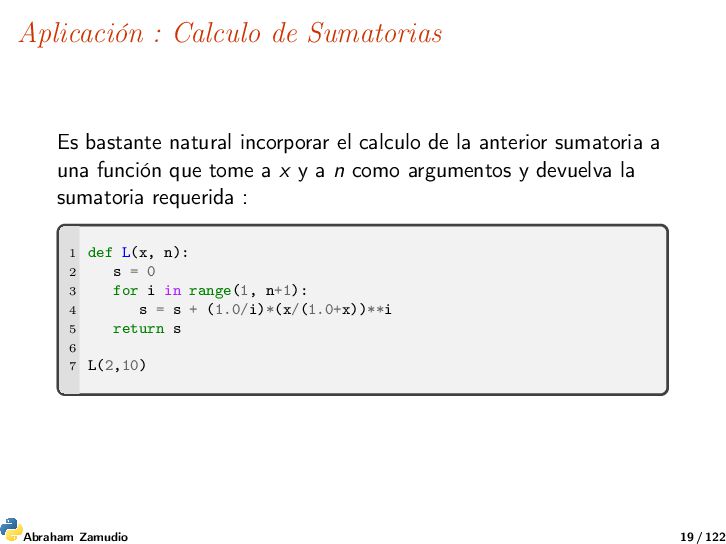
calculo de la anterior sumatoria a una función que tome a x y a n como argumentos y devuelva la sumatoria requerida : 1 def L(x, n): 2 s = 0 3 for i in range(1, n+1): 4 s = s + (1.0/i)*(x/(1.0+x))**i 5 return s 6 7 L(2,10) Abraham Zamudio 19 / 122
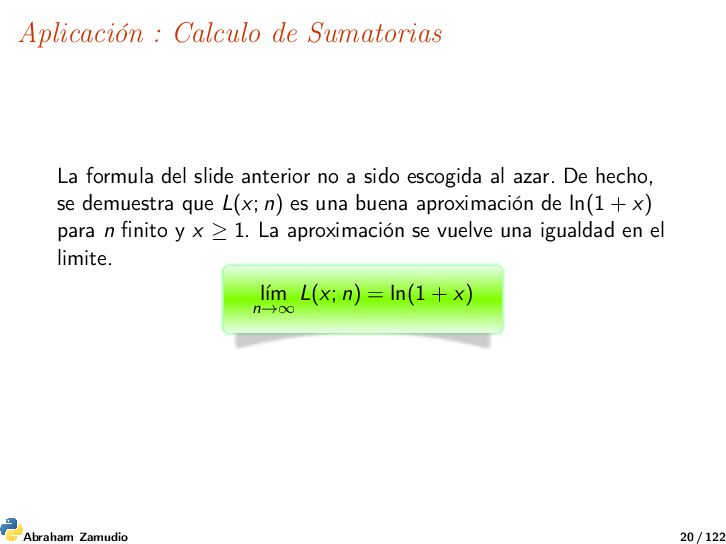
no a sido escogida al azar. De hecho, se demuestra que L(x; n) es una buena aproximación de ln(1 + x) para n finito y x ≥ 1. La aproximación se vuelve una igualdad en el limite. l´ ım n→∞ L(x; n) = ln(1 + x) Abraham Zamudio 20 / 122
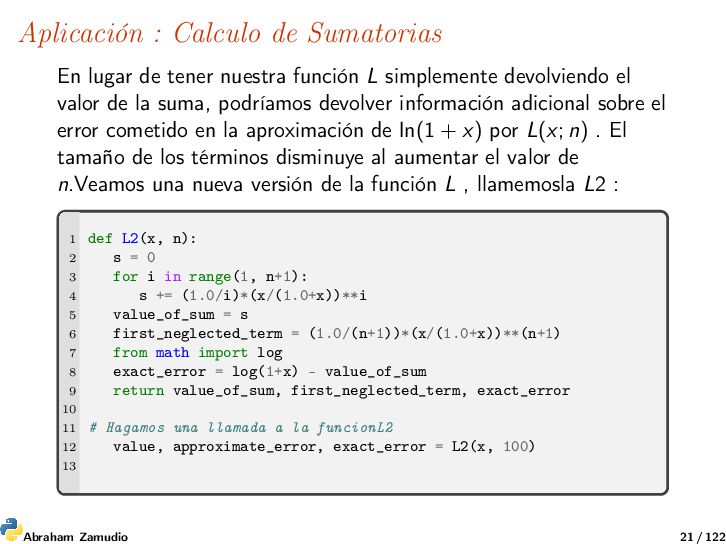
función L simplemente devolviendo el valor de la suma, podríamos devolver información adicional sobre el error cometido en la aproximación de ln(1 + x) por L(x; n) . El tamaño de los términos disminuye al aumentar el valor de n.Veamos una nueva versión de la función L , llamemosla L2 : 1 def L2(x, n): 2 s = 0 3 for i in range(1, n+1): 4 s += (1.0/i)*(x/(1.0+x))**i 5 value_of_sum = s 6 first_neglected_term = (1.0/(n+1))*(x/(1.0+x))**(n+1) 7 from math import log 8 exact_error = log(1+x) - value_of_sum 9 return value_of_sum, first_neglected_term, exact_error 10 11 # Hagamos una llamada a la funcionL2 12 value, approximate_error, exact_error = L2(x, 100) 13 Abraham Zamudio 21 / 122
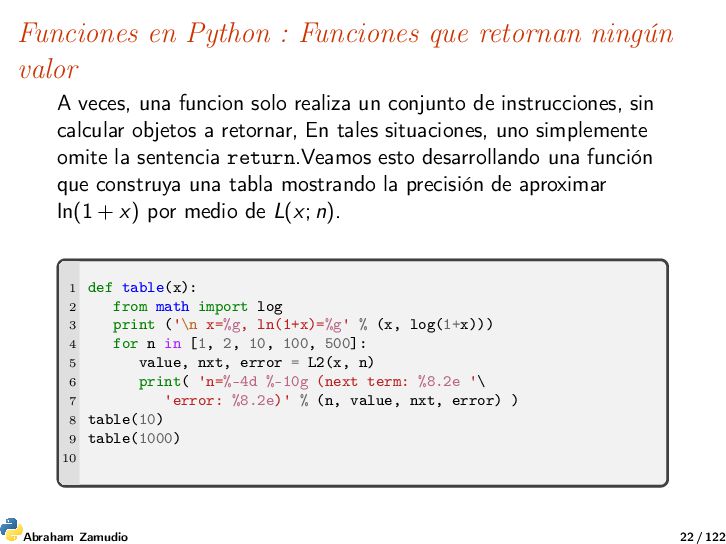
veces, una funcion solo realiza un conjunto de instrucciones, sin calcular objetos a retornar, En tales situaciones, uno simplemente omite la sentencia return.Veamos esto desarrollando una función que construya una tabla mostrando la precisión de aproximar ln(1 + x) por medio de L(x; n). 1 def table(x): 2 from math import log 3 print ('\n x=%g, ln(1+x)=%g' % (x, log(1+x))) 4 for n in [1, 2, 10, 100, 500]: 5 value, nxt, error = L2(x, n) 6 print( 'n=%-4d %-10g (next term: %8.2e '\ 7 'error: %8.2e)' % (n, value, nxt, error) ) 8 table(10) 9 table(1000) 10 Abraham Zamudio 22 / 122
con mucha frecuencia necesitan tener funciones como argumentos. Por ejemplo , se necesita una función matemática f (x) necesaria para funciones en Python para: 1. Búsqueda numérica de raíces 2. Diferenciación numérica 3. Integración numérica 4. solución numérica de EDO 5. ... entre muchas otras En las funciones de Python necesitamos tener funciones f como argumentos. Abraham Zamudio 23 / 122
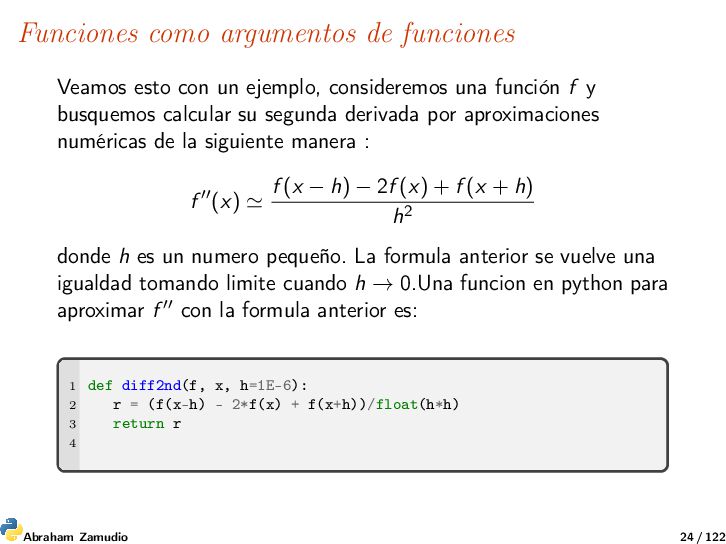
consideremos una función f y busquemos calcular su segunda derivada por aproximaciones numéricas de la siguiente manera : f (x) f (x − h) − 2f (x) + f (x + h) h2 donde h es un numero pequeño. La formula anterior se vuelve una igualdad tomando limite cuando h → 0.Una funcion en python para aproximar f con la formula anterior es: 1 def diff2nd(f, x, h=1E-6): 2 r = (f(x-h) - 2*f(x) + f(x+h))/float(h*h) 3 return r 4 Abraham Zamudio 24 / 122
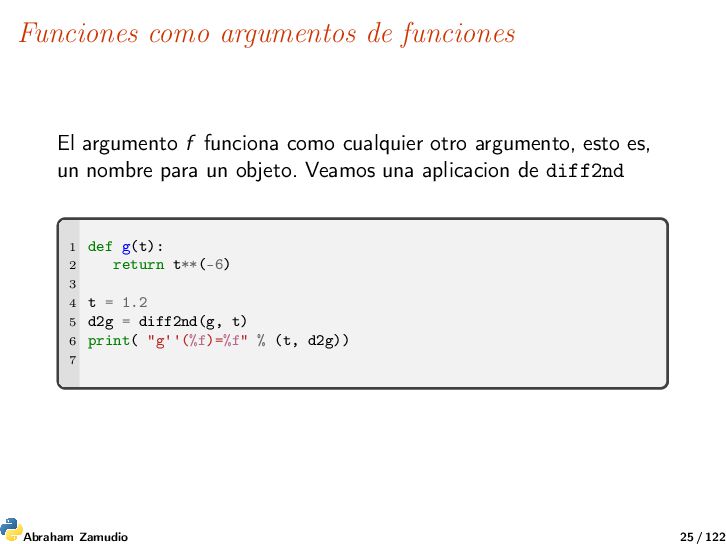
cualquier otro argumento, esto es, un nombre para un objeto. Veamos una aplicacion de diff2nd 1 def g(t): 2 return t**(-6) 3 4 t = 1.2 5 d2g = diff2nd(g, t) 6 print( "g''(%f)=%f" % (t, d2g)) 7 Abraham Zamudio 25 / 122
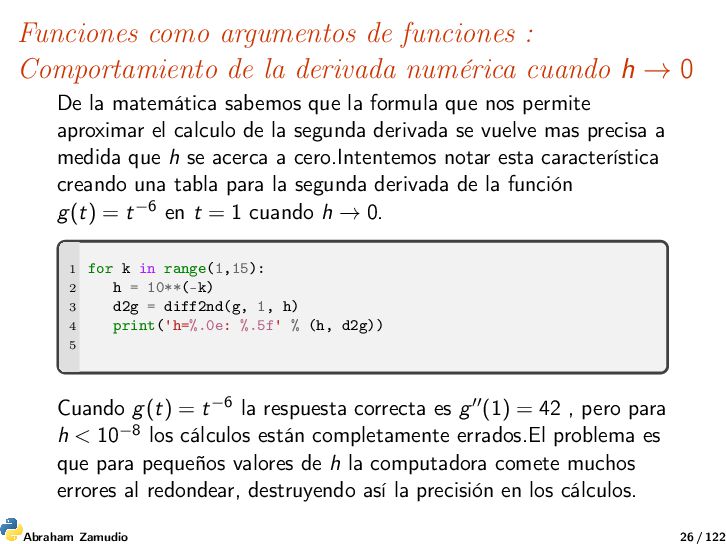
numérica cuando h → 0 De la matemática sabemos que la formula que nos permite aproximar el calculo de la segunda derivada se vuelve mas precisa a medida que h se acerca a cero.Intentemos notar esta característica creando una tabla para la segunda derivada de la función g(t) = t−6 en t = 1 cuando h → 0. 1 for k in range(1,15): 2 h = 10**(-k) 3 d2g = diff2nd(g, 1, h) 4 print('h=%.0e: %.5f' % (h, d2g)) 5 Cuando g(t) = t−6 la respuesta correcta es g (1) = 42 , pero para h < 10−8 los cálculos están completamente errados.El problema es que para pequeños valores de h la computadora comete muchos errores al redondear, destruyendo así la precisión en los cálculos. Abraham Zamudio 26 / 122
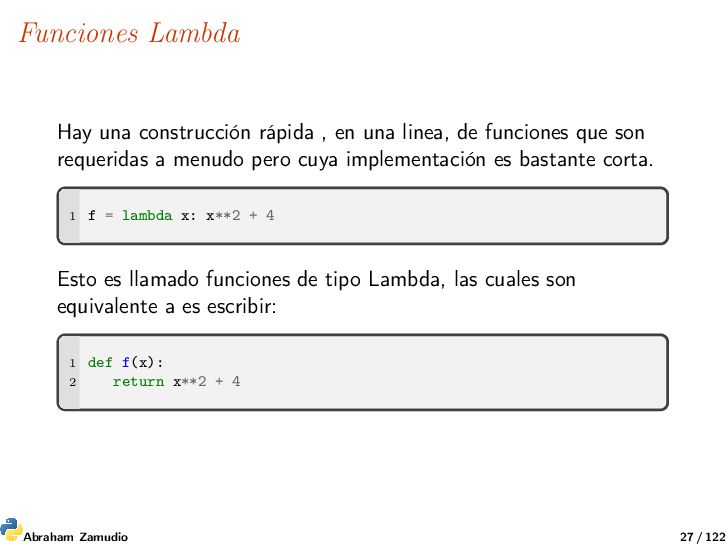
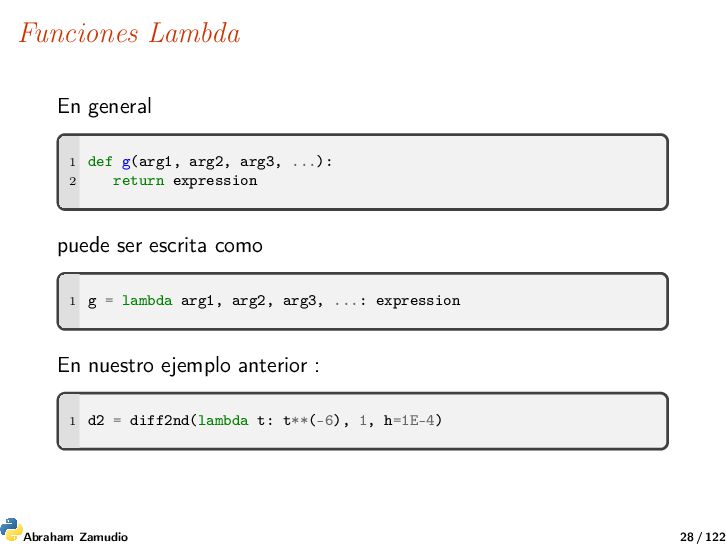
de funciones que son requeridas a menudo pero cuya implementación es bastante corta. 1 f = lambda x: x**2 + 4 Esto es llamado funciones de tipo Lambda, las cuales son equivalente a es escribir: 1 def f(x): 2 return x**2 + 4 Abraham Zamudio 27 / 122
vida es definitivamente digital. El código genético de todos los organismos vivos está representado por una larga secuencia (cadena) de moléculas simples y nucleótidos, o bases, que forman el ácido desoxirribonucleico, más conocido como ADN. Solo hay cuatro de estos nucleótidos, y el código genético completo de un ser humano se puede ver como una simple cadena , aunque de 3 mil millones de caracteres, de las letras A, C, G y T. Analizar datos de ADN para obtener un mayor entendimiento biológico es mucho más que buscar en cadenas largas ciertos patrones de cadenas que involucran las letras A, C, G y T. Esta es una parte integral de la bioinformática, una disciplina científica que trata el uso de computadoras para buscar, explorar y usar información sobre genes, ácidos nucleicos y proteínas. Abraham Zamudio 29 / 122
una secuencia de ADN que contiene las letras A, C, G o T, que representan las bases que conforman el ADN, nos preguntamos: ¿cuántas veces ocurre una cierta base en la cadena de ADN? Por ejemplo, si la cadena de ADN es es ATGGCATTA y preguntamos cuántas veces ocurre la base A en esta cadena, la respuesta es 3. Una implementación general de Python que responde a este problema se puede hacer de muchas maneras. A continuación se presentan varias soluciones posibles. Abraham Zamudio 30 / 122
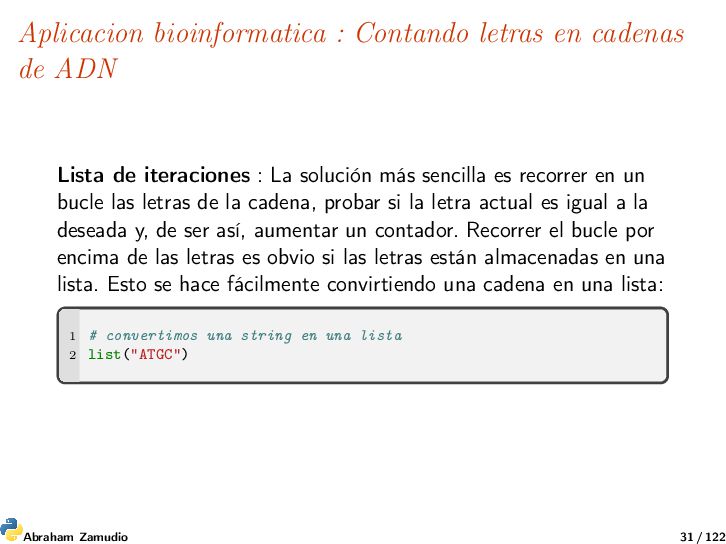
de iteraciones : La solución más sencilla es recorrer en un bucle las letras de la cadena, probar si la letra actual es igual a la deseada y, de ser así, aumentar un contador. Recorrer el bucle por encima de las letras es obvio si las letras están almacenadas en una lista. Esto se hace fácilmente convirtiendo una cadena en una lista: 1 # convertimos una string en una lista 2 list("ATGC") Abraham Zamudio 31 / 122
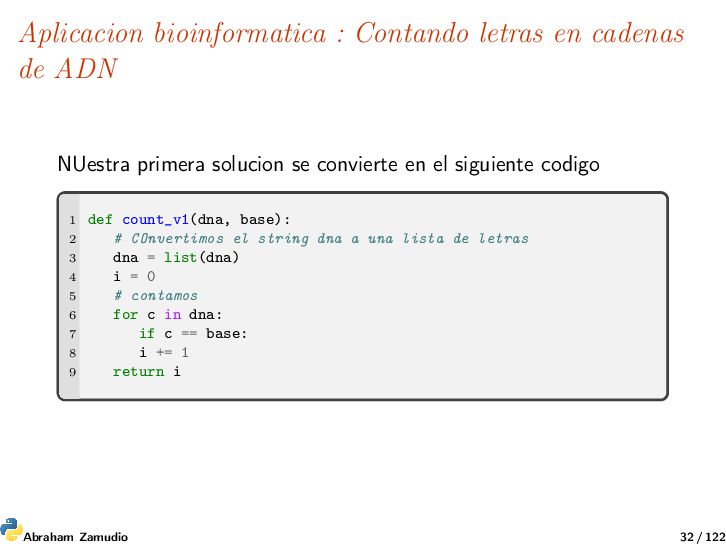
primera solucion se convierte en el siguiente codigo 1 def count_v1(dna, base): 2 # COnvertimos el string dna a una lista de letras 3 dna = list(dna) 4 i = 0 5 # contamos 6 for c in dna: 7 if c == base: 8 i += 1 9 return i Abraham Zamudio 32 / 122
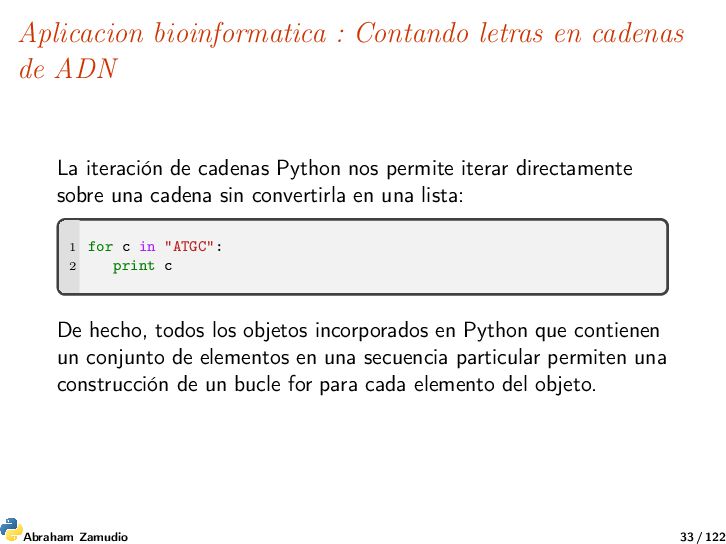
iteración de cadenas Python nos permite iterar directamente sobre una cadena sin convertirla en una lista: 1 for c in "ATGC": 2 print c De hecho, todos los objetos incorporados en Python que contienen un conjunto de elementos en una secuencia particular permiten una construcción de un bucle for para cada elemento del objeto. Abraham Zamudio 33 / 122
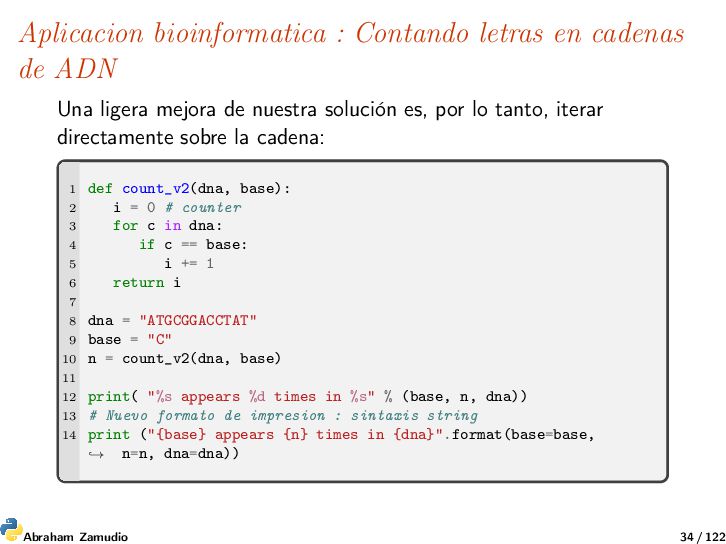
ligera mejora de nuestra solución es, por lo tanto, iterar directamente sobre la cadena: 1 def count_v2(dna, base): 2 i = 0 # counter 3 for c in dna: 4 if c == base: 5 i += 1 6 return i 7 8 dna = "ATGCGGACCTAT" 9 base = "C" 10 n = count_v2(dna, base) 11 12 print( "%s appears %d times in %s" % (base, n, dna)) 13 # Nuevo formato de impresion : sintaxis string 14 print ("{base} appears {n} times in {dna}".format(base=base, n=n, dna=dna)) → Abraham Zamudio 34 / 122
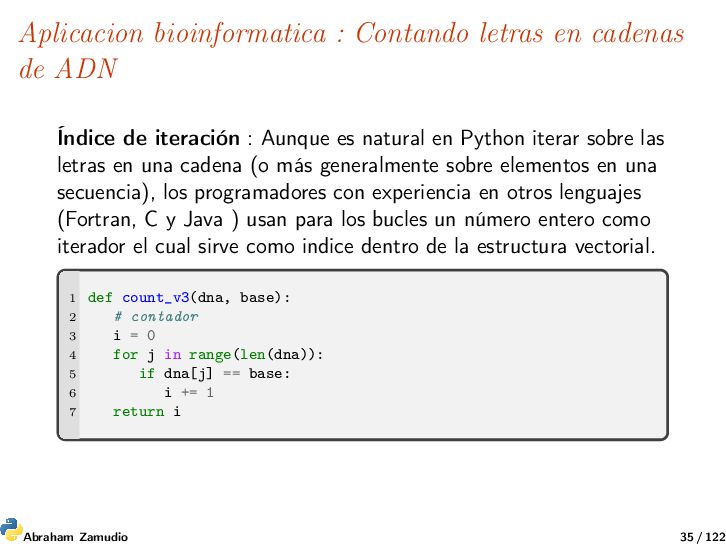
de iteración : Aunque es natural en Python iterar sobre las letras en una cadena (o más generalmente sobre elementos en una secuencia), los programadores con experiencia en otros lenguajes (Fortran, C y Java ) usan para los bucles un número entero como iterador el cual sirve como indice dentro de la estructura vectorial. 1 def count_v3(dna, base): 2 # contador 3 i = 0 4 for j in range(len(dna)): 5 if dna[j] == base: 6 i += 1 7 return i Abraham Zamudio 35 / 122
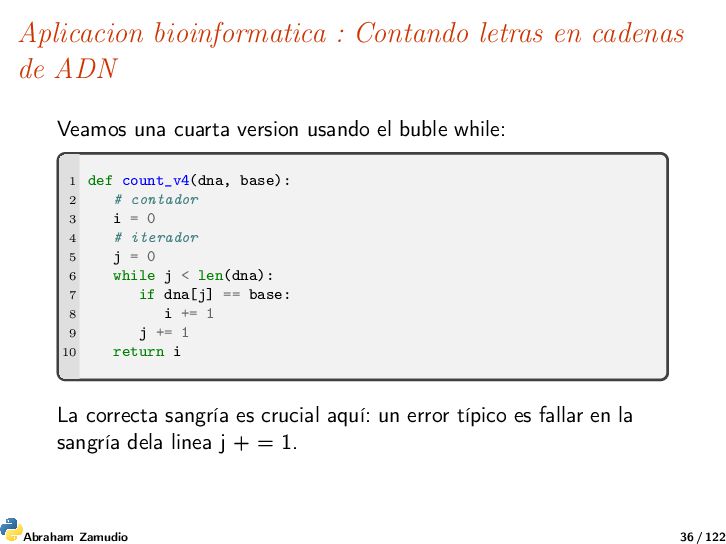
una cuarta version usando el buble while: 1 def count_v4(dna, base): 2 # contador 3 i = 0 4 # iterador 5 j = 0 6 while j < len(dna): 7 if dna[j] == base: 8 i += 1 9 j += 1 10 return i La correcta sangría es crucial aquí: un error típico es fallar en la sangría dela linea j + = 1. Abraham Zamudio 36 / 122
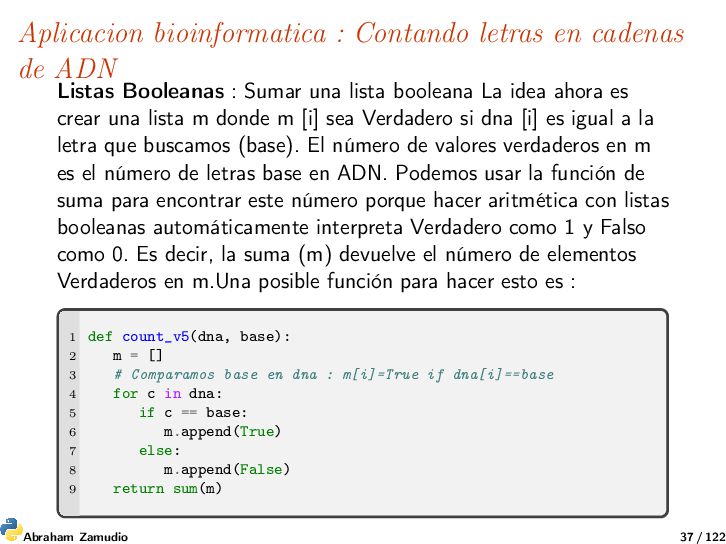
Booleanas : Sumar una lista booleana La idea ahora es crear una lista m donde m [i] sea Verdadero si dna [i] es igual a la letra que buscamos (base). El número de valores verdaderos en m es el número de letras base en ADN. Podemos usar la función de suma para encontrar este número porque hacer aritmética con listas booleanas automáticamente interpreta Verdadero como 1 y Falso como 0. Es decir, la suma (m) devuelve el número de elementos Verdaderos en m.Una posible función para hacer esto es : 1 def count_v5(dna, base): 2 m = [] 3 # Comparamos base en dna : m[i]=True if dna[i]==base 4 for c in dna: 5 if c == base: 6 m.append(True) 7 else: 8 m.append(False) 9 return sum(m) Abraham Zamudio 37 / 122
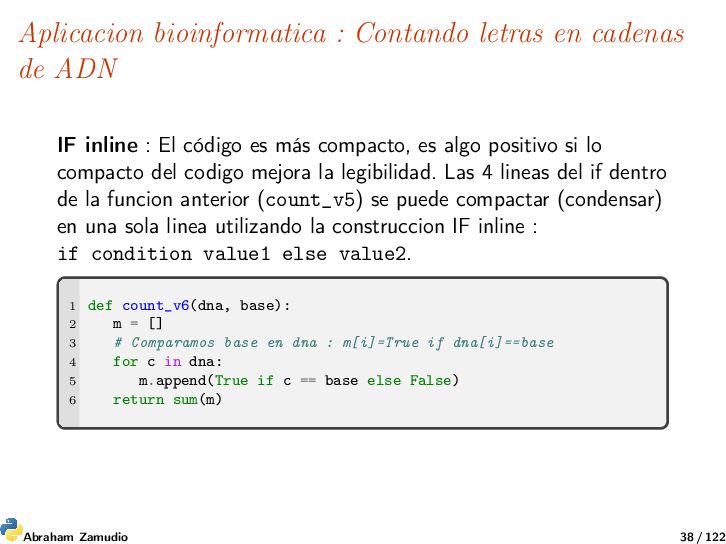
inline : El código es más compacto, es algo positivo si lo compacto del codigo mejora la legibilidad. Las 4 lineas del if dentro de la funcion anterior (count_v5) se puede compactar (condensar) en una sola linea utilizando la construccion IF inline : if condition value1 else value2. 1 def count_v6(dna, base): 2 m = [] 3 # Comparamos base en dna : m[i]=True if dna[i]==base 4 for c in dna: 5 m.append(True if c == base else False) 6 return sum(m) Abraham Zamudio 38 / 122
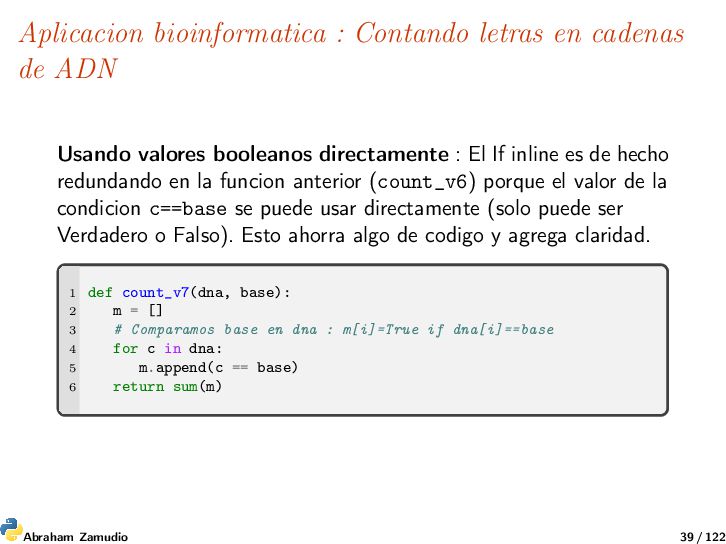
valores booleanos directamente : El If inline es de hecho redundando en la funcion anterior (count_v6) porque el valor de la condicion c==base se puede usar directamente (solo puede ser Verdadero o Falso). Esto ahorra algo de codigo y agrega claridad. 1 def count_v7(dna, base): 2 m = [] 3 # Comparamos base en dna : m[i]=True if dna[i]==base 4 for c in dna: 5 m.append(c == base) 6 return sum(m) Abraham Zamudio 39 / 122
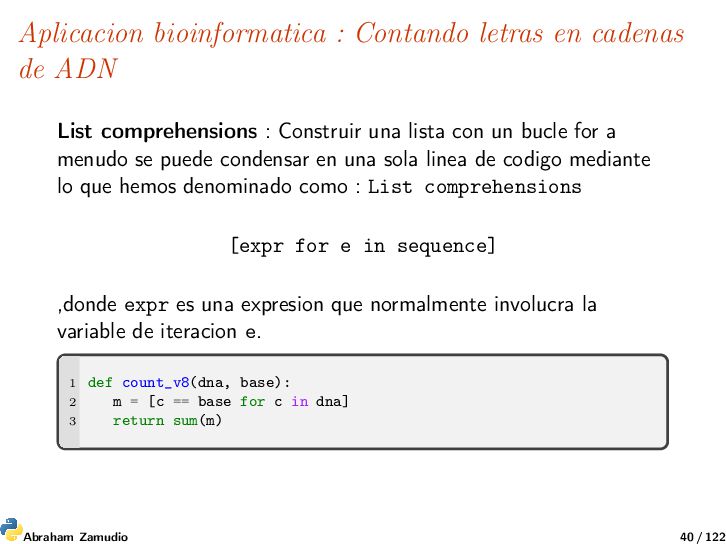
comprehensions : Construir una lista con un bucle for a menudo se puede condensar en una sola linea de codigo mediante lo que hemos denominado como : List comprehensions [expr for e in sequence] ,donde expr es una expresion que normalmente involucra la variable de iteracion e. 1 def count_v8(dna, base): 2 m = [c == base for c in dna] 3 return sum(m) Abraham Zamudio 40 / 122
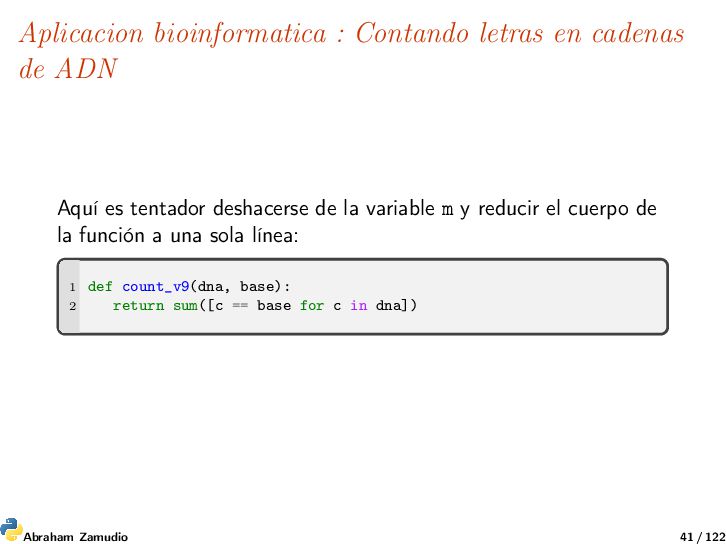
es tentador deshacerse de la variable m y reducir el cuerpo de la función a una sola línea: 1 def count_v9(dna, base): 2 return sum([c == base for c in dna]) Abraham Zamudio 41 / 122
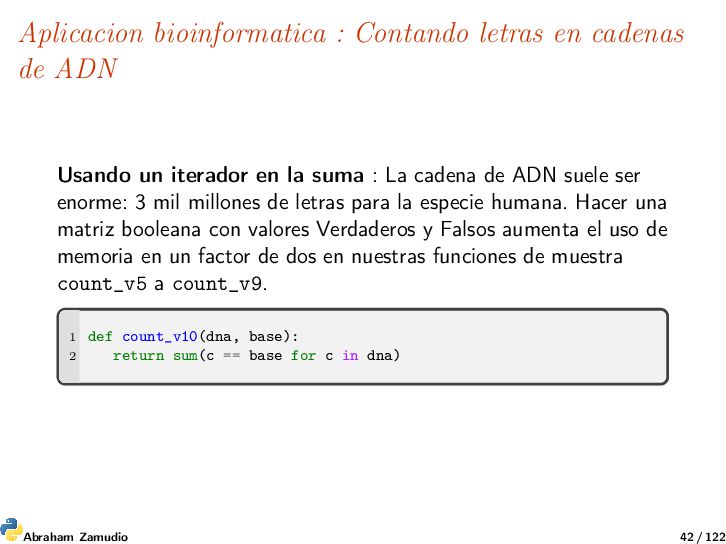
un iterador en la suma : La cadena de ADN suele ser enorme: 3 mil millones de letras para la especie humana. Hacer una matriz booleana con valores Verdaderos y Falsos aumenta el uso de memoria en un factor de dos en nuestras funciones de muestra count_v5 a count_v9. 1 def count_v10(dna, base): 2 return sum(c == base for c in dna) Abraham Zamudio 42 / 122
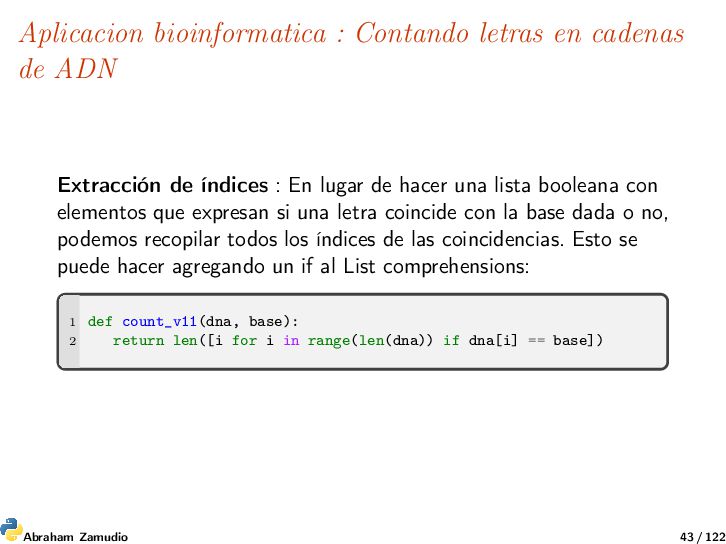
de índices : En lugar de hacer una lista booleana con elementos que expresan si una letra coincide con la base dada o no, podemos recopilar todos los índices de las coincidencias. Esto se puede hacer agregando un if al List comprehensions: 1 def count_v11(dna, base): 2 return len([i for i in range(len(dna)) if dna[i] == base]) Abraham Zamudio 43 / 122
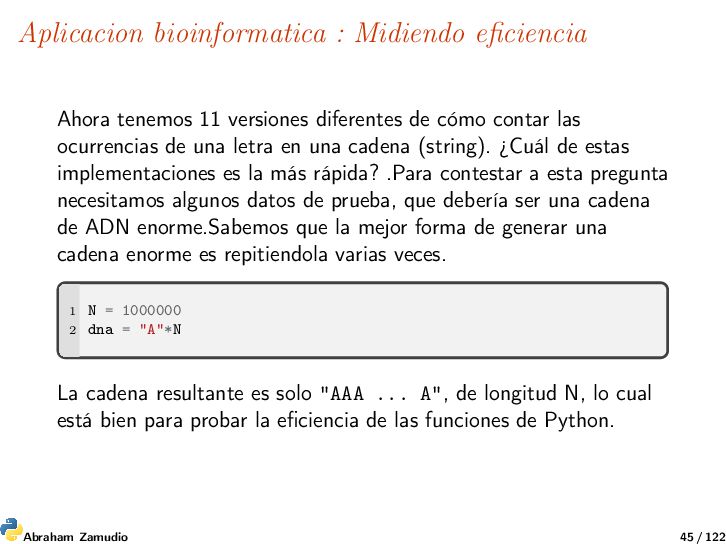
de cómo contar las ocurrencias de una letra en una cadena (string). ¿Cuál de estas implementaciones es la más rápida? .Para contestar a esta pregunta necesitamos algunos datos de prueba, que debería ser una cadena de ADN enorme.Sabemos que la mejor forma de generar una cadena enorme es repitiendola varias veces. 1 N = 1000000 2 dna = "A"*N La cadena resultante es solo "AAA ... A", de longitud N, lo cual está bien para probar la eficiencia de las funciones de Python. Abraham Zamudio 45 / 122
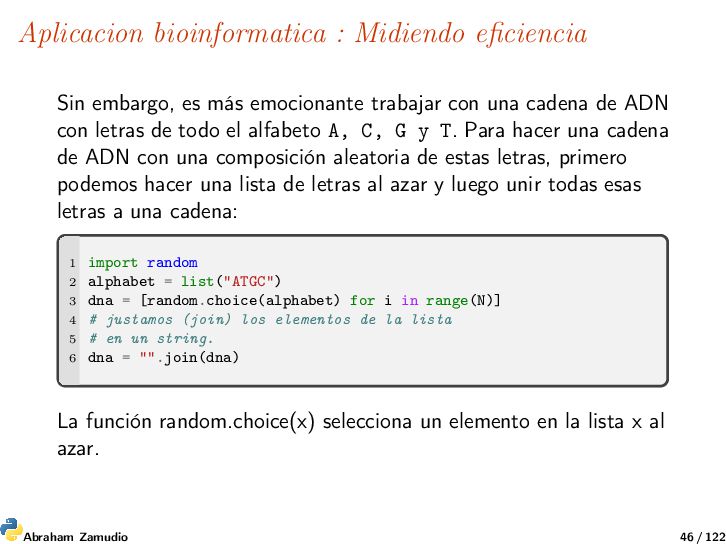
trabajar con una cadena de ADN con letras de todo el alfabeto A, C, G y T. Para hacer una cadena de ADN con una composición aleatoria de estas letras, primero podemos hacer una lista de letras al azar y luego unir todas esas letras a una cadena: 1 import random 2 alphabet = list("ATGC") 3 dna = [random.choice(alphabet) for i in range(N)] 4 # justamos (join) los elementos de la lista 5 # en un string. 6 dna = "".join(dna) La función random.choice(x) selecciona un elemento en la lista x al azar. Abraham Zamudio 46 / 122
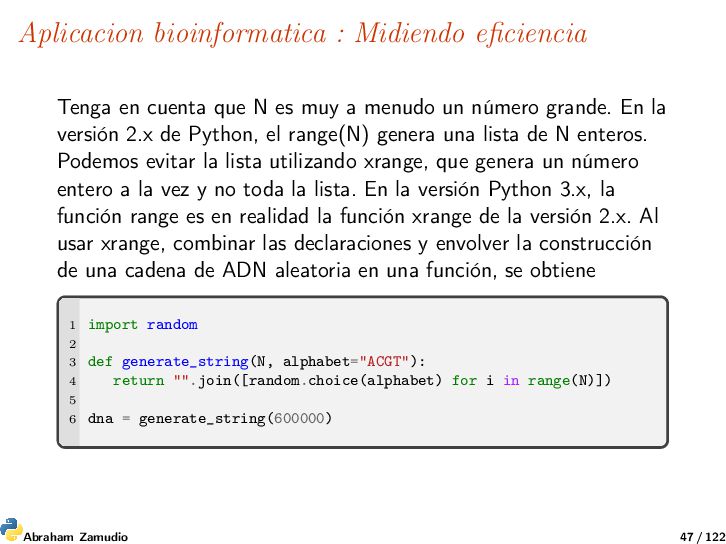
es muy a menudo un número grande. En la versión 2.x de Python, el range(N) genera una lista de N enteros. Podemos evitar la lista utilizando xrange, que genera un número entero a la vez y no toda la lista. En la versión Python 3.x, la función range es en realidad la función xrange de la versión 2.x. Al usar xrange, combinar las declaraciones y envolver la construcción de una cadena de ADN aleatoria en una función, se obtiene 1 import random 2 3 def generate_string(N, alphabet="ACGT"): 4 return "".join([random.choice(alphabet) for i in range(N)]) 5 6 dna = generate_string(600000) Abraham Zamudio 47 / 122
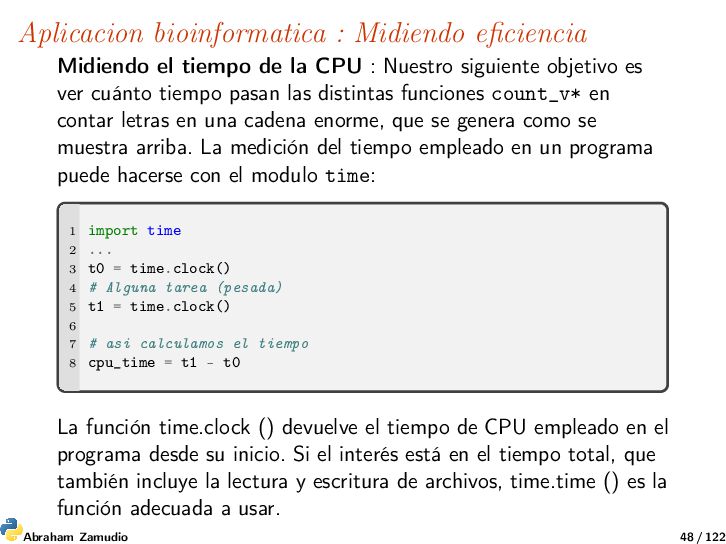
CPU : Nuestro siguiente objetivo es ver cuánto tiempo pasan las distintas funciones count_v* en contar letras en una cadena enorme, que se genera como se muestra arriba. La medición del tiempo empleado en un programa puede hacerse con el modulo time: 1 import time 2 ... 3 t0 = time.clock() 4 # Alguna tarea (pesada) 5 t1 = time.clock() 6 7 # asi calculamos el tiempo 8 cpu_time = t1 - t0 La función time.clock () devuelve el tiempo de CPU empleado en el programa desde su inicio. Si el interés está en el tiempo total, que también incluye la lectura y escritura de archivos, time.time () es la función adecuada a usar. Abraham Zamudio 48 / 122
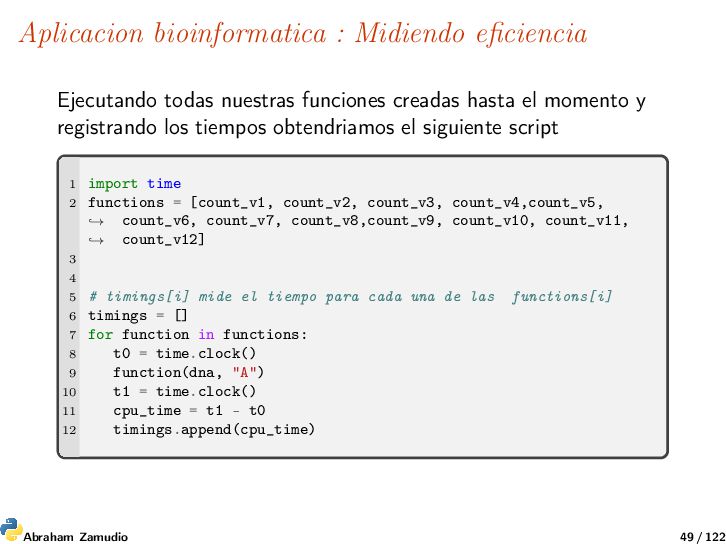
hasta el momento y registrando los tiempos obtendriamos el siguiente script 1 import time 2 functions = [count_v1, count_v2, count_v3, count_v4,count_v5, count_v6, count_v7, count_v8,count_v9, count_v10, count_v11, count_v12] → → 3 4 5 # timings[i] mide el tiempo para cada una de las functions[i] 6 timings = [] 7 for function in functions: 8 t0 = time.clock() 9 function(dna, "A") 10 t1 = time.clock() 11 cpu_time = t1 - t0 12 timings.append(cpu_time) Abraham Zamudio 49 / 122
lineales El método de la Bisección : Ej_Biseccion.py El método de la secante : Ej_Secante.py El método de Newton : Ej_Newton.py Abraham Zamudio 50 / 122
los cuales trabaja NumPy, que son del tipo ndarray. Estas no son las estructuras matriciales que se puede encontrar en C o C++. Un mejor análogo son las matrices en MATLAB o R; Es decir, se comportan como un objeto matemático parecido a un vector matemático, matriz o tensor. Si bien pueden almacenar información no matemática, como cadenas, existen principalmente para administrar y facilitar las operaciones con datos de naturaleza numérica. A los datos de tipo ndarray se les asigna un tipo de dato o dtype particular al momento de la creación, y todos los datos actuales y futuros en la matriz deben ser de ese mismo dtype. También tienen más de una dimensión, denominados ejes (axis). Abraham Zamudio 52 / 122
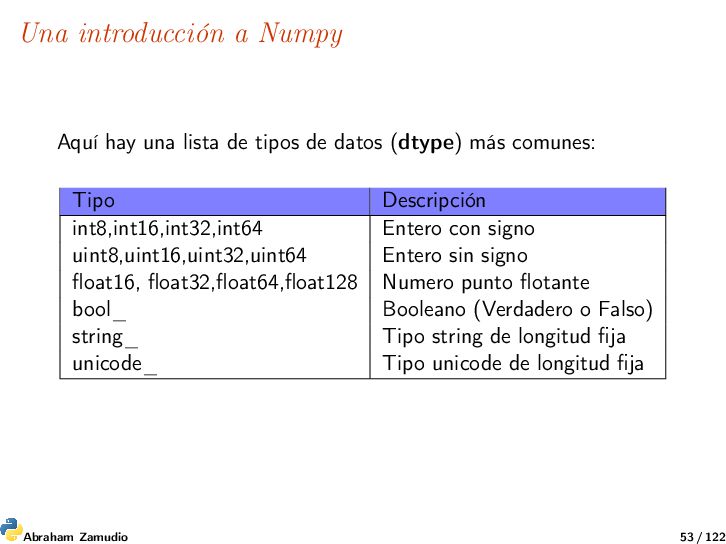
de datos (dtype) más comunes: Tipo Descripción int8,int16,int32,int64 Entero con signo uint8,uint16,uint32,uint64 Entero sin signo float16, float32,float64,float128 Numero punto flotante bool_ Booleano (Verdadero o Falso) string_ Tipo string de longitud fija unicode_ Tipo unicode de longitud fija Abraham Zamudio 53 / 122
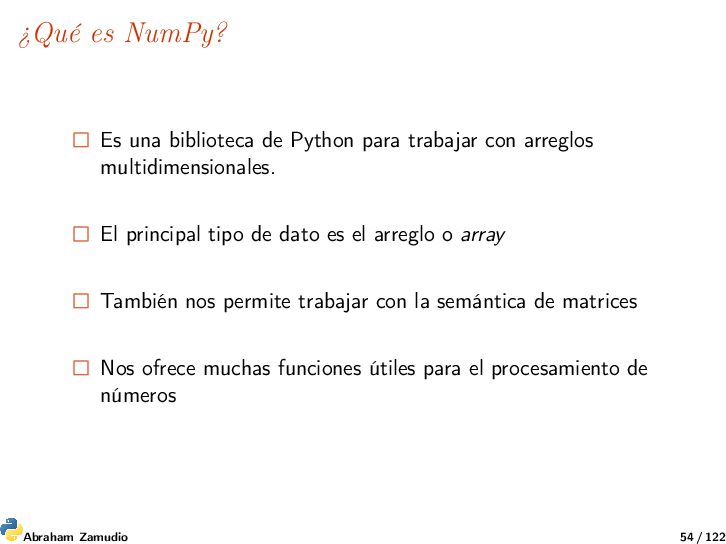
con arreglos multidimensionales. El principal tipo de dato es el arreglo o array También nos permite trabajar con la semántica de matrices Nos ofrece muchas funciones útiles para el procesamiento de números Abraham Zamudio 54 / 122
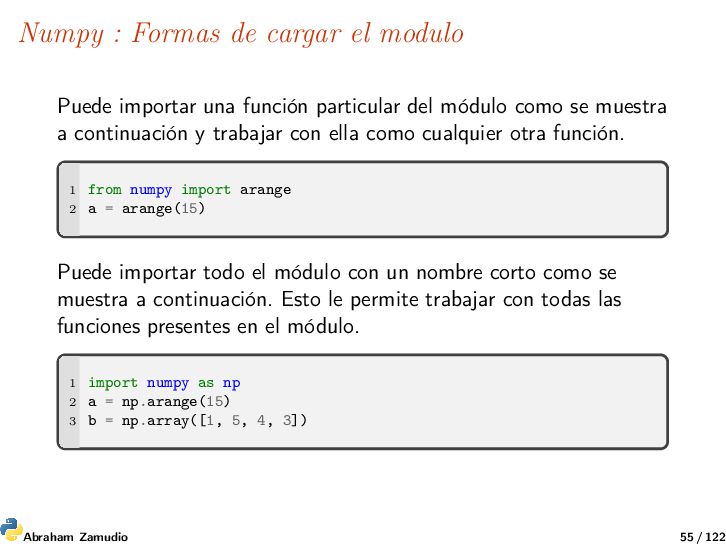
función particular del módulo como se muestra a continuación y trabajar con ella como cualquier otra función. 1 from numpy import arange 2 a = arange(15) Puede importar todo el módulo con un nombre corto como se muestra a continuación. Esto le permite trabajar con todas las funciones presentes en el módulo. 1 import numpy as np 2 a = np.arange(15) 3 b = np.array([1, 5, 4, 3]) Abraham Zamudio 55 / 122
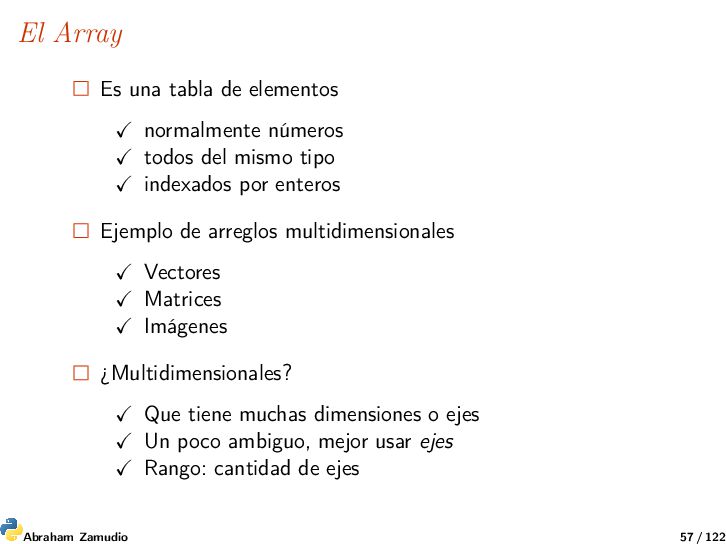
del mismo tipo indexados por enteros Ejemplo de arreglos multidimensionales Vectores Matrices Imágenes ¿Multidimensionales? Que tiene muchas dimensiones o ejes Un poco ambiguo, mejor usar ejes Rango: cantidad de ejes Abraham Zamudio 57 / 122
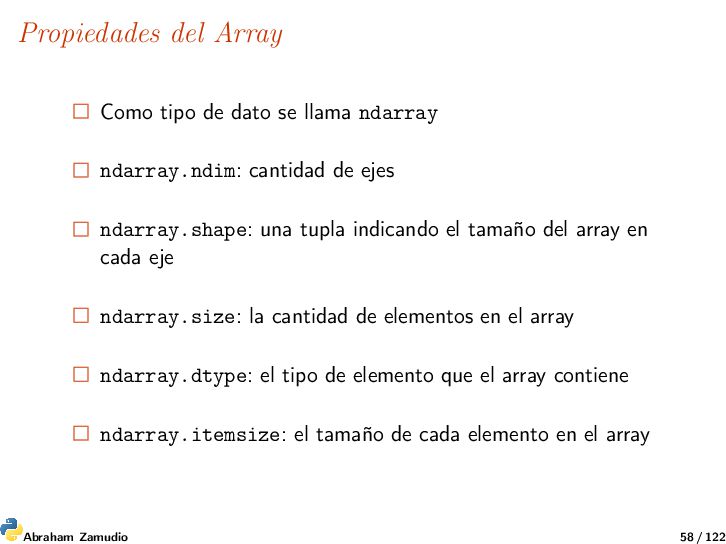
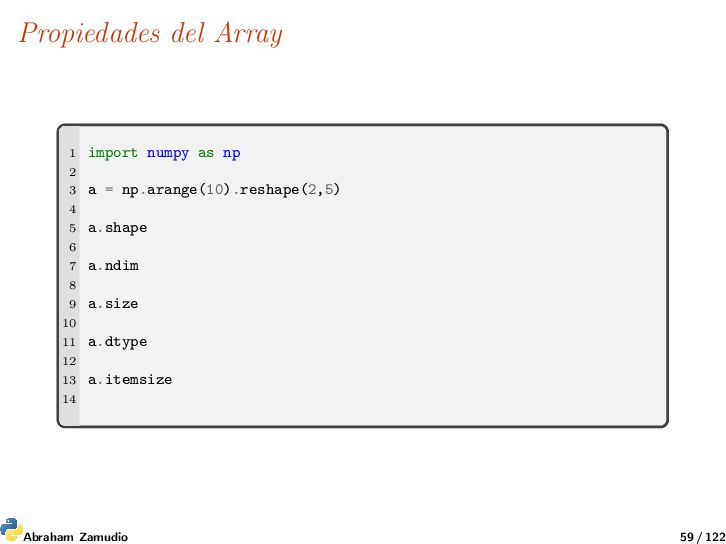
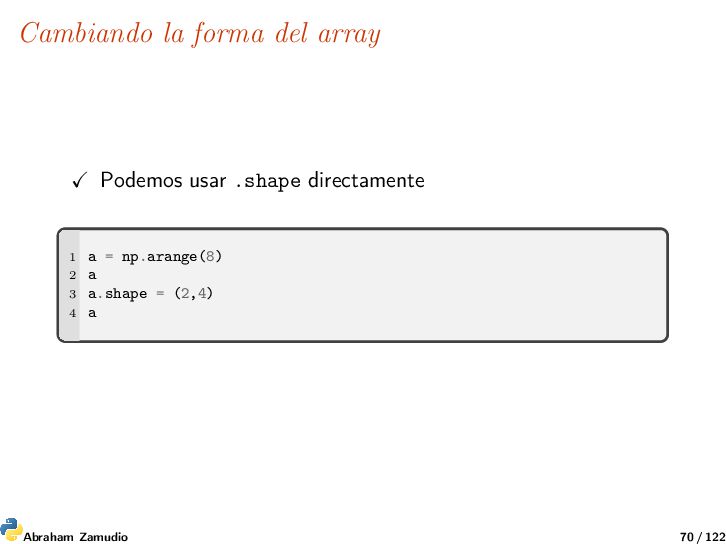
ndarray.ndim: cantidad de ejes ndarray.shape: una tupla indicando el tamaño del array en cada eje ndarray.size: la cantidad de elementos en el array ndarray.dtype: el tipo de elemento que el array contiene ndarray.itemsize: el tamaño de cada elemento en el array Abraham Zamudio 58 / 122
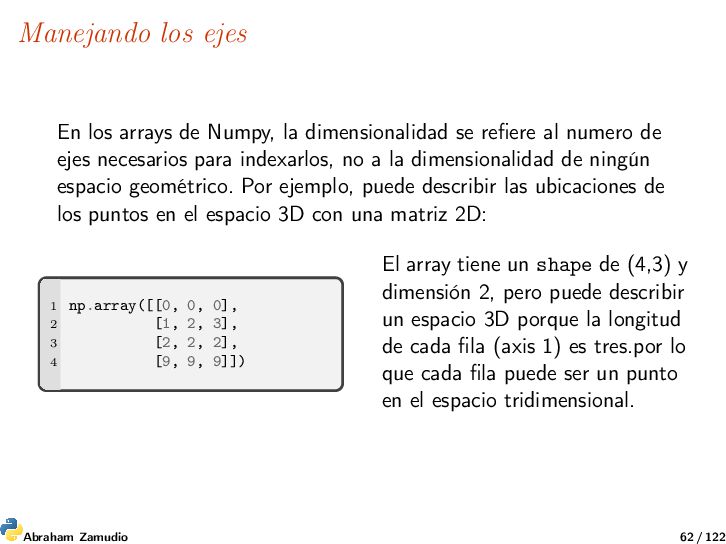
se refiere al numero de ejes necesarios para indexarlos, no a la dimensionalidad de ningún espacio geométrico. Por ejemplo, puede describir las ubicaciones de los puntos en el espacio 3D con una matriz 2D: 1 np.array([[0, 0, 0], 2 [1, 2, 3], 3 [2, 2, 2], 4 [9, 9, 9]]) El array tiene un shape de (4,3) y dimensión 2, pero puede describir un espacio 3D porque la longitud de cada fila (axis 1) es tres.por lo que cada fila puede ser un punto en el espacio tridimensional. Abraham Zamudio 62 / 122
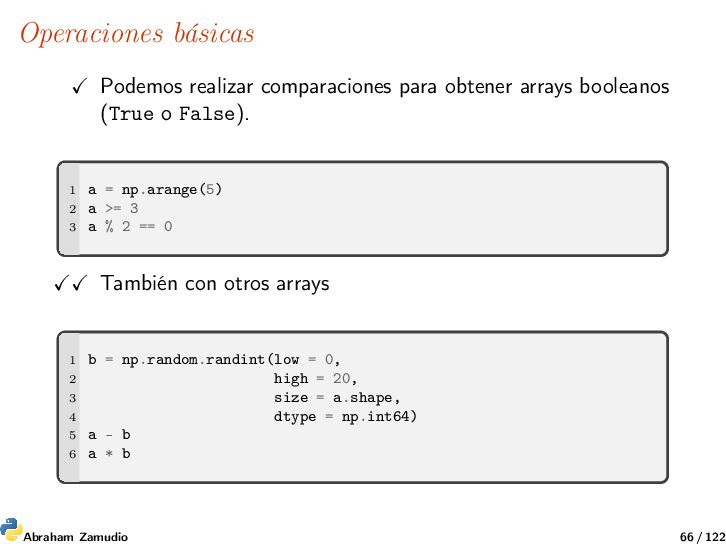
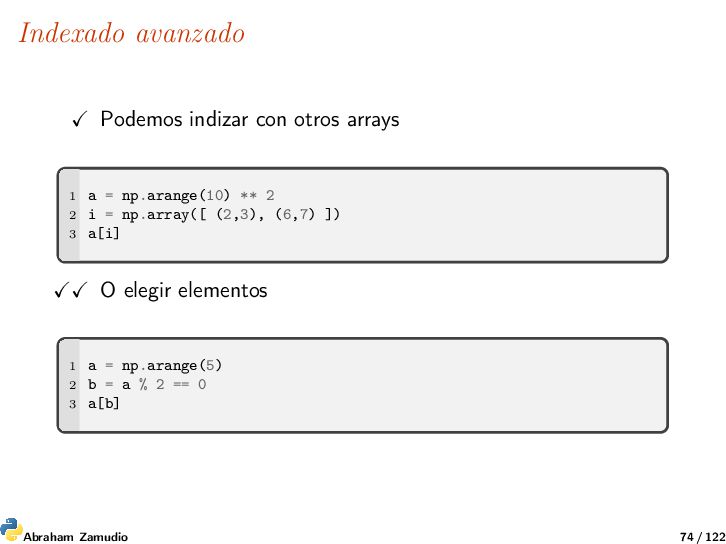
o False). 1 a = np.arange(5) 2 a >= 3 3 a % 2 == 0 También con otros arrays 1 b = np.random.randint(low = 0, 2 high = 20, 3 size = a.shape, 4 dtype = np.int64) 5 a - b 6 a * b Abraham Zamudio 66 / 122
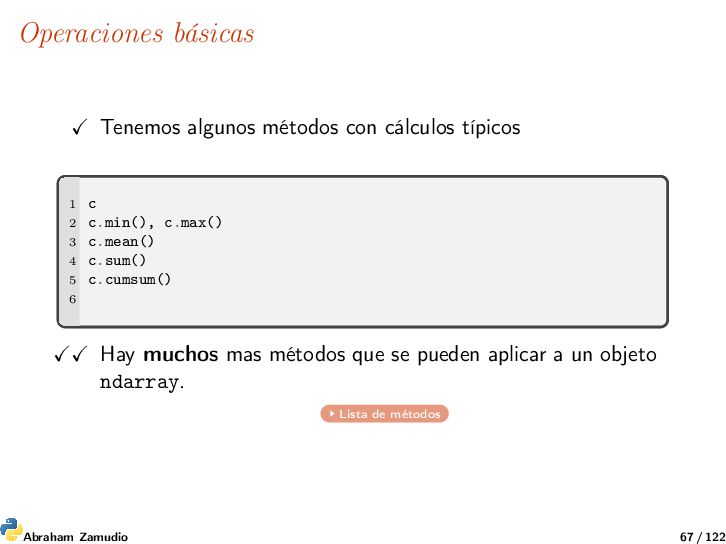
2 c.min(), c.max() 3 c.mean() 4 c.sum() 5 c.cumsum() 6 Hay muchos mas métodos que se pueden aplicar a un objeto ndarray. Lista de métodos Abraham Zamudio 67 / 122
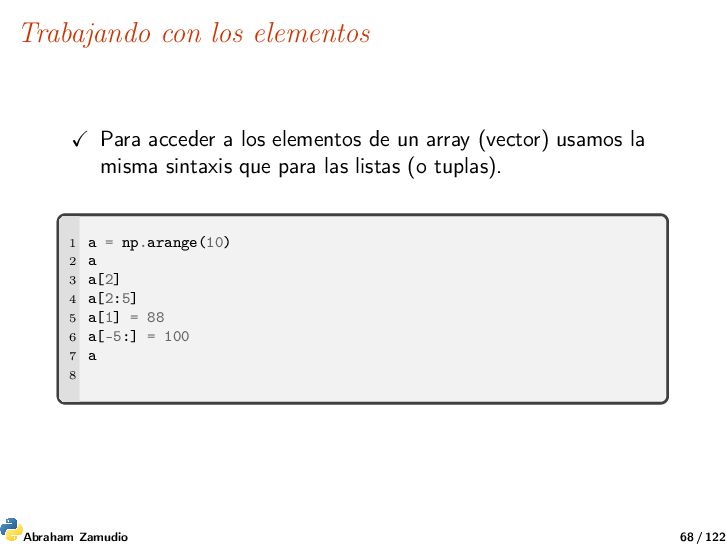
un array (vector) usamos la misma sintaxis que para las listas (o tuplas). 1 a = np.arange(10) 2 a 3 a[2] 4 a[2:5] 5 a[1] = 88 6 a[-5:] = 100 7 a 8 Abraham Zamudio 68 / 122
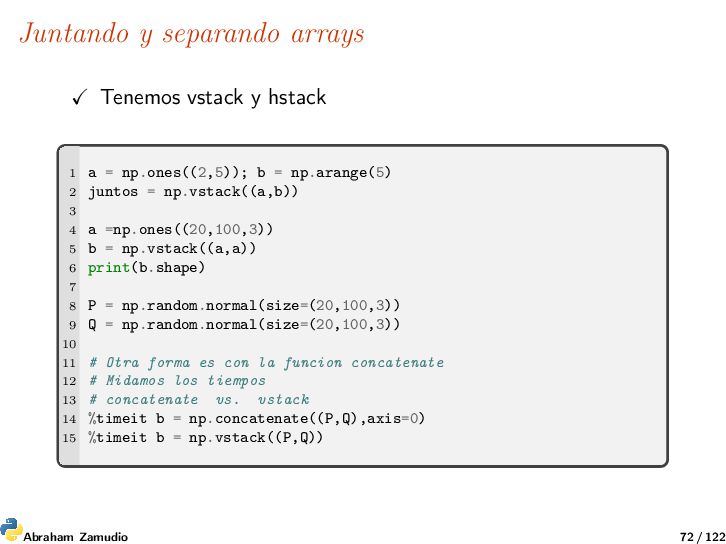
= np.ones((2,5)); b = np.arange(5) 2 juntos = np.vstack((a,b)) 3 4 a =np.ones((20,100,3)) 5 b = np.vstack((a,a)) 6 print(b.shape) 7 8 P = np.random.normal(size=(20,100,3)) 9 Q = np.random.normal(size=(20,100,3)) 10 11 # Otra forma es con la funcion concatenate 12 # Midamos los tiempos 13 # concatenate vs. vstack 14 %timeit b = np.concatenate((P,Q),axis=0) 15 %timeit b = np.vstack((P,Q)) Abraham Zamudio 72 / 122
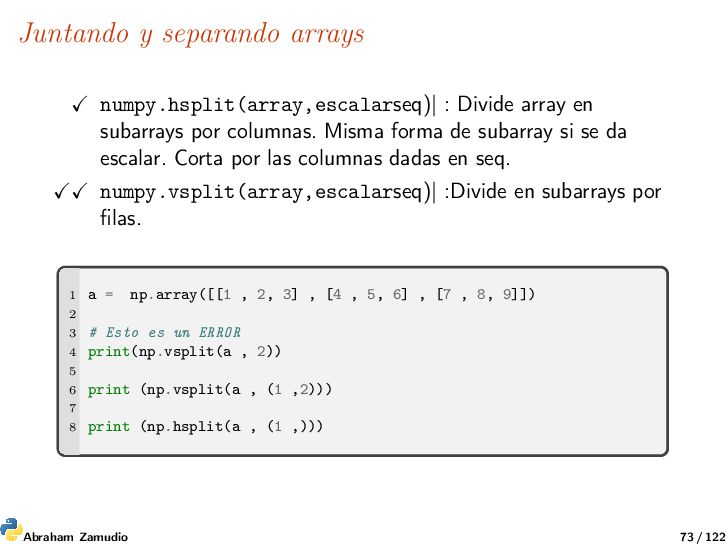
por columnas. Misma forma de subarray si se da escalar. Corta por las columnas dadas en seq. numpy.vsplit(array,escalarseq)| :Divide en subarrays por filas. 1 a = np.array([[1 , 2, 3] , [4 , 5, 6] , [7 , 8, 9]]) 2 3 # Esto es un ERROR 4 print(np.vsplit(a , 2)) 5 6 print (np.vsplit(a , (1 ,2))) 7 8 print (np.hsplit(a , (1 ,))) Abraham Zamudio 73 / 122
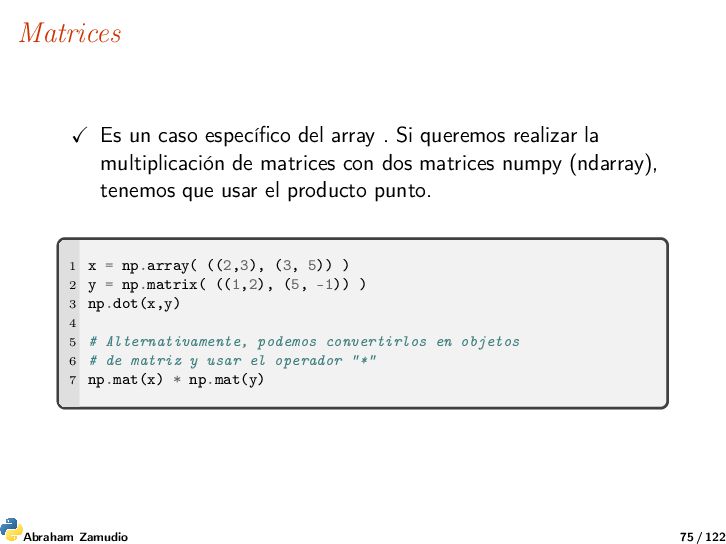
realizar la multiplicación de matrices con dos matrices numpy (ndarray), tenemos que usar el producto punto. 1 x = np.array( ((2,3), (3, 5)) ) 2 y = np.matrix( ((1,2), (5, -1)) ) 3 np.dot(x,y) 4 5 # Alternativamente, podemos convertirlos en objetos 6 # de matriz y usar el operador "*" 7 np.mat(x) * np.mat(y) Abraham Zamudio 75 / 122
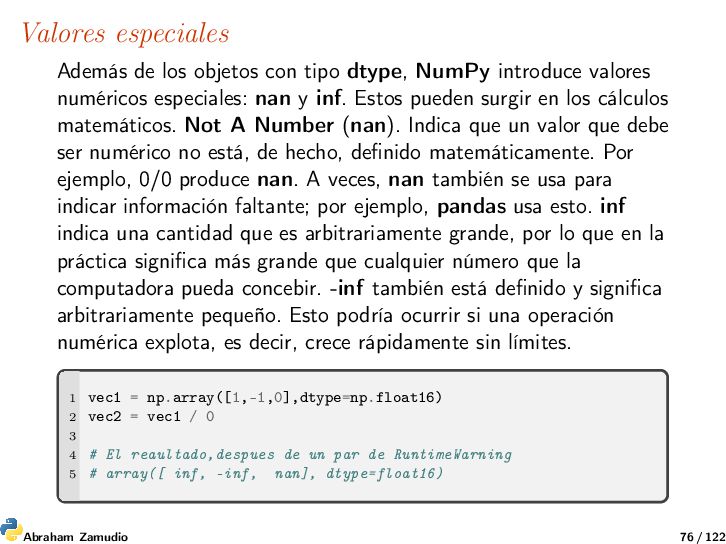
introduce valores numéricos especiales: nan y inf. Estos pueden surgir en los cálculos matemáticos. Not A Number (nan). Indica que un valor que debe ser numérico no está, de hecho, definido matemáticamente. Por ejemplo, 0/0 produce nan. A veces, nan también se usa para indicar información faltante; por ejemplo, pandas usa esto. inf indica una cantidad que es arbitrariamente grande, por lo que en la práctica significa más grande que cualquier número que la computadora pueda concebir. -inf también está definido y significa arbitrariamente pequeño. Esto podría ocurrir si una operación numérica explota, es decir, crece rápidamente sin límites. 1 vec1 = np.array([1,-1,0],dtype=np.float16) 2 vec2 = vec1 / 0 3 4 # El reaultado,despues de un par de RuntimeWarning 5 # array([ inf, -inf, nan], dtype=float16) Abraham Zamudio 76 / 122
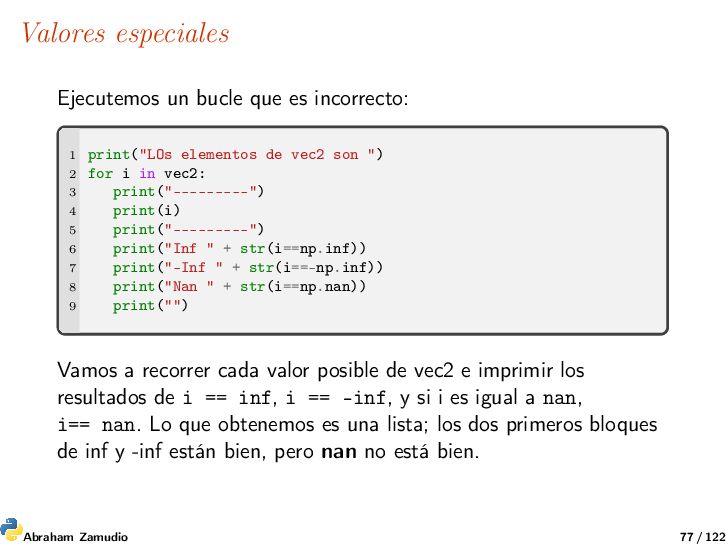
elementos de vec2 son ") 2 for i in vec2: 3 print("---------") 4 print(i) 5 print("---------") 6 print("Inf " + str(i==np.inf)) 7 print("-Inf " + str(i==-np.inf)) 8 print("Nan " + str(i==np.nan)) 9 print("") Vamos a recorrer cada valor posible de vec2 e imprimir los resultados de i == inf, i == -inf, y si i es igual a nan, i== nan. Lo que obtenemos es una lista; los dos primeros bloques de inf y -inf están bien, pero nan no está bien. Abraham Zamudio 77 / 122
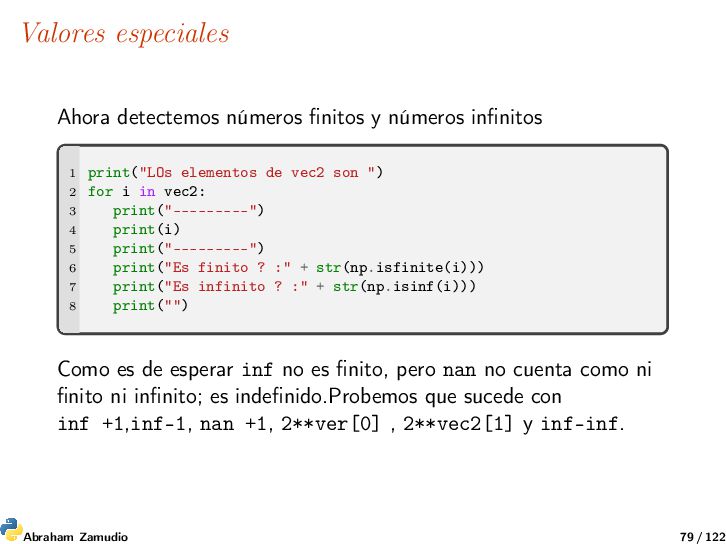
print("LOs elementos de vec2 son ") 2 for i in vec2: 3 print("---------") 4 print(i) 5 print("---------") 6 print("Es finito ? :" + str(np.isfinite(i))) 7 print("Es infinito ? :" + str(np.isinf(i))) 8 print("") Como es de esperar inf no es finito, pero nan no cuenta como ni finito ni infinito; es indefinido.Probemos que sucede con inf +1,inf-1, nan +1, 2**ver[0] , 2**vec2[1] y inf-inf. Abraham Zamudio 79 / 122
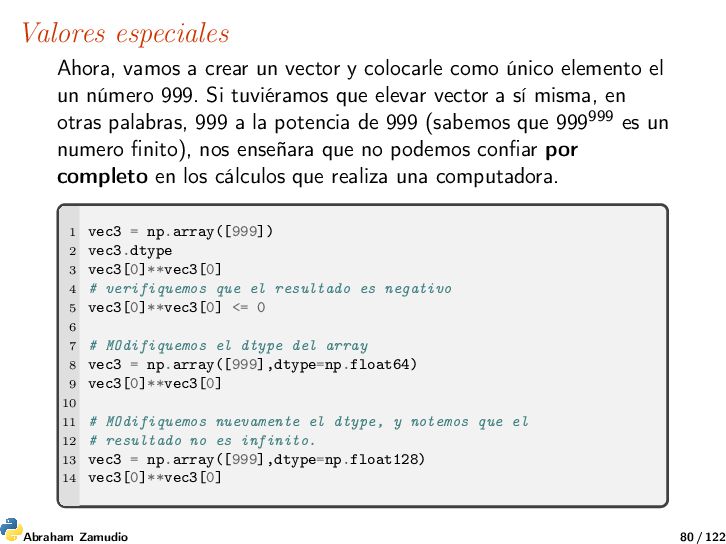
como único elemento el un número 999. Si tuviéramos que elevar vector a sí misma, en otras palabras, 999 a la potencia de 999 (sabemos que 999999 es un numero finito), nos enseñara que no podemos confiar por completo en los cálculos que realiza una computadora. 1 vec3 = np.array([999]) 2 vec3.dtype 3 vec3[0]**vec3[0] 4 # verifiquemos que el resultado es negativo 5 vec3[0]**vec3[0] <= 0 6 7 # MOdifiquemos el dtype del array 8 vec3 = np.array([999],dtype=np.float64) 9 vec3[0]**vec3[0] 10 11 # MOdifiquemos nuevamente el dtype, y notemos que el 12 # resultado no es infinito. 13 vec3 = np.array([999],dtype=np.float128) 14 vec3[0]**vec3[0] Abraham Zamudio 80 / 122
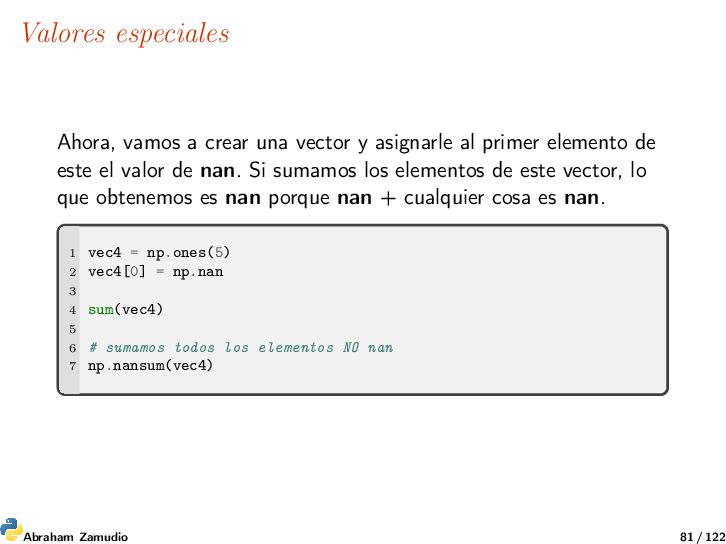
al primer elemento de este el valor de nan. Si sumamos los elementos de este vector, lo que obtenemos es nan porque nan + cualquier cosa es nan. 1 vec4 = np.ones(5) 2 vec4[0] = np.nan 3 4 sum(vec4) 5 6 # sumamos todos los elementos NO nan 7 np.nansum(vec4) Abraham Zamudio 81 / 122
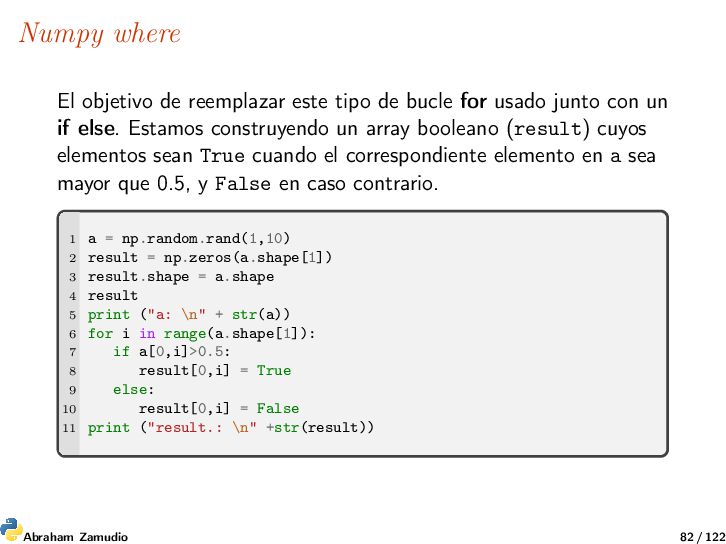
for usado junto con un if else. Estamos construyendo un array booleano (result) cuyos elementos sean True cuando el correspondiente elemento en a sea mayor que 0.5, y False en caso contrario. 1 a = np.random.rand(1,10) 2 result = np.zeros(a.shape[1]) 3 result.shape = a.shape 4 result 5 print ("a: \n" + str(a)) 6 for i in range(a.shape[1]): 7 if a[0,i]>0.5: 8 result[0,i] = True 9 else: 10 result[0,i] = False 11 print ("result.: \n" +str(result)) Abraham Zamudio 82 / 122
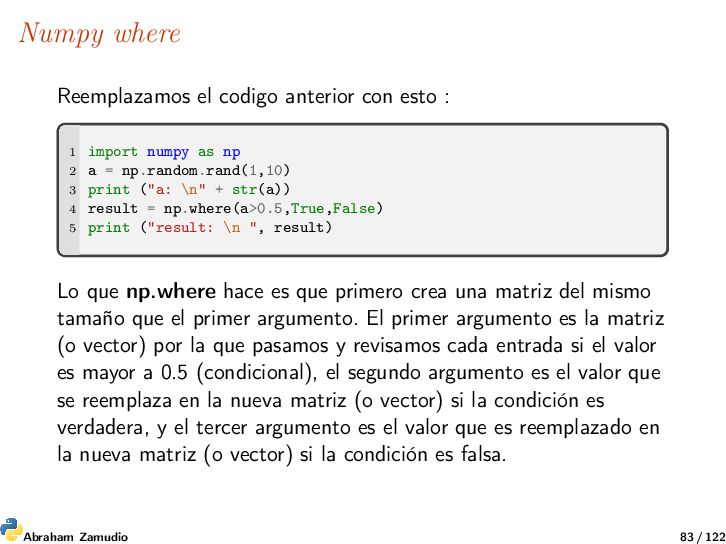
import numpy as np 2 a = np.random.rand(1,10) 3 print ("a: \n" + str(a)) 4 result = np.where(a>0.5,True,False) 5 print ("result: \n ", result) Lo que np.where hace es que primero crea una matriz del mismo tamaño que el primer argumento. El primer argumento es la matriz (o vector) por la que pasamos y revisamos cada entrada si el valor es mayor a 0.5 (condicional), el segundo argumento es el valor que se reemplaza en la nueva matriz (o vector) si la condición es verdadera, y el tercer argumento es el valor que es reemplazado en la nueva matriz (o vector) si la condición es falsa. Abraham Zamudio 83 / 122
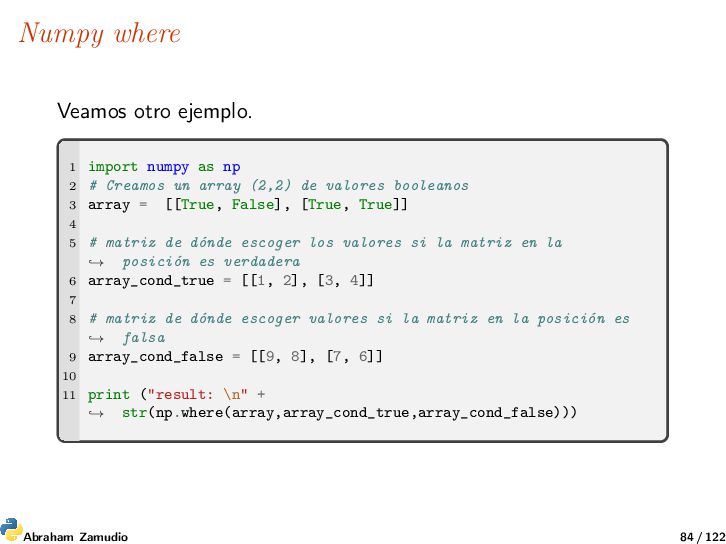
2 # Creamos un array (2,2) de valores booleanos 3 array = [[True, False], [True, True]] 4 5 # matriz de dónde escoger los valores si la matriz en la posición es verdadera → 6 array_cond_true = [[1, 2], [3, 4]] 7 8 # matriz de dónde escoger valores si la matriz en la posición es falsa → 9 array_cond_false = [[9, 8], [7, 6]] 10 11 print ("result: \n" + str(np.where(array,array_cond_true,array_cond_false))) → Abraham Zamudio 84 / 122
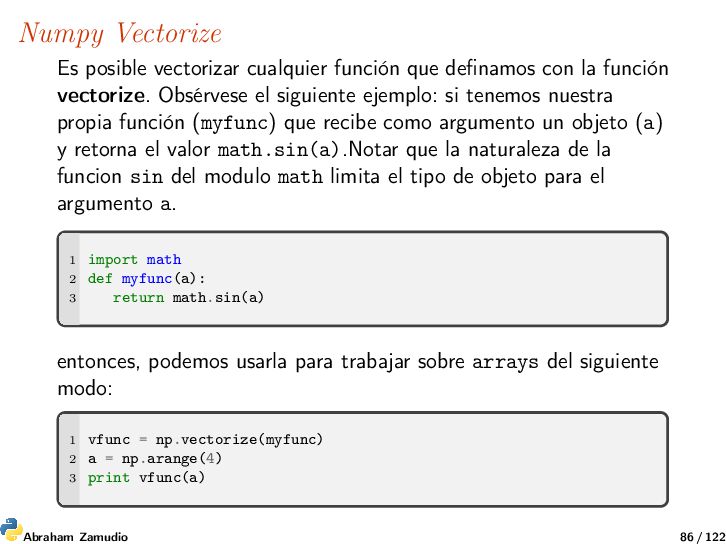
la función vectorize. Obsérvese el siguiente ejemplo: si tenemos nuestra propia función (myfunc) que recibe como argumento un objeto (a) y retorna el valor math.sin(a).Notar que la naturaleza de la funcion sin del modulo math limita el tipo de objeto para el argumento a. 1 import math 2 def myfunc(a): 3 return math.sin(a) entonces, podemos usarla para trabajar sobre arrays del siguiente modo: 1 vfunc = np.vectorize(myfunc) 2 a = np.arange(4) 3 print vfunc(a) Abraham Zamudio 86 / 122
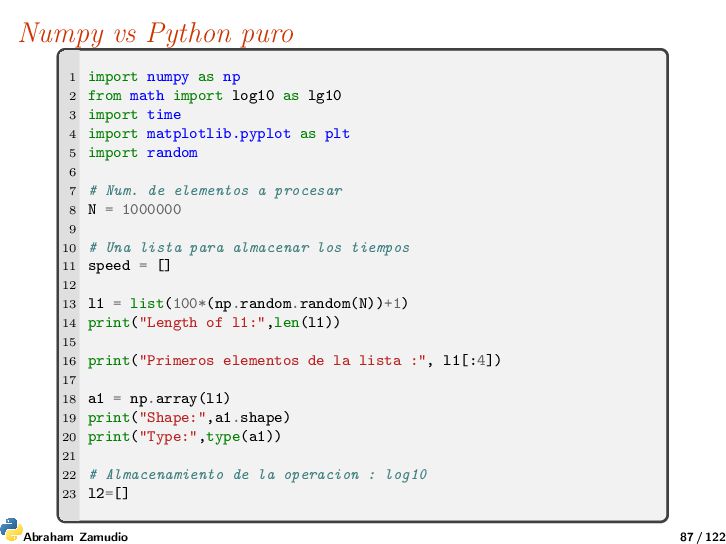
from math import log10 as lg10 3 import time 4 import matplotlib.pyplot as plt 5 import random 6 7 # Num. de elementos a procesar 8 N = 1000000 9 10 # Una lista para almacenar los tiempos 11 speed = [] 12 13 l1 = list(100*(np.random.random(N))+1) 14 print("Length of l1:",len(l1)) 15 16 print("Primeros elementos de la lista :", l1[:4]) 17 18 a1 = np.array(l1) 19 print("Shape:",a1.shape) 20 print("Type:",type(a1)) 21 22 # Almacenamiento de la operacion : log10 23 l2=[] Abraham Zamudio 87 / 122
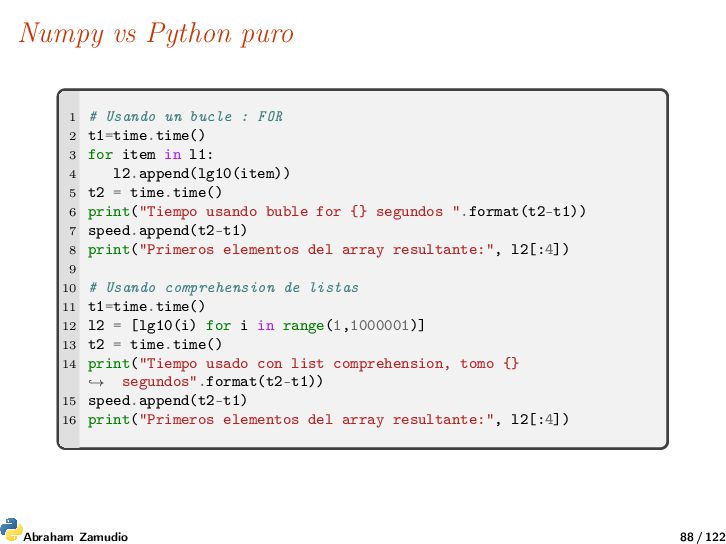
FOR 2 t1=time.time() 3 for item in l1: 4 l2.append(lg10(item)) 5 t2 = time.time() 6 print("Tiempo usando buble for {} segundos ".format(t2-t1)) 7 speed.append(t2-t1) 8 print("Primeros elementos del array resultante:", l2[:4]) 9 10 # Usando comprehension de listas 11 t1=time.time() 12 l2 = [lg10(i) for i in range(1,1000001)] 13 t2 = time.time() 14 print("Tiempo usado con list comprehension, tomo {} segundos".format(t2-t1)) → 15 speed.append(t2-t1) 16 print("Primeros elementos del array resultante:", l2[:4]) Abraham Zamudio 88 / 122
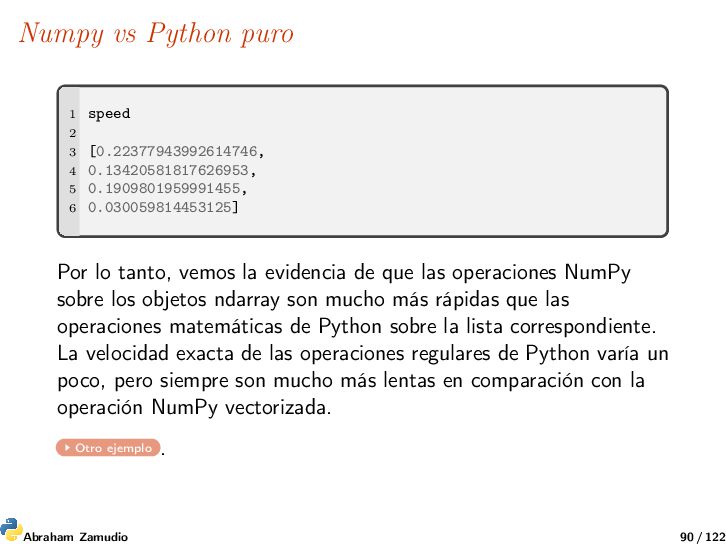
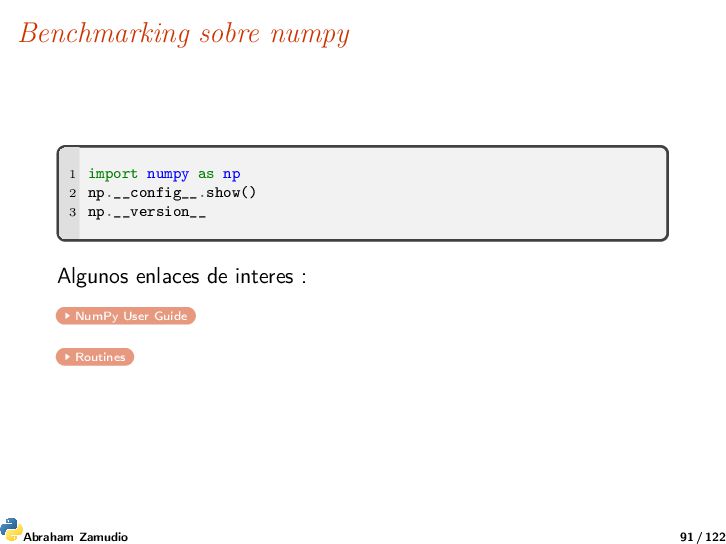
0.13420581817626953, 5 0.1909801959991455, 6 0.030059814453125] Por lo tanto, vemos la evidencia de que las operaciones NumPy sobre los objetos ndarray son mucho más rápidas que las operaciones matemáticas de Python sobre la lista correspondiente. La velocidad exacta de las operaciones regulares de Python varía un poco, pero siempre son mucho más lentas en comparación con la operación NumPy vectorizada. Otro ejemplo . Abraham Zamudio 90 / 122
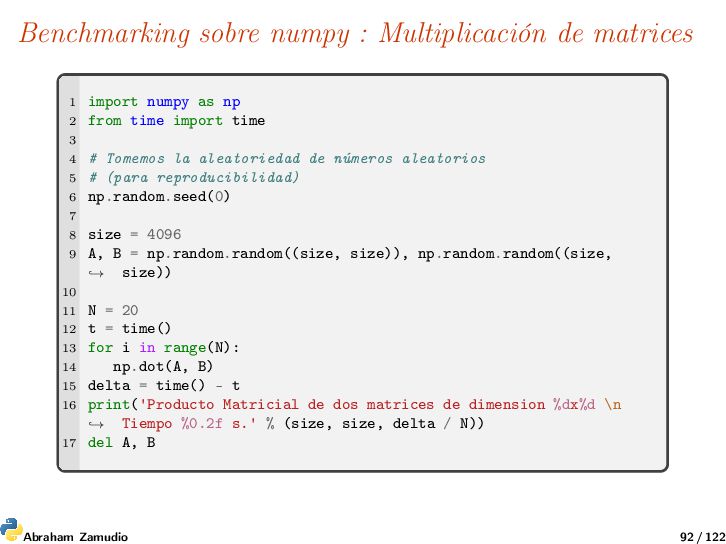
as np 2 from time import time 3 4 # Tomemos la aleatoriedad de números aleatorios 5 # (para reproducibilidad) 6 np.random.seed(0) 7 8 size = 4096 9 A, B = np.random.random((size, size)), np.random.random((size, size)) → 10 11 N = 20 12 t = time() 13 for i in range(N): 14 np.dot(A, B) 15 delta = time() - t 16 print('Producto Matricial de dos matrices de dimension %dx%d \n Tiempo %0.2f s.' % (size, size, delta / N)) → 17 del A, B Abraham Zamudio 92 / 122
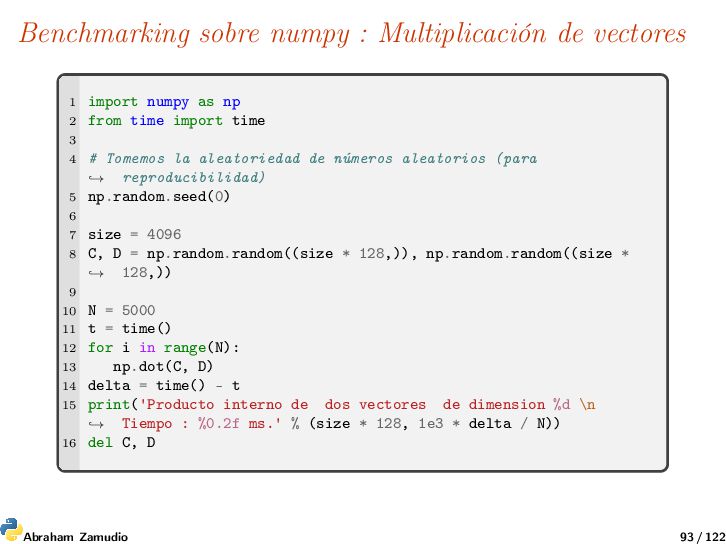
as np 2 from time import time 3 4 # Tomemos la aleatoriedad de números aleatorios (para reproducibilidad) → 5 np.random.seed(0) 6 7 size = 4096 8 C, D = np.random.random((size * 128,)), np.random.random((size * 128,)) → 9 10 N = 5000 11 t = time() 12 for i in range(N): 13 np.dot(C, D) 14 delta = time() - t 15 print('Producto interno de dos vectores de dimension %d \n Tiempo : %0.2f ms.' % (size * 128, 1e3 * delta / N)) → 16 del C, D Abraham Zamudio 93 / 122
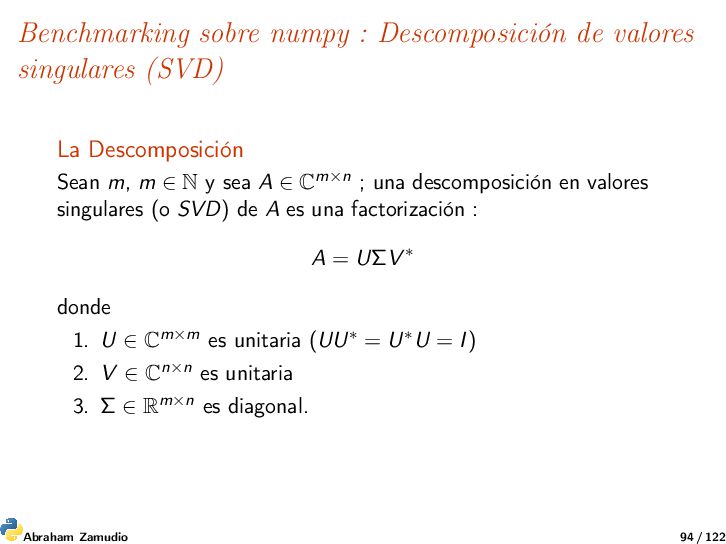
Descomposición Sean m, m ∈ N y sea A ∈ Cm×n ; una descomposición en valores singulares (o SVD) de A es una factorización : A = UΣV ∗ donde 1. U ∈ Cm×m es unitaria (UU∗ = U∗U = I) 2. V ∈ Cn×n es unitaria 3. Σ ∈ Rm×n es diagonal. Abraham Zamudio 94 / 122
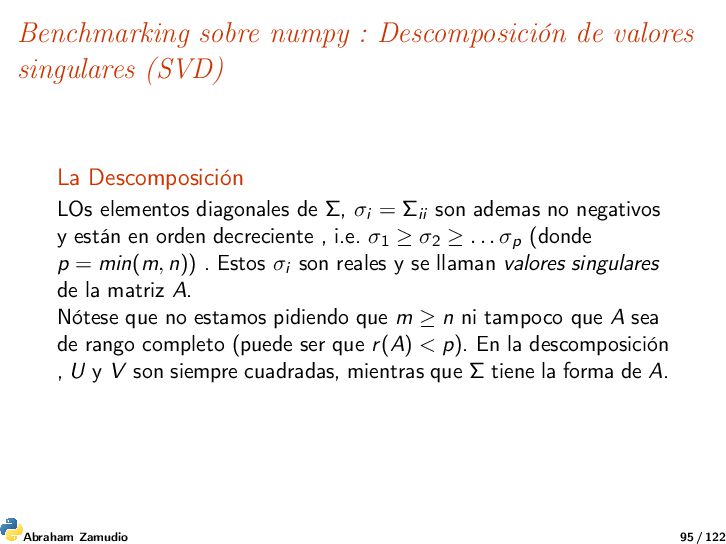
Descomposición LOs elementos diagonales de Σ, σi = Σii son ademas no negativos y están en orden decreciente , i.e. σ1 ≥ σ2 ≥ . . . σp (donde p = min(m, n)) . Estos σi son reales y se llaman valores singulares de la matriz A. Nótese que no estamos pidiendo que m ≥ n ni tampoco que A sea de rango completo (puede ser que r(A) < p). En la descomposición , U y V son siempre cuadradas, mientras que Σ tiene la forma de A. Abraham Zamudio 95 / 122
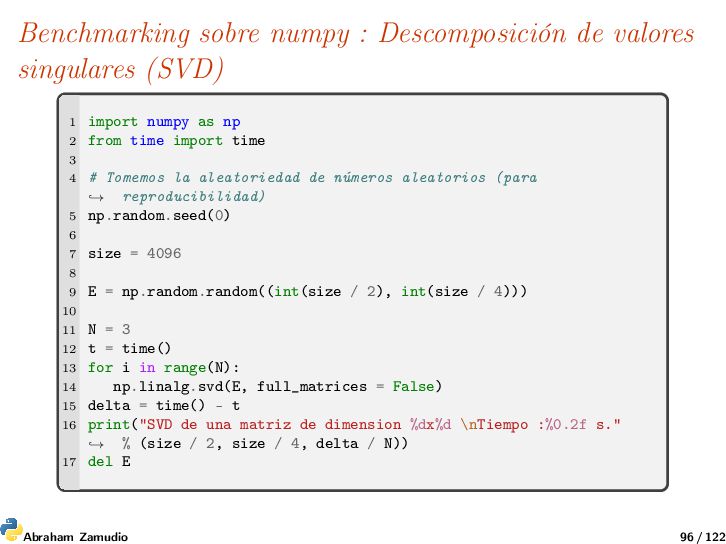
import numpy as np 2 from time import time 3 4 # Tomemos la aleatoriedad de números aleatorios (para reproducibilidad) → 5 np.random.seed(0) 6 7 size = 4096 8 9 E = np.random.random((int(size / 2), int(size / 4))) 10 11 N = 3 12 t = time() 13 for i in range(N): 14 np.linalg.svd(E, full_matrices = False) 15 delta = time() - t 16 print("SVD de una matriz de dimension %dx%d \nTiempo :%0.2f s." % (size / 2, size / 4, delta / N)) → 17 del E Abraham Zamudio 96 / 122
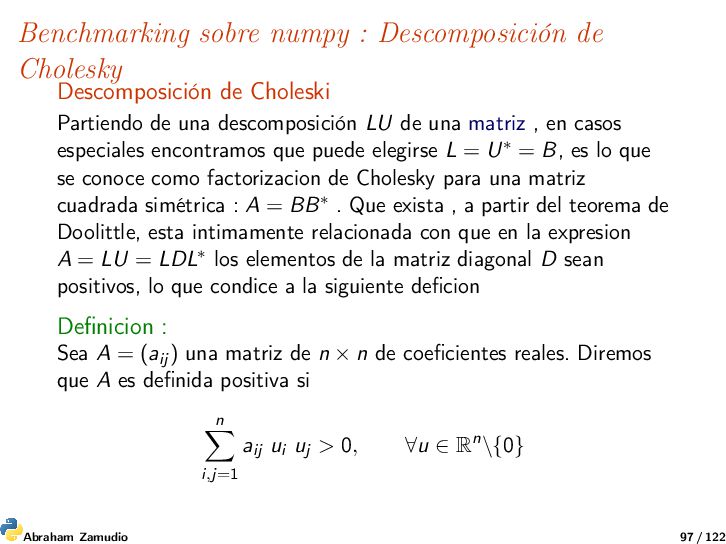
Partiendo de una descomposición LU de una matriz , en casos especiales encontramos que puede elegirse L = U∗ = B, es lo que se conoce como factorizacion de Cholesky para una matriz cuadrada simétrica : A = BB∗ . Que exista , a partir del teorema de Doolittle, esta intimamente relacionada con que en la expresion A = LU = LDL∗ los elementos de la matriz diagonal D sean positivos, lo que condice a la siguiente deficion Definicion : Sea A = (aij ) una matriz de n × n de coeficientes reales. Diremos que A es definida positiva si n i,j=1 aij ui uj > 0, ∀u ∈ Rn\{0} Abraham Zamudio 97 / 122
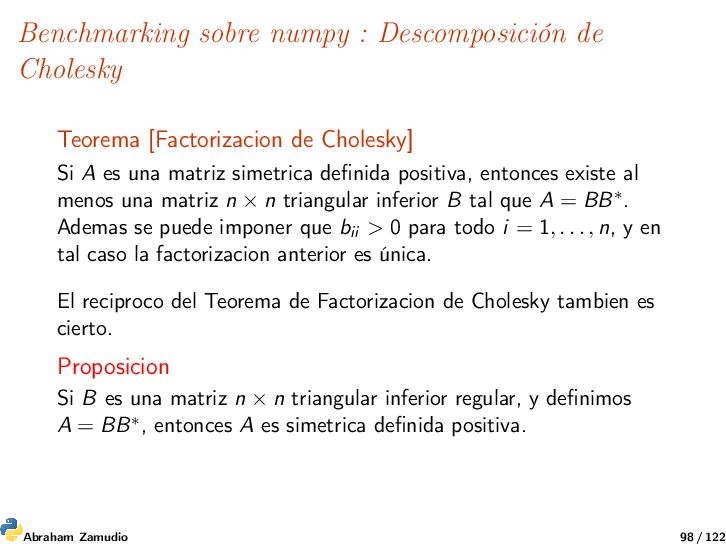
Cholesky] Si A es una matriz simetrica definida positiva, entonces existe al menos una matriz n × n triangular inferior B tal que A = BB∗. Ademas se puede imponer que bii > 0 para todo i = 1, . . . , n, y en tal caso la factorizacion anterior es única. El reciproco del Teorema de Factorizacion de Cholesky tambien es cierto. Proposicion Si B es una matriz n × n triangular inferior regular, y definimos A = BB∗, entonces A es simetrica definida positiva. Abraham Zamudio 98 / 122
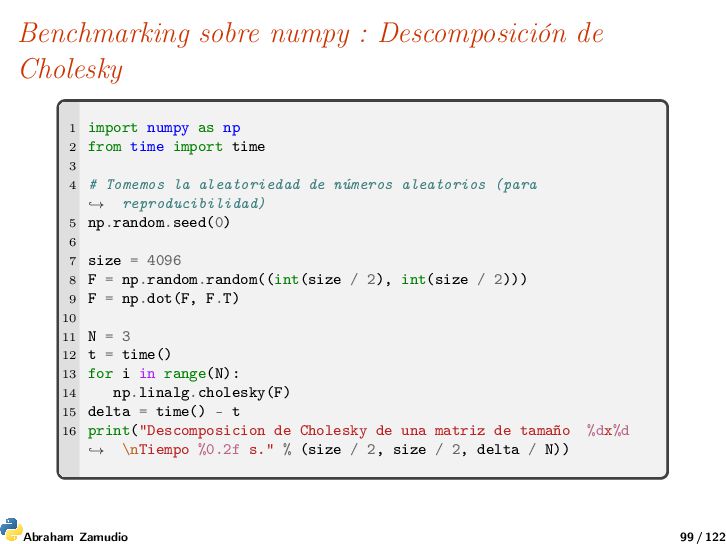
as np 2 from time import time 3 4 # Tomemos la aleatoriedad de números aleatorios (para reproducibilidad) → 5 np.random.seed(0) 6 7 size = 4096 8 F = np.random.random((int(size / 2), int(size / 2))) 9 F = np.dot(F, F.T) 10 11 N = 3 12 t = time() 13 for i in range(N): 14 np.linalg.cholesky(F) 15 delta = time() - t 16 print("Descomposicion de Cholesky de una matriz de tamaño %dx%d \nTiempo %0.2f s." % (size / 2, size / 2, delta / N)) → Abraham Zamudio 99 / 122
son Cython Por una parte, Cython es un lenguaje de programación (un superconjunto de Python) que une Python con el sistema de tipado estático de C y C++. Por otra parte, cython es un compilador que traduce codigo fuente escrito en Cython en eficiente código C o C++. El código resultante se podría usar como una extensión Python o como un ejecutable. Numba Abraham Zamudio 101 / 122
son Cython Numba Numba tiene dos modos de funcionamiento básicos: el modo object y el modo nopython. El modo object genera código que gestiona todas las variables como objetos de Python y utiliza la API C de Python para operar con ellas. El modo nopython genera código independiente de la API C de Python. Esto tiene la desventaja de que no podemos usar todas las características del lenguaje, pero tiene un efecto significativo en el rendimiento. Abraham Zamudio 102 / 122
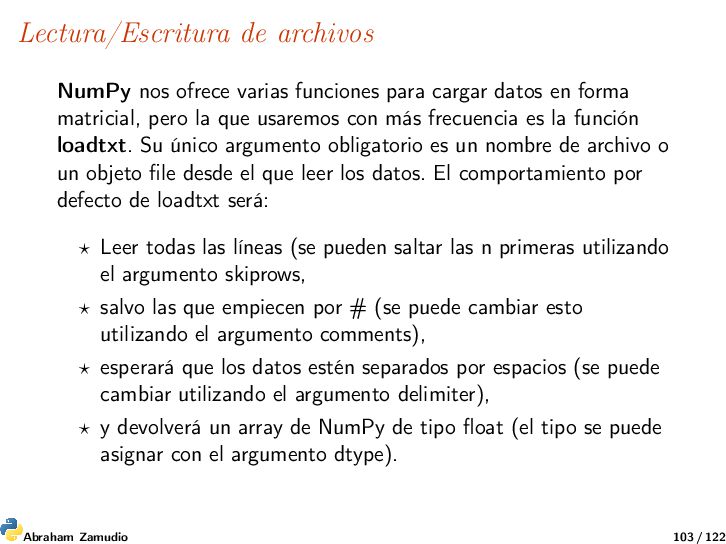
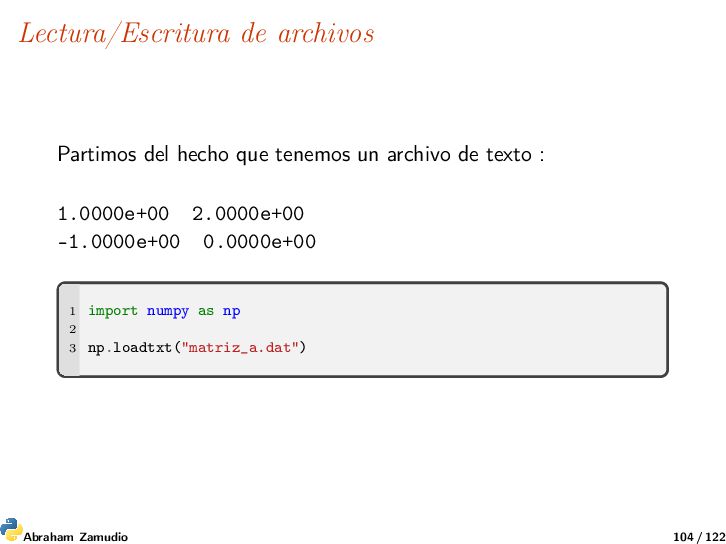
datos en forma matricial, pero la que usaremos con más frecuencia es la función loadtxt. Su único argumento obligatorio es un nombre de archivo o un objeto file desde el que leer los datos. El comportamiento por defecto de loadtxt será: Leer todas las líneas (se pueden saltar las n primeras utilizando el argumento skiprows, salvo las que empiecen por # (se puede cambiar esto utilizando el argumento comments), esperará que los datos estén separados por espacios (se puede cambiar utilizando el argumento delimiter), y devolverá un array de NumPy de tipo float (el tipo se puede asignar con el argumento dtype). Abraham Zamudio 103 / 122
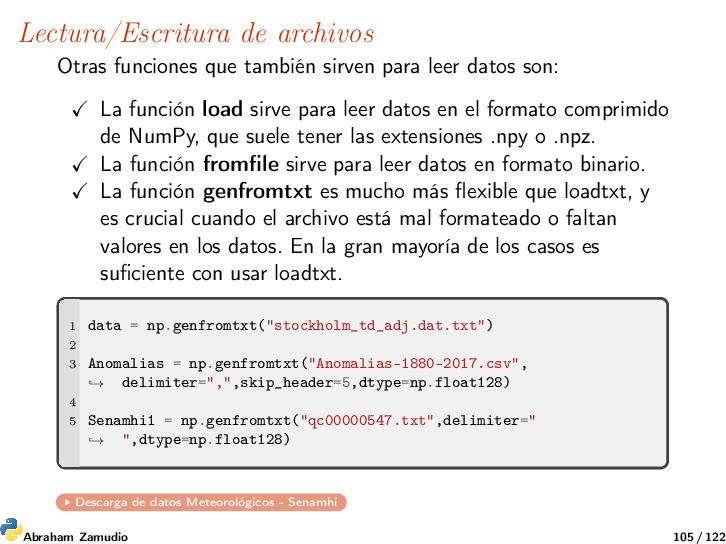
datos son: La función load sirve para leer datos en el formato comprimido de NumPy, que suele tener las extensiones .npy o .npz. La función fromfile sirve para leer datos en formato binario. La función genfromtxt es mucho más flexible que loadtxt, y es crucial cuando el archivo está mal formateado o faltan valores en los datos. En la gran mayoría de los casos es suficiente con usar loadtxt. 1 data = np.genfromtxt("stockholm_td_adj.dat.txt") 2 3 Anomalias = np.genfromtxt("Anomalias-1880-2017.csv", delimiter=",",skip_header=5,dtype=np.float128) → 4 5 Senamhi1 = np.genfromtxt("qc00000547.txt",delimiter=" ",dtype=np.float128) → Descarga de datos Meteorológicos - Senamhi Abraham Zamudio 105 / 122
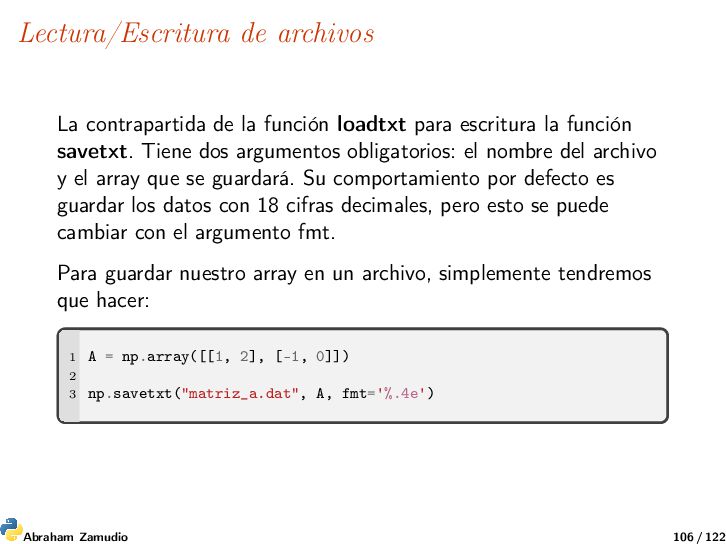
escritura la función savetxt. Tiene dos argumentos obligatorios: el nombre del archivo y el array que se guardará. Su comportamiento por defecto es guardar los datos con 18 cifras decimales, pero esto se puede cambiar con el argumento fmt. Para guardar nuestro array en un archivo, simplemente tendremos que hacer: 1 A = np.array([[1, 2], [-1, 0]]) 2 3 np.savetxt("matriz_a.dat", A, fmt='%.4e') Abraham Zamudio 106 / 122
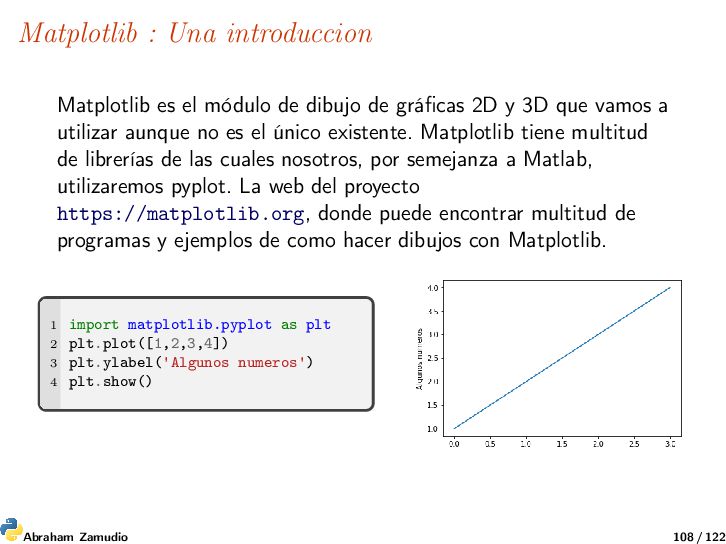
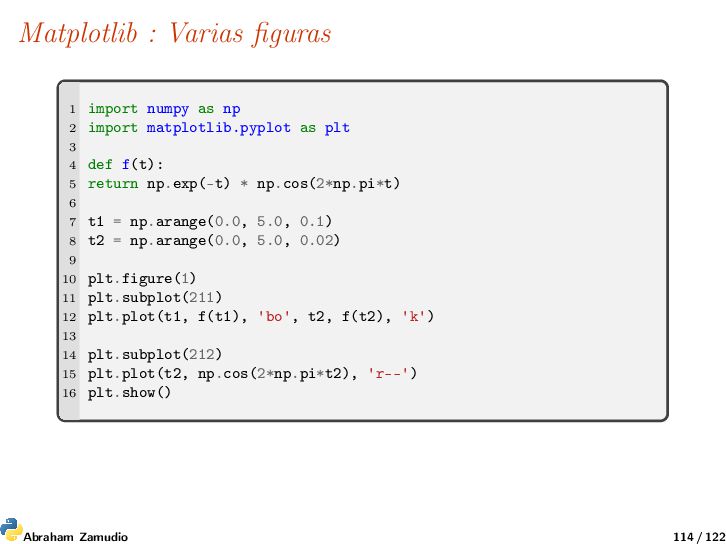
de gráficas 2D y 3D que vamos a utilizar aunque no es el único existente. Matplotlib tiene multitud de librerías de las cuales nosotros, por semejanza a Matlab, utilizaremos pyplot. La web del proyecto https://matplotlib.org, donde puede encontrar multitud de programas y ejemplos de como hacer dibujos con Matplotlib. 1 import matplotlib.pyplot as plt 2 plt.plot([1,2,3,4]) 3 plt.ylabel('Algunos numeros') 4 plt.show() Abraham Zamudio 108 / 122
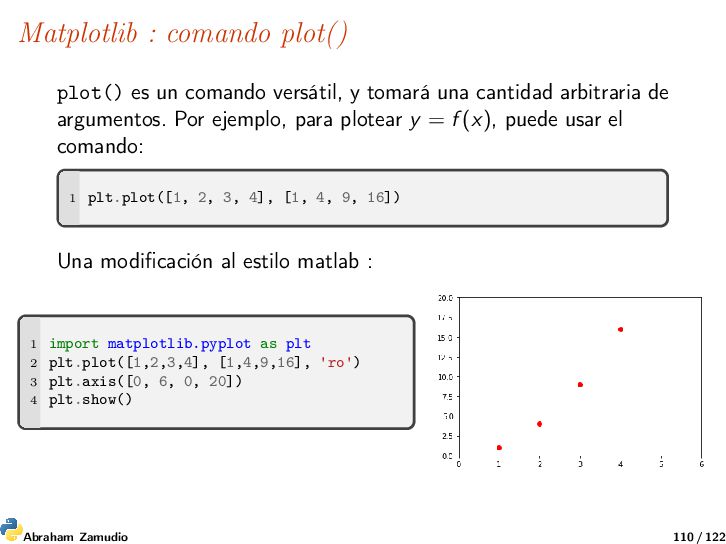
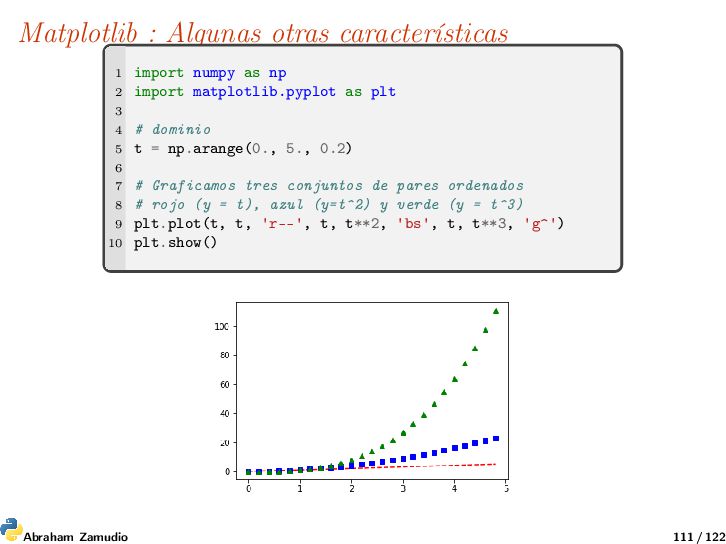
tomará una cantidad arbitraria de argumentos. Por ejemplo, para plotear y = f (x), puede usar el comando: 1 plt.plot([1, 2, 3, 4], [1, 4, 9, 16]) Una modificación al estilo matlab : 1 import matplotlib.pyplot as plt 2 plt.plot([1,2,3,4], [1,4,9,16], 'ro') 3 plt.axis([0, 6, 0, 20]) 4 plt.show() Abraham Zamudio 110 / 122
precipitaciones promedio anuales a escala regional para el norte de Perú. El conjunto de datos cuenta con 20 estaciones de la costa, los andes y la selva de Perú con las diferencias en la elevación y las tasas de precipitación. El objetivo principal de esta es analizar los patrones de precipitación y sus tendencias utilizando Python. Por cuestiones tecnicas del sensor, los elementos de la primera fila representan las etiquetas de cada una de las columnas: longitud, latitud, elevación, nombre y precipitación anual.Ademas la cuarta columna es el nombre de la estacion que por cuestiones didacticas se le asigno la cadena nan. Ver el script precipitaciones.py Abraham Zamudio 122 / 122
![Creando Arrays Tomando un iterable como origen 1 np.array( [2,3,4]](https://files.speakerdeck.com/presentations/cd31afe34cf84a63b084fbcd41b010a2/slide_59.jpg)