Want to increase your sales? Here’s a detailed case study on how e-commerce companies can leverage profits with machine learning algorithms.
You can find a detailed guide here - https://www.romexsoft.com/blog/ecommerce-conversions/
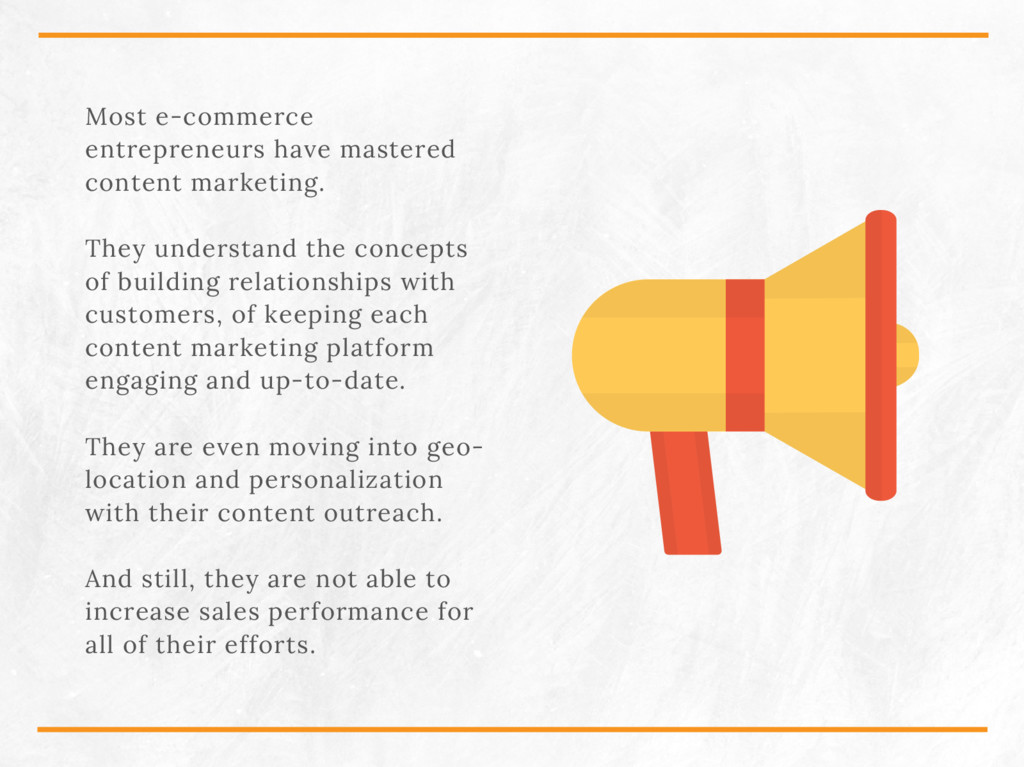
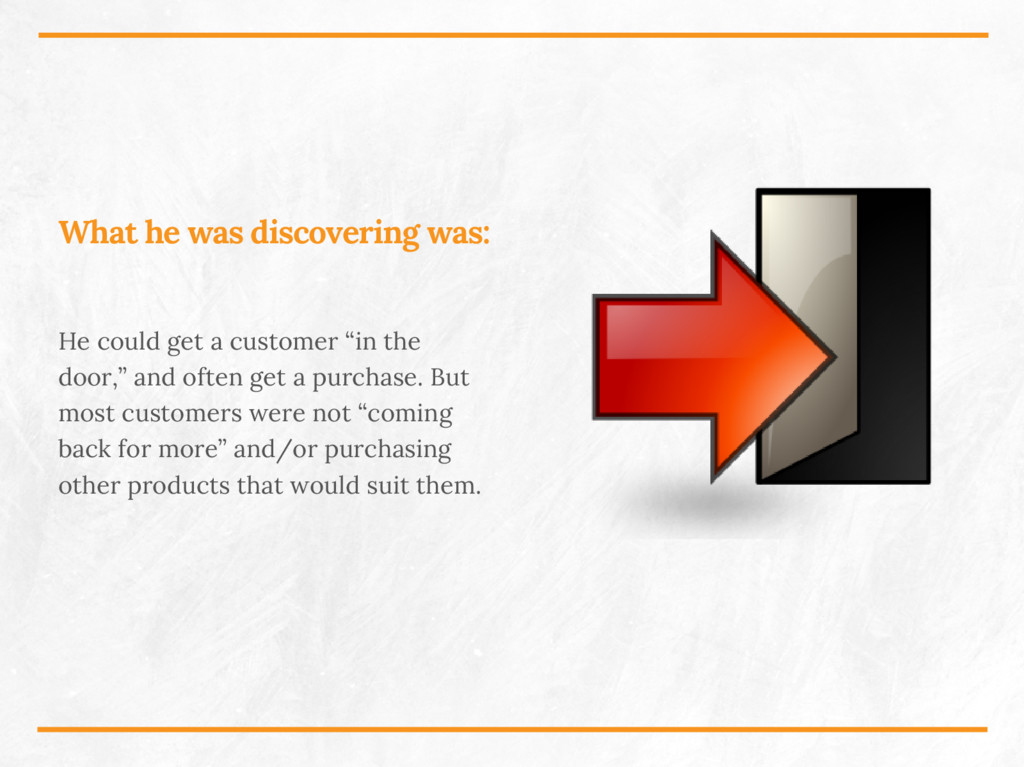
concepts of building relationships with customers, of keeping each content marketing platform engaging and up-to-date. They are even moving into geo- location and personalization with their content outreach. And still, they are not able to increase sales performance for all of their efforts.
you with customers who may be of the same age range, the same sex, and with the same interests that you have. Data science is tracking your behavior and offering other potential purchases to you, based upon all of these factors. Chances are you will look at those other products, may purchase one or two, or at least be aware that they exist so that you may return and purchase them.
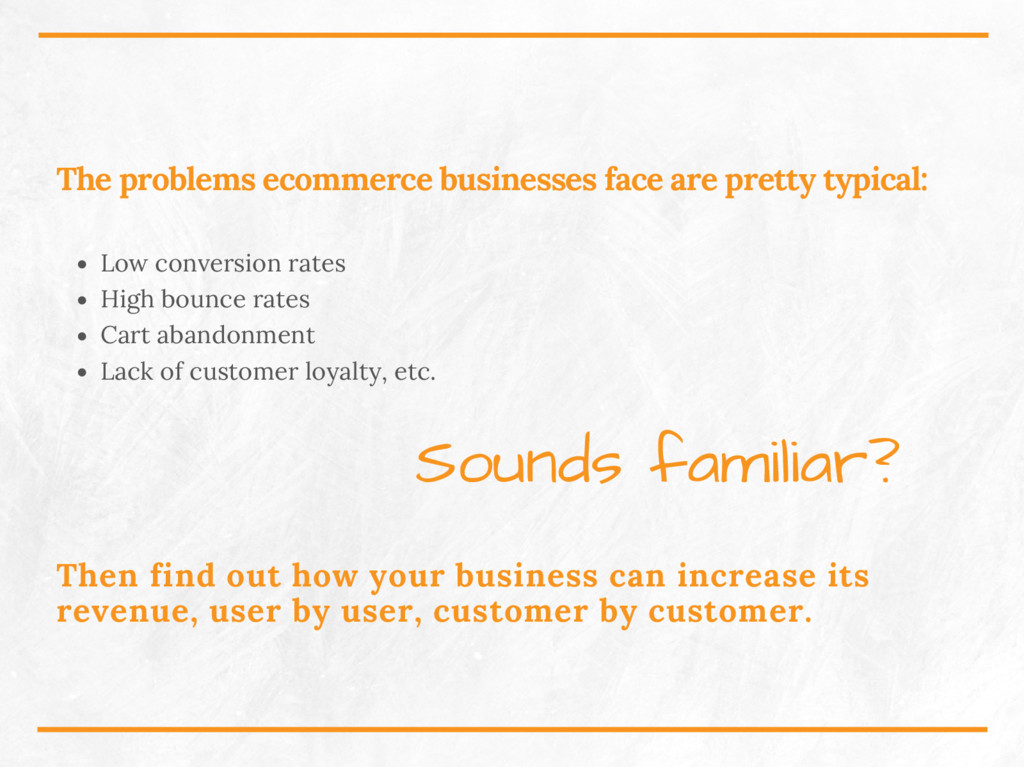
rates High bounce rates Cart abandonment Lack of customer loyalty, etc. Sounds familiar? Then find out how your business can increase its revenue, user by user, customer by customer.
least popular, those pages that resulted in the most bounce rates, most and least popular products, based upon the correlation between views and actual purchases. Analysis of the Site Structure Itself
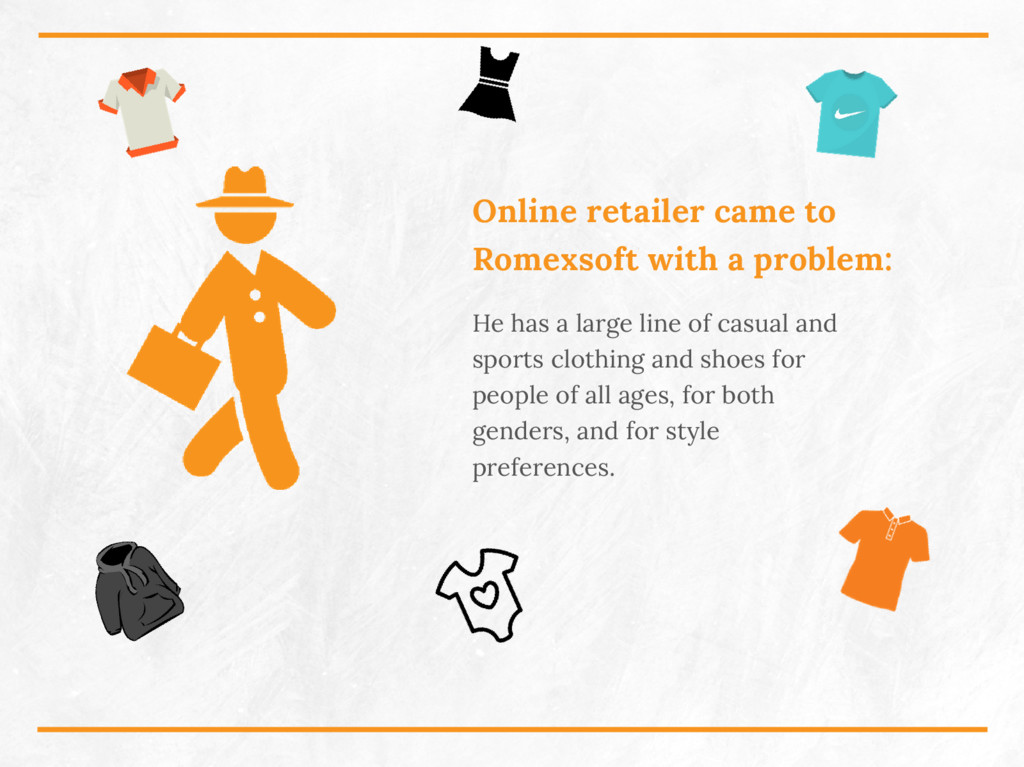
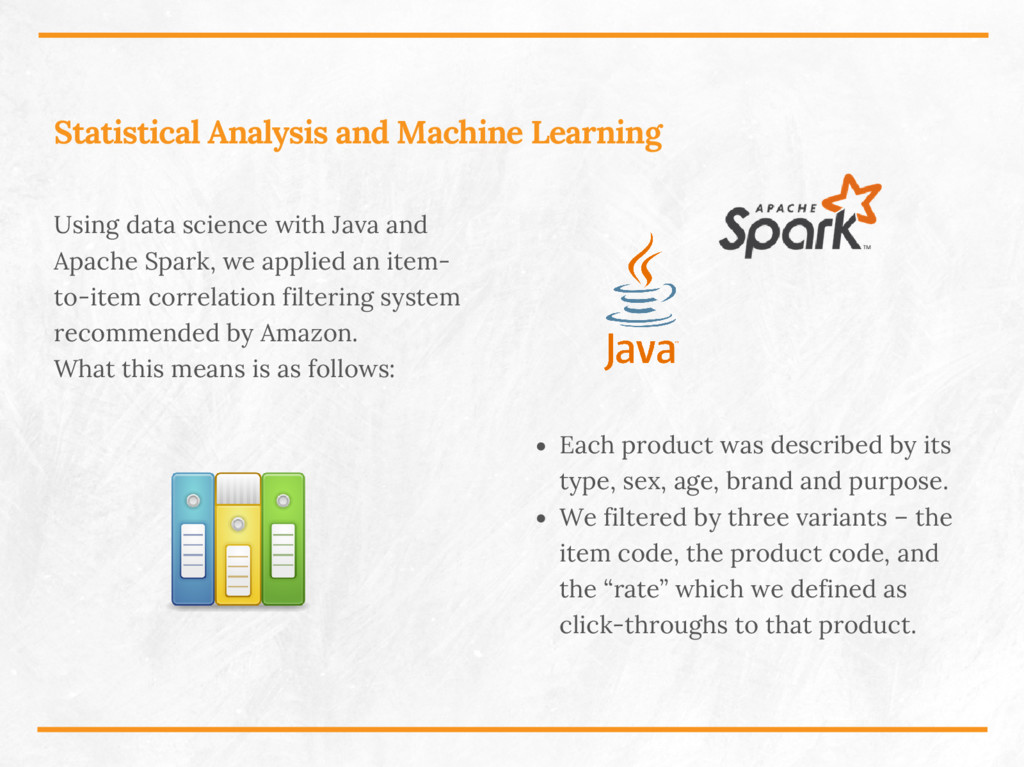
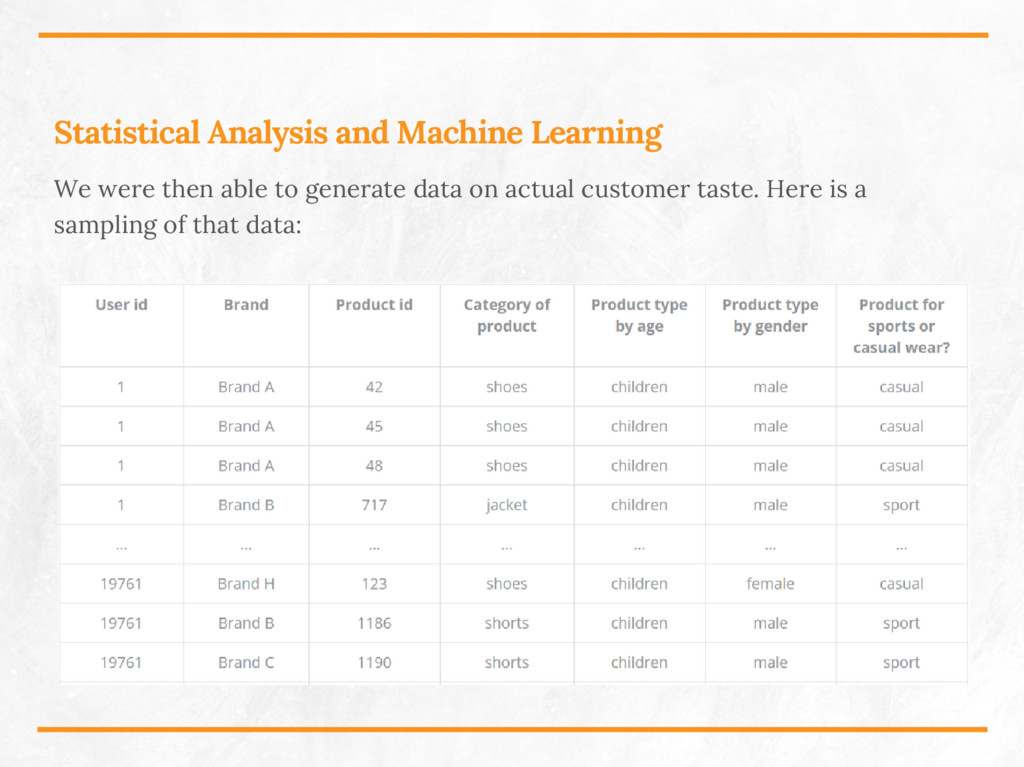
first organize products based upon type (e.g., shirt, shoes) sex, age groups, their purpose (casual or sport), brands/pricing, and a full history of the numbers of views of each product page and the information that was provided on that page. We generated more than 150,000 records of data to test. Generating The Test Data
and Apache Spark, we applied an item- to-item correlation filtering system recommended by Amazon. What this means is as follows: Each product was described by its type, sex, age, brand and purpose. We filtered by three variants – the item code, the product code, and the “rate” which we defined as click-throughs to that product.
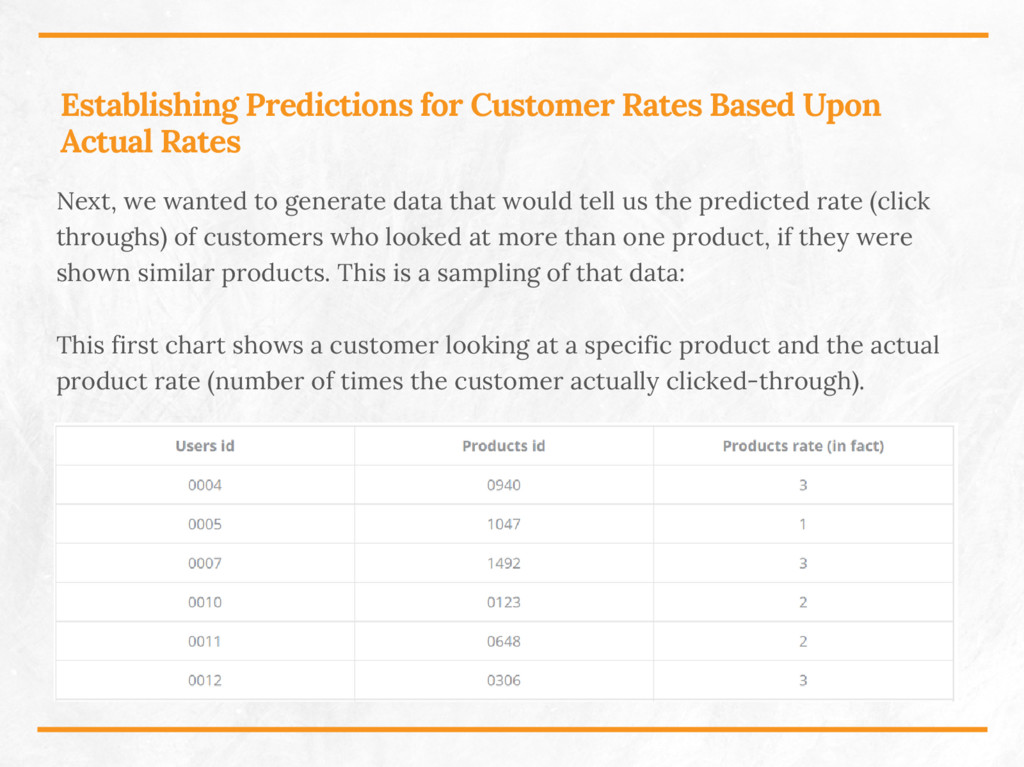
we wanted to generate data that would tell us the predicted rate (click throughs) of customers who looked at more than one product, if they were shown similar products. This is a sampling of that data: This first chart shows a customer looking at a specific product and the actual product rate (number of times the customer actually clicked-through).
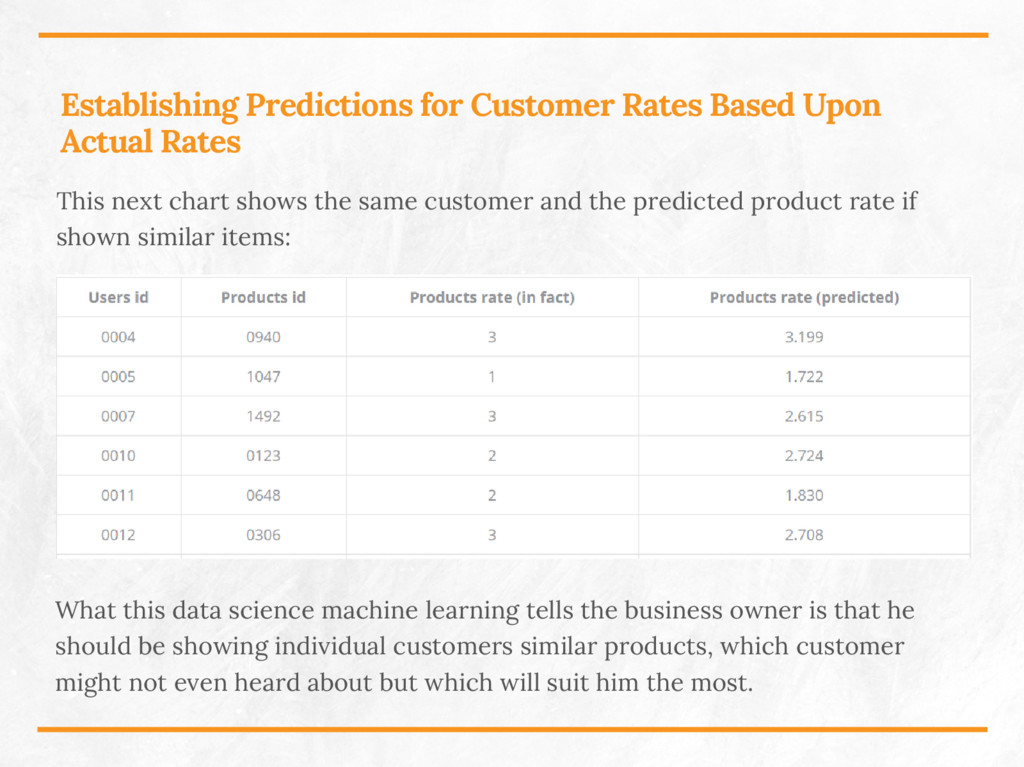
next chart shows the same customer and the predicted product rate if shown similar items: What this data science machine learning tells the business owner is that he should be showing individual customers similar products, which customer might not even heard about but which will suit him the most.
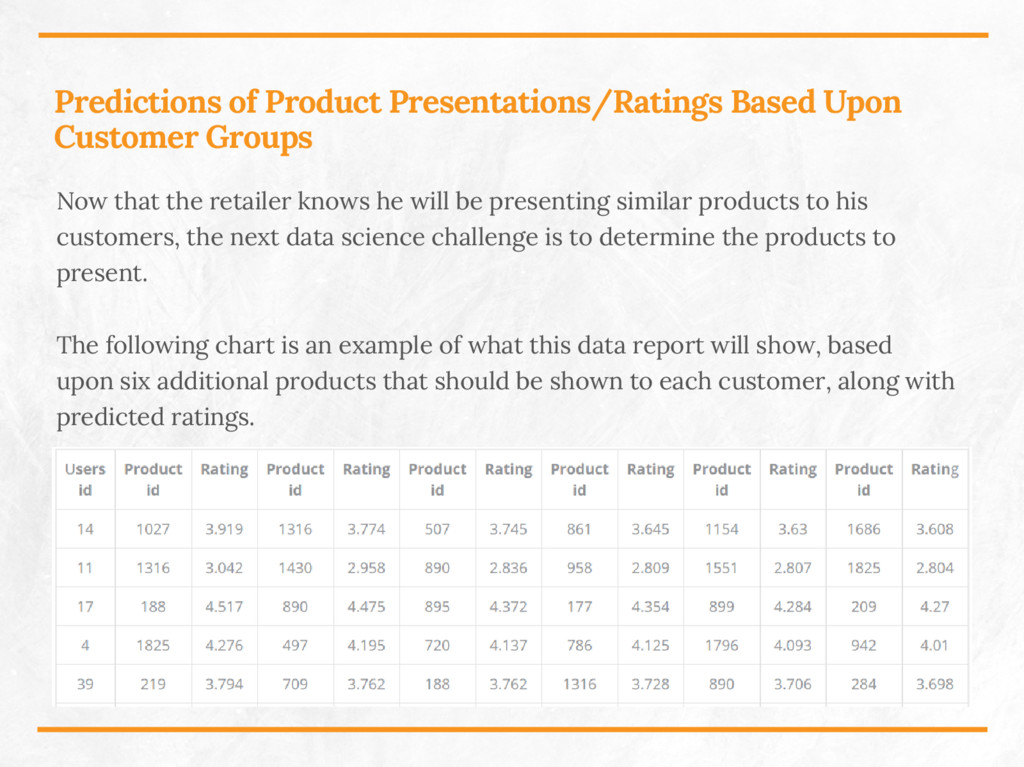
the retailer knows he will be presenting similar products to his customers, the next data science challenge is to determine the products to present. The following chart is an example of what this data report will show, based upon six additional products that should be shown to each customer, along with predicted ratings.
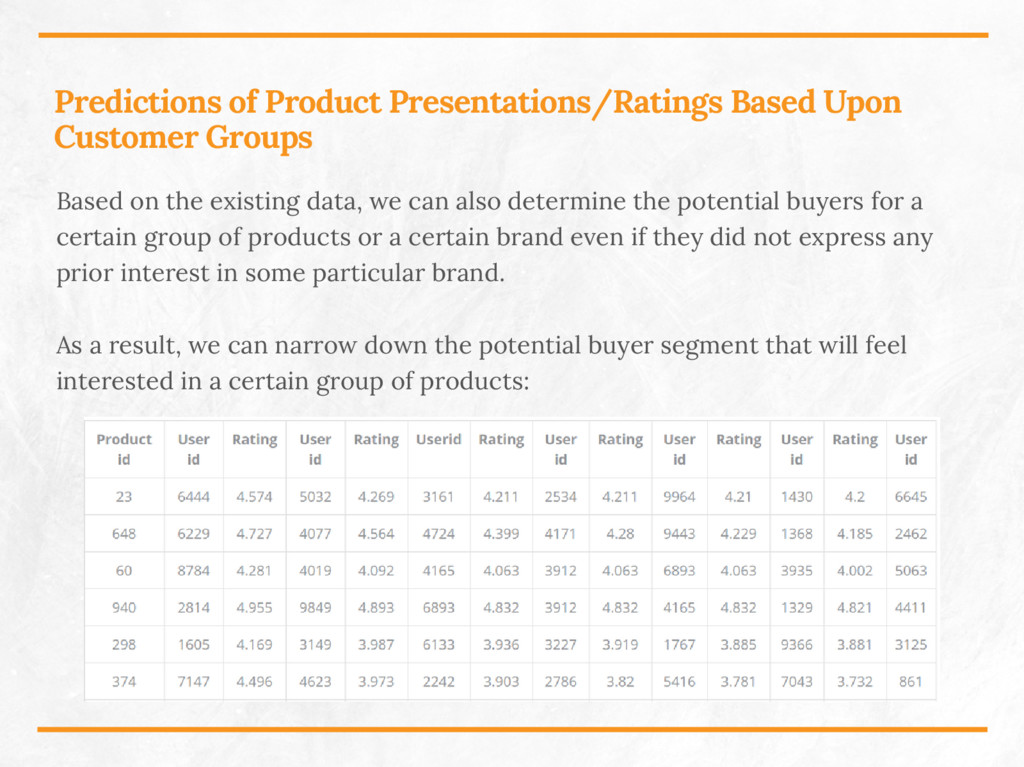
the existing data, we can also determine the potential buyers for a certain group of products or a certain brand even if they did not express any prior interest in some particular brand. As a result, we can narrow down the potential buyer segment that will feel interested in a certain group of products:
is simple: Customers’ who have completed specific purchases in the past, and those purchases have been similar to those of a group of customers, then future purchases can be predicted. Using real data of these purchases, and applying machine learning for data science, the business owner can customize and personalize (and direct) each customer’s experience and journey on his site.
for purchases by displaying a larger assortment of similar products to each customer – products the customer didn’t even realize were on the site and products that will suit customer’s needs the most.
accurately. The business owner can then better manage his inventory – something that will certainly help to grow business profits. The predictions can be as accurate as claiming that your company will sell 100- 120 Nike Air Max Model shoes with a 90% probability in the next week.
opportunity to determine the exact factors that may (or may not) impact the sales volumes. For instance, in most cases the frequency of visiting your website has no direct impact on the sales. Users may spend a lot of time browsing and comparing goods without committing to a purchase. While factors like age, seasonality and past record of purchases have a significant impact on the probability of a purchase.
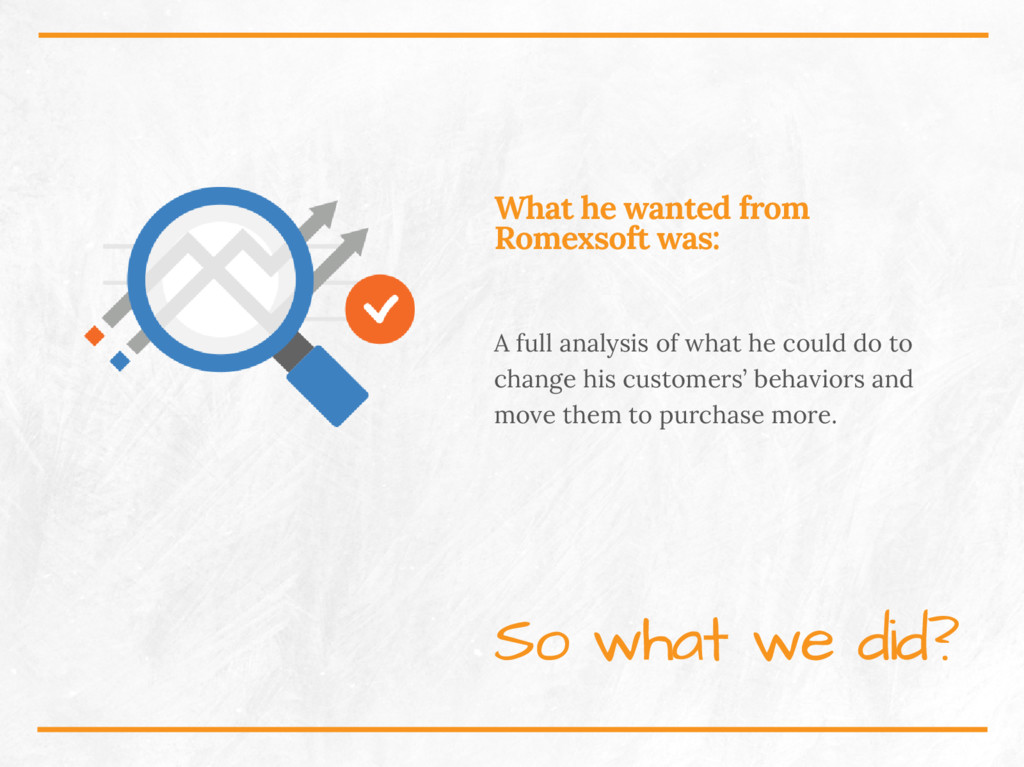
not growing as you should. Knowing why is another matter. And that is where business analytics comes in. It is a complex matter, but data science case studies continue to show that big data and machine learning can provide the answers. Romexsoft is ready to build a model for you, based upon your unique circumstances. Let’s discuss your problem today. So What Are Your Problems?