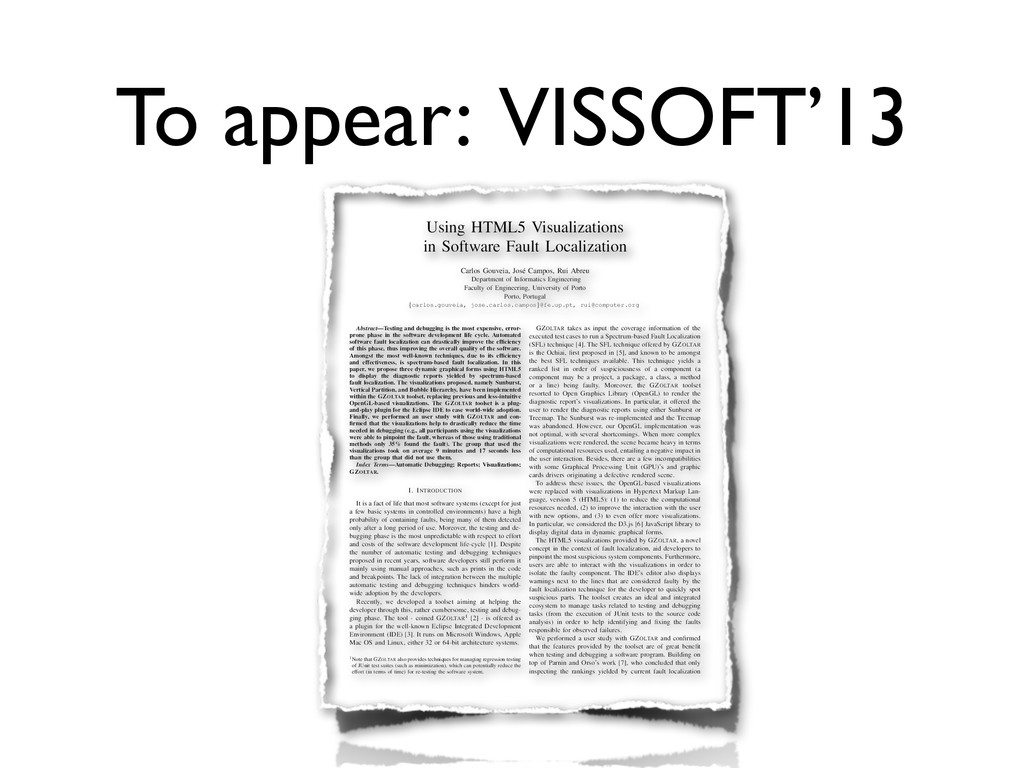
Carlos Gouveia, Jos´ e Campos, Rui Abreu Department of Informatics Engineering Faculty of Engineering, University of Porto Porto, Portugal {carlos.gouveia, jose.carlos.campos}@fe.up.pt,
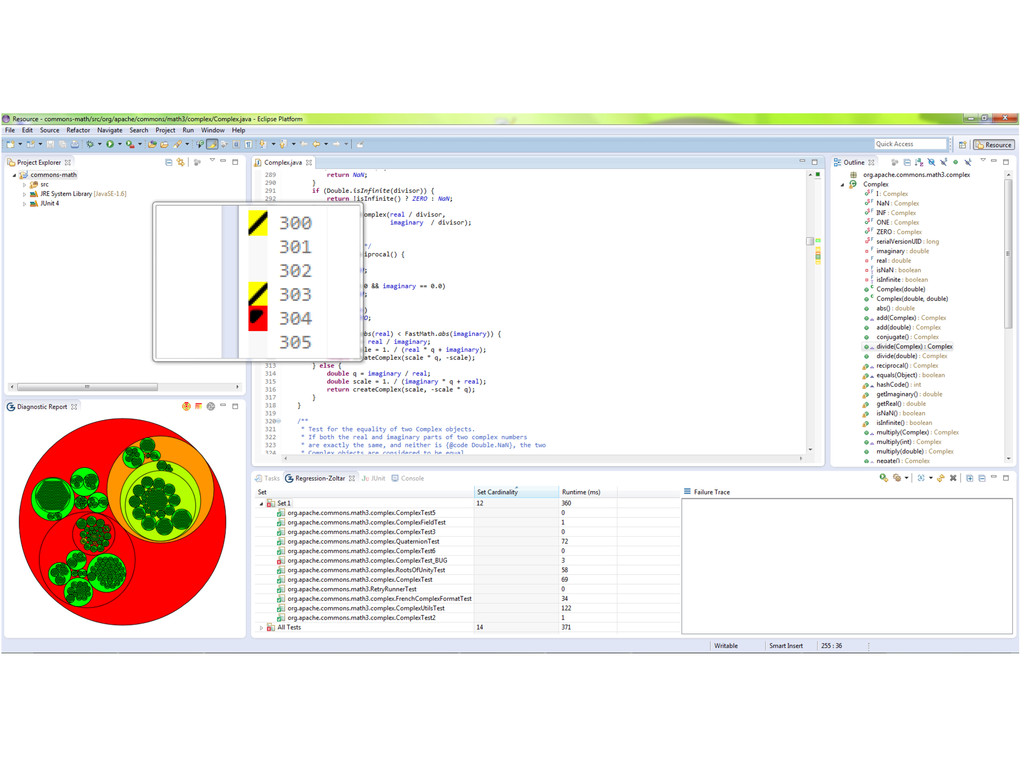
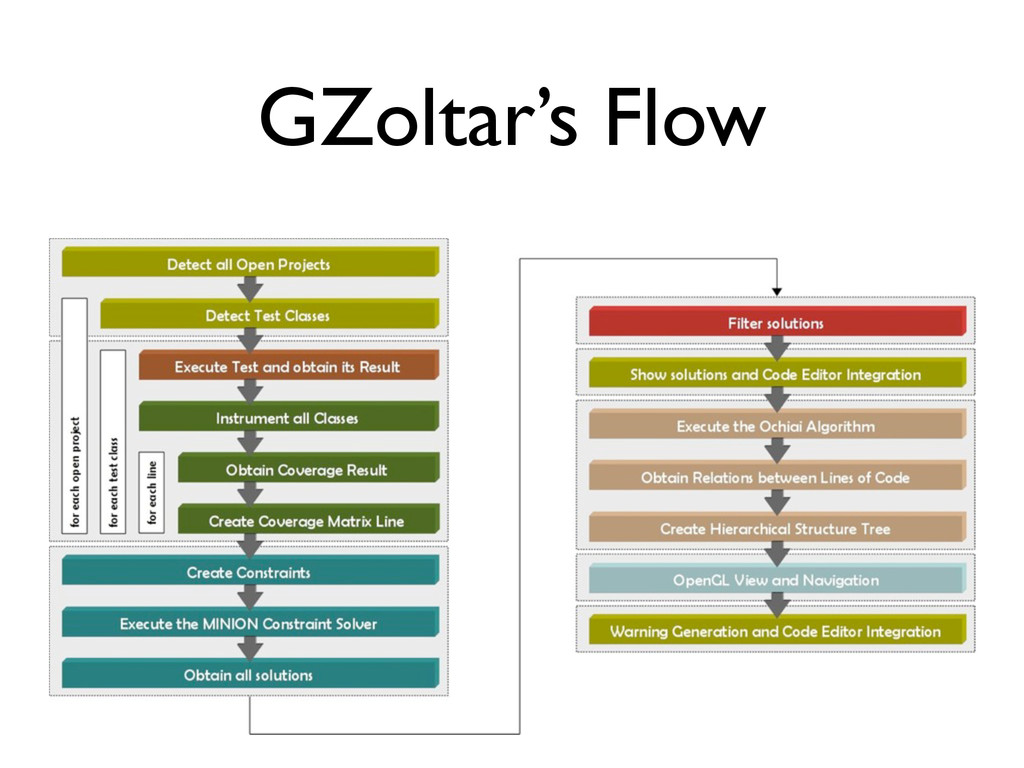
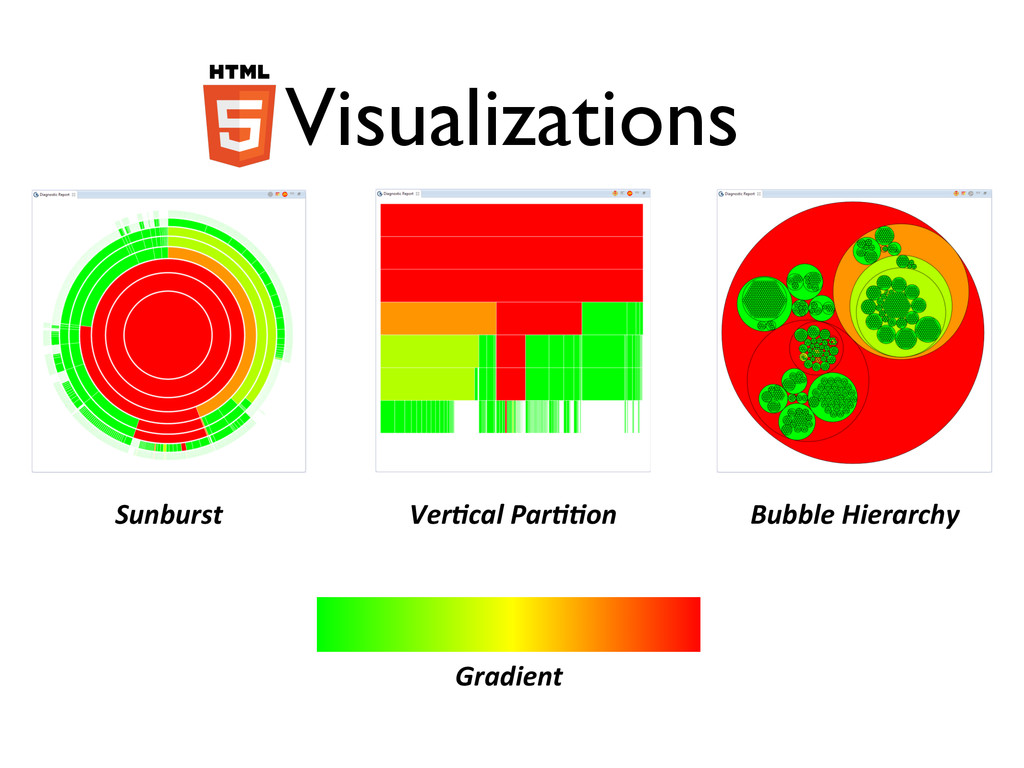
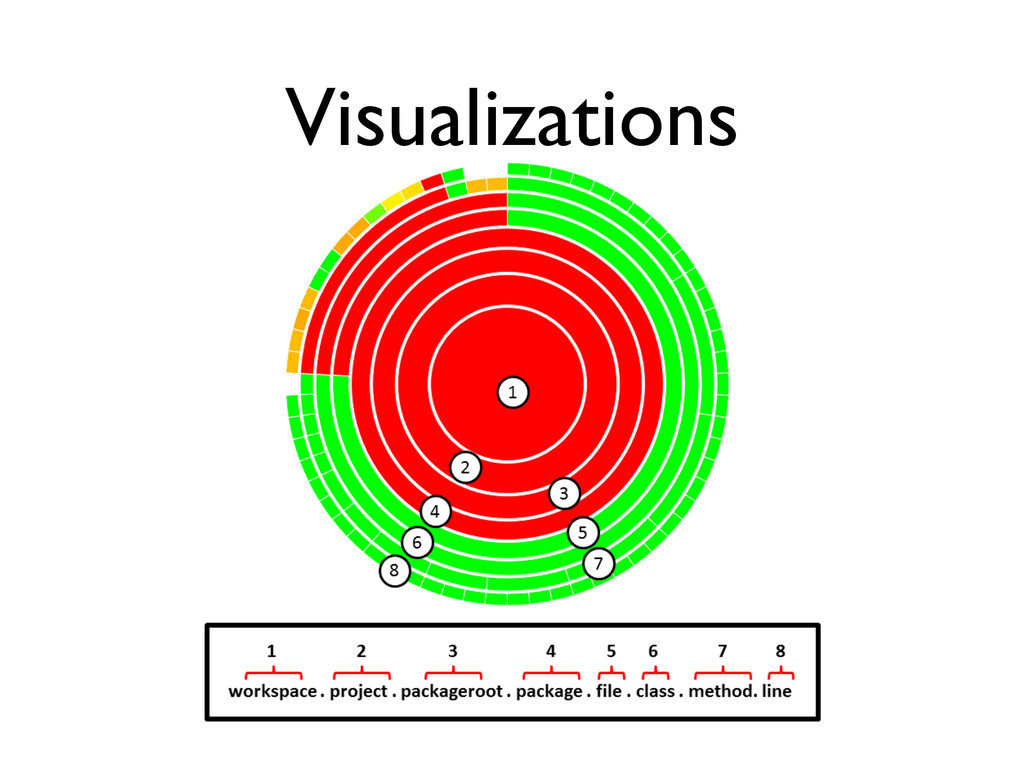
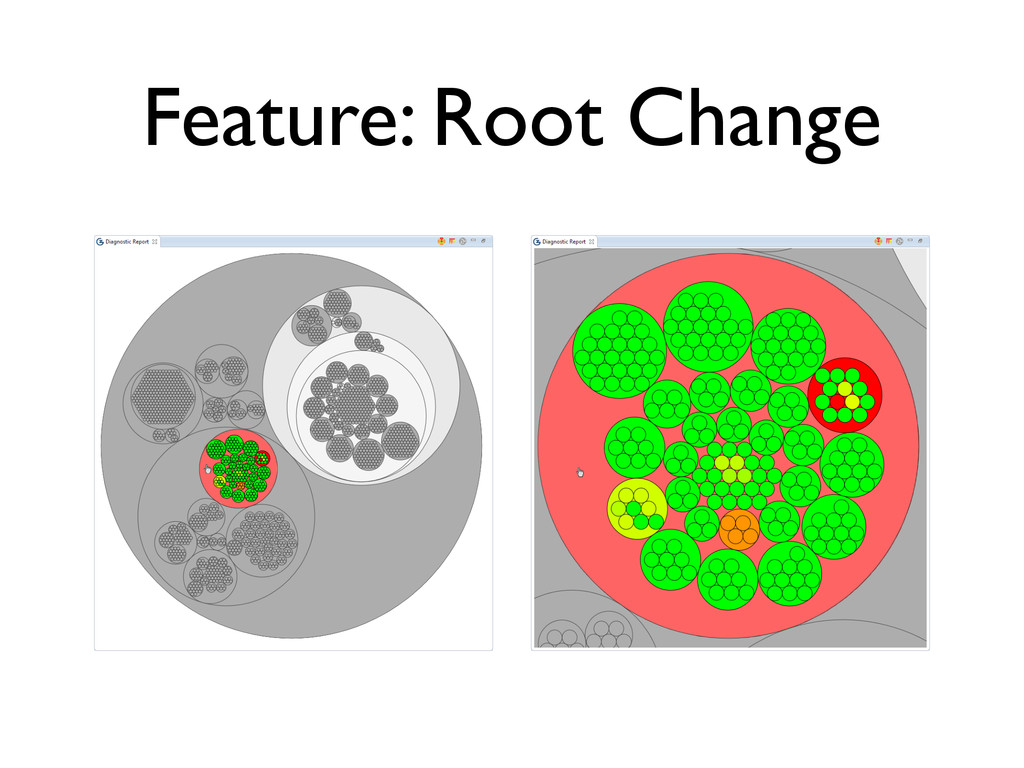
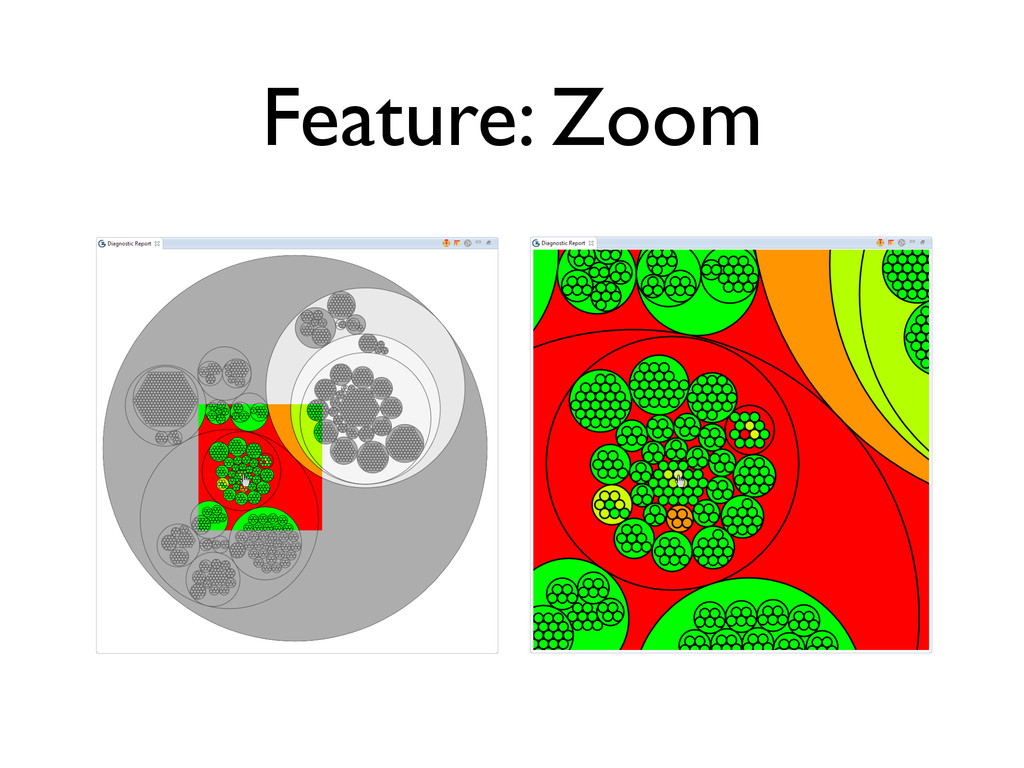
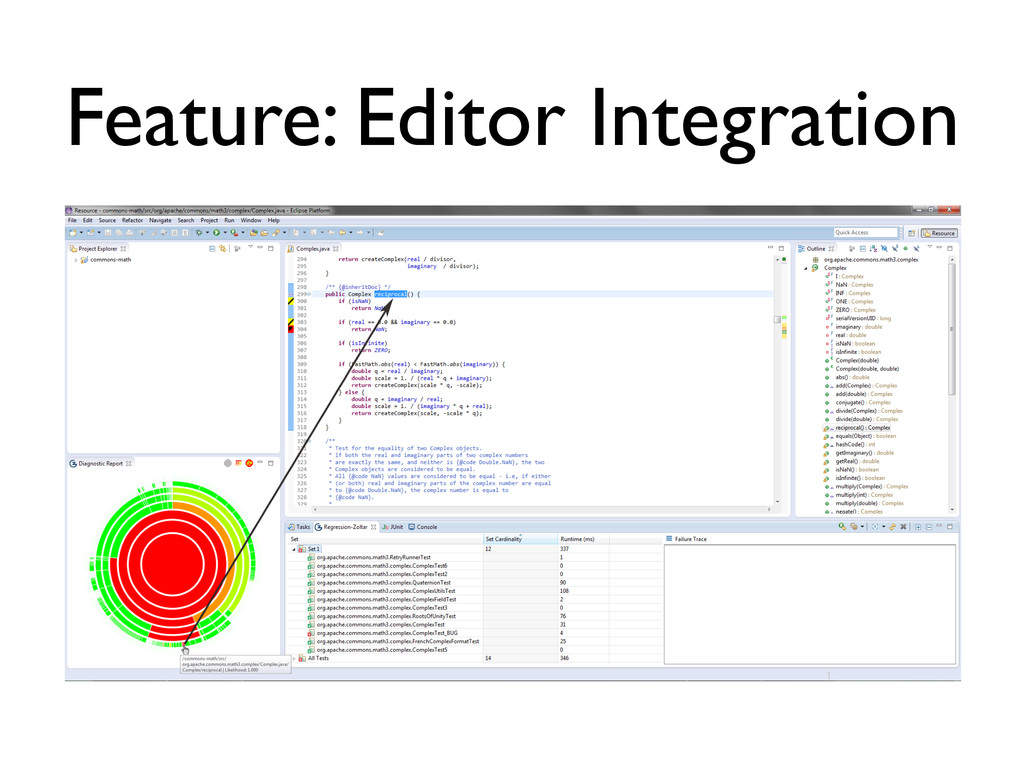
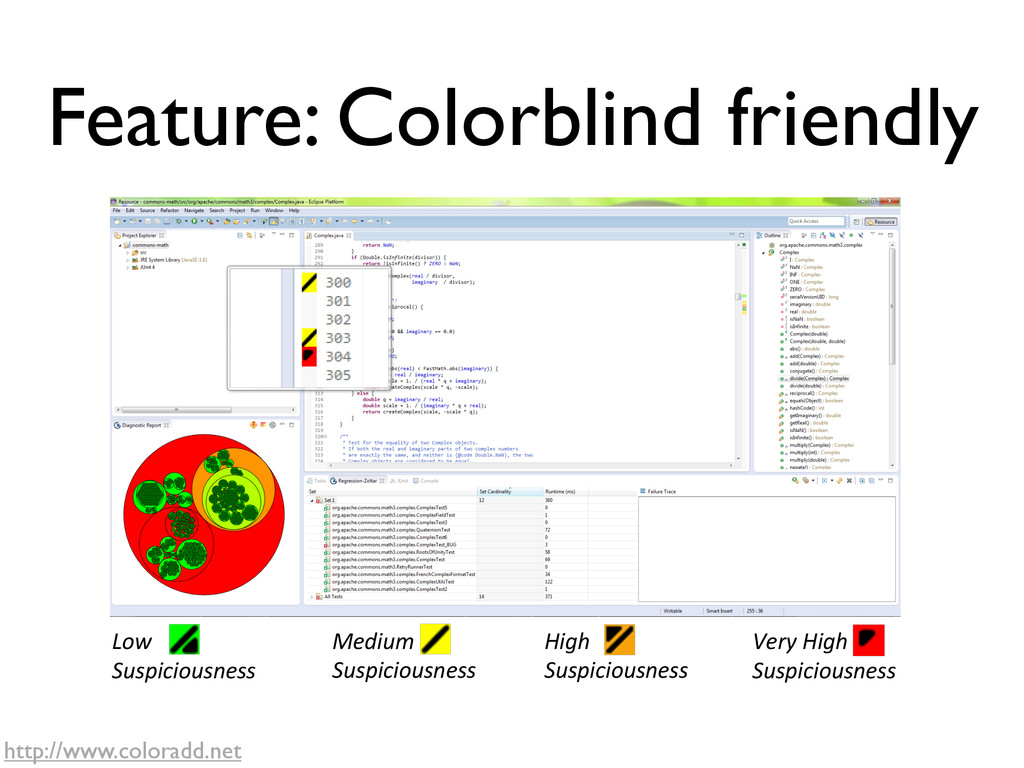
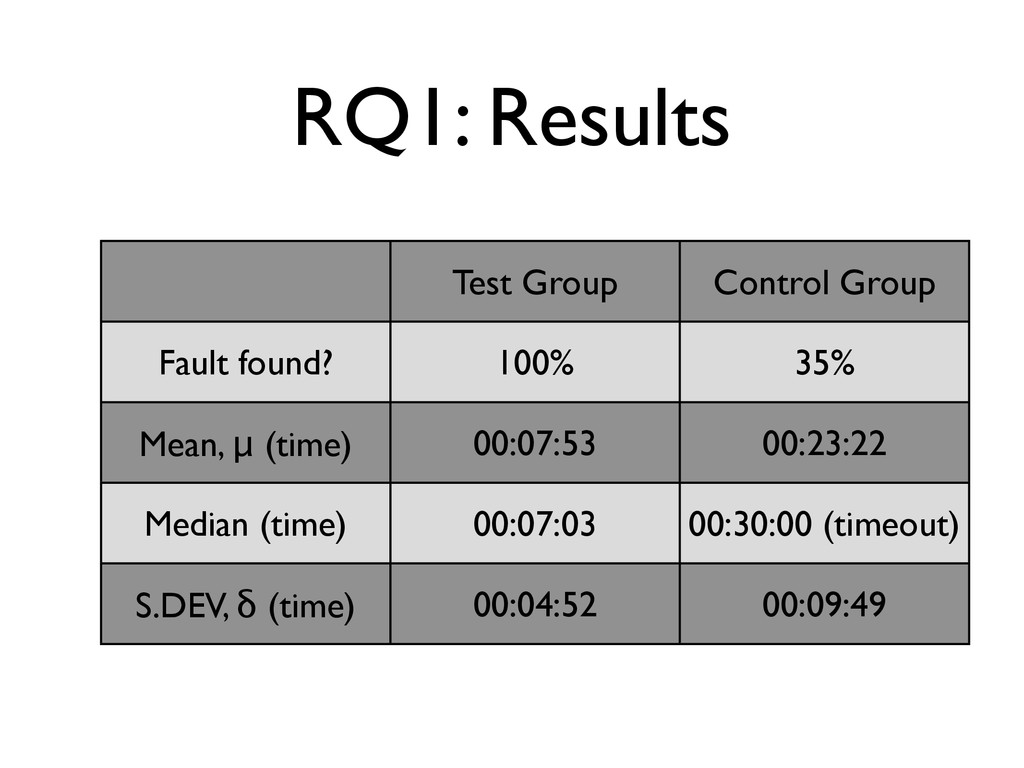
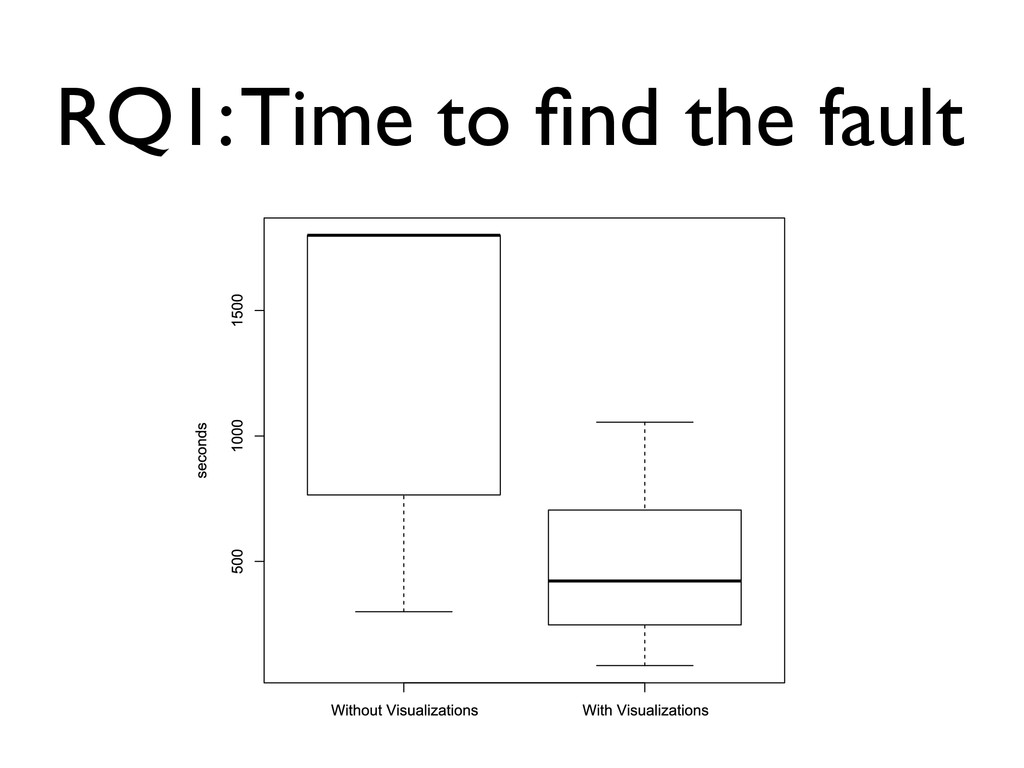
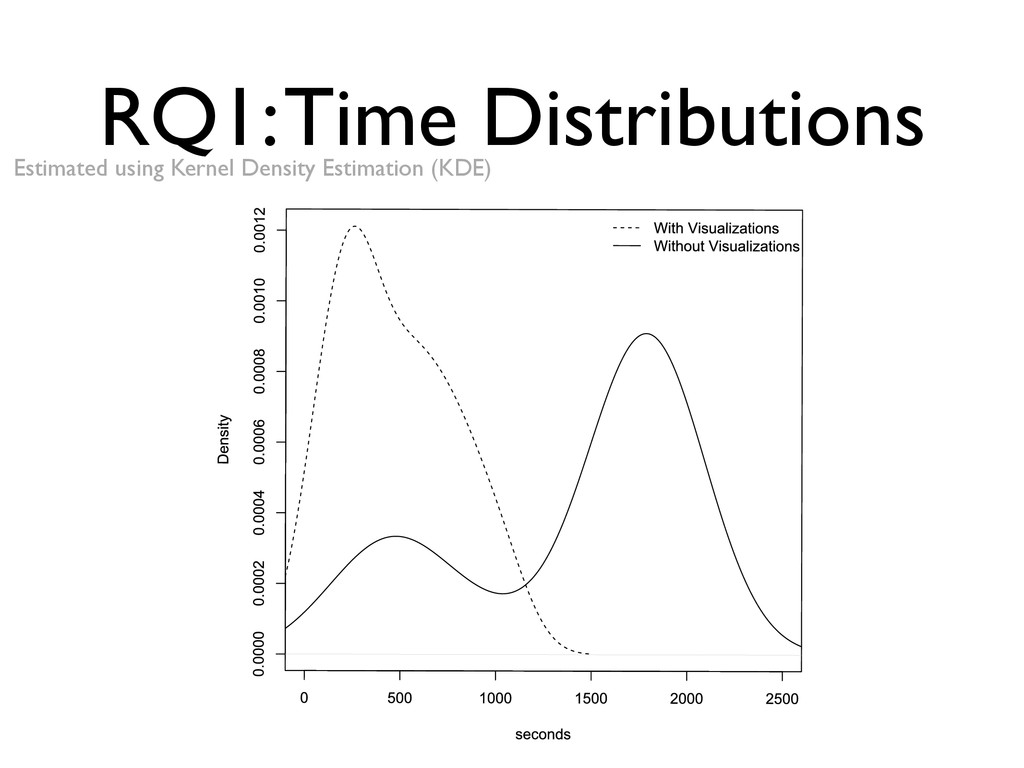
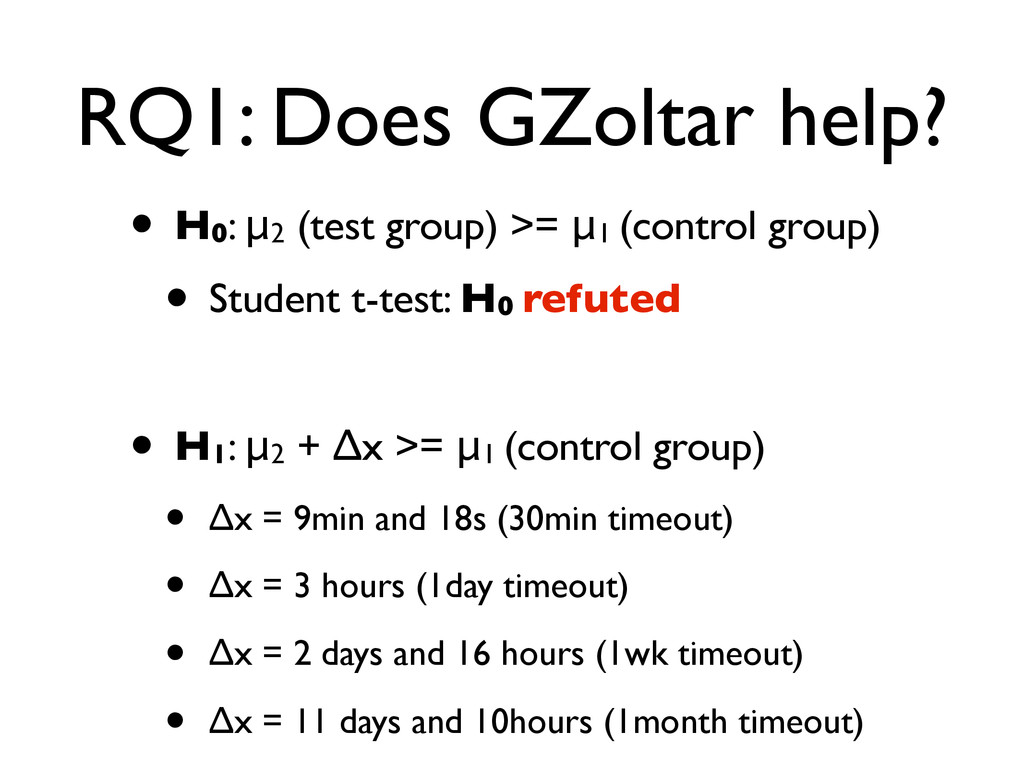
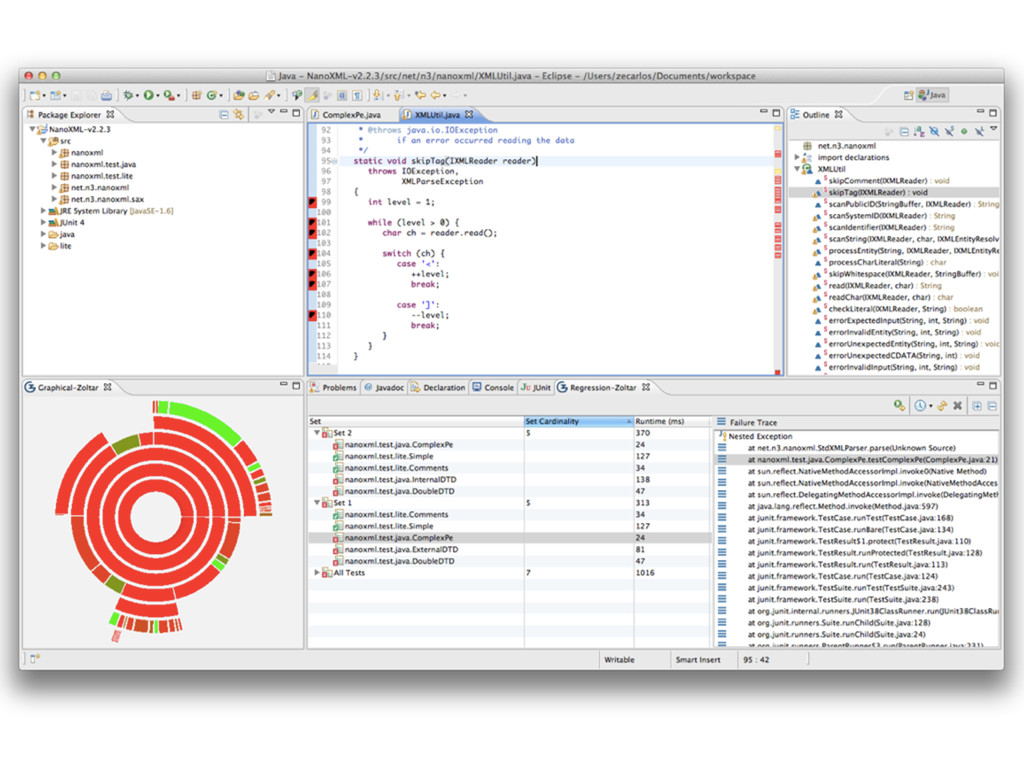
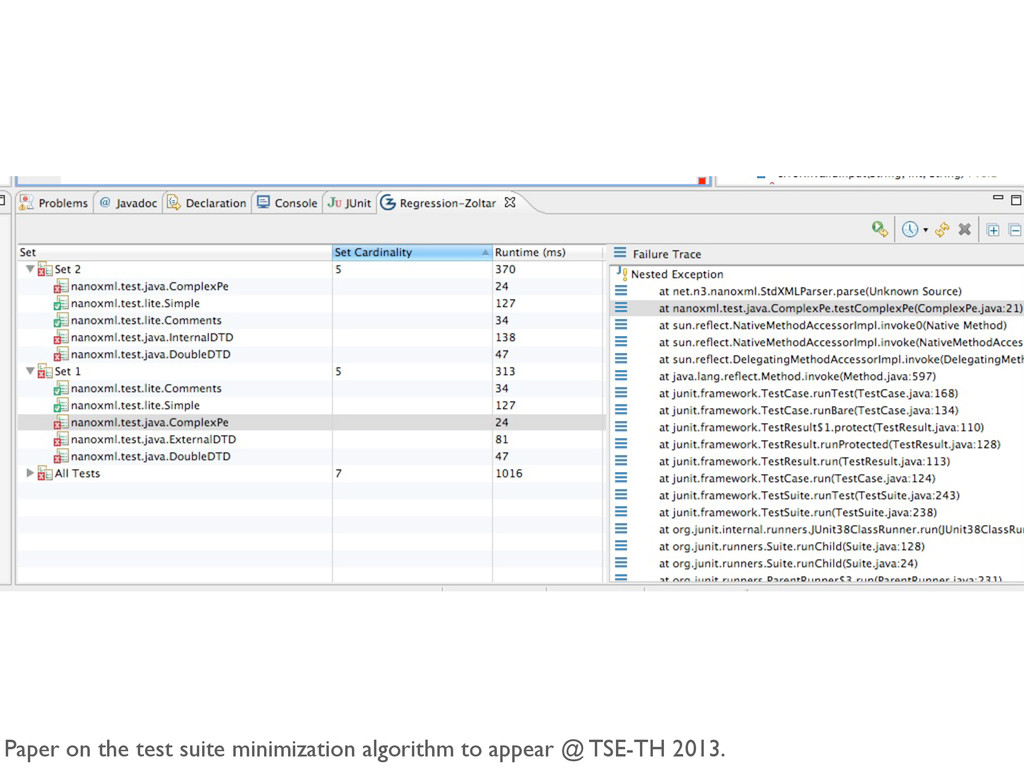
[email protected] Abstract —Testing and debugging is the most expensive, error- prone phase in the software development life cycle. Automated software fault localization can drastically improve the efficiency of this phase, thus improving the overall quality of the software. Amongst the most well-known techniques, due to its efficiency and effectiveness, is spectrum-based fault localization. In this paper, we propose three dynamic graphical forms using HTML5 to display the diagnostic reports yielded by spectrum-based fault localization. The visualizations proposed, namely Sunburst, Vertical Partition, and Bubble Hierarchy, have been implemented within the GZOLTAR toolset, replacing previous and less-intuitive OpenGL-based visualizations. The GZOLTAR toolset is a plug- and-play plugin for the Eclipse IDE to ease world-wide adoption. Finally, we performed an user study with GZOLTAR and con- firmed that the visualizations help to drastically reduce the time needed in debugging (e.g., all participants using the visualizations were able to pinpoint the fault, whereas of those using traditional methods only 35% found the fault). The group that used the visualizations took on average 9 minutes and 17 seconds less than the group that did not use them. Index Terms —Automatic Debugging; Reports; Visualizations; GZOLTAR. I. INTRODUCTION It is a fact of life that most software systems (except for just a few basic systems in controlled environments) have a high probability of containing faults, being many of them detected only after a long period of use. Moreover, the testing and de- bugging phase is the most unpredictable with respect to effort and costs of the software development life-cycle [1]. Despite the number of automatic testing and debugging techniques proposed in recent years, software developers still perform it mainly using manual approaches, such as prints in the code and breakpoints. The lack of integration between the multiple automatic testing and debugging techniques hinders world- wide adoption by the developers. Recently, we developed a toolset aiming at helping the developer through this, rather cumbersome, testing and debug- ging phase. The tool - coined GZOLTAR1 [2] - is offered as a plugin for the well-known Eclipse Integrated Development Environment (IDE) [3]. It runs on Microsoft Windows, Apple Mac OS and Linux, either 32 or 64-bit architecture systems. 1Note that GZOLTAR also provides techniques for managing regression testing of JUnit test suites (such as minimization), which can potentially reduce the effort (in terms of time) for re-testing the software system. GZOLTAR takes as input the coverage information of the executed test cases to run a Spectrum-based Fault Localization (SFL) technique [4]. The SFL technique offered by GZOLTAR is the Ochiai, first proposed in [5], and known to be amongst the best SFL techniques available. This technique yields a ranked list in order of suspiciousness of a component (a component may be a project, a package, a class, a method or a line) being faulty. Moreover, the GZOLTAR toolset resorted to Open Graphics Library (OpenGL) to render the diagnostic report’s visualizations. In particular, it offered the user to render the diagnostic reports using either Sunburst or Treemap. The Sunburst was re-implemented and the Treemap was abandoned. However, our OpenGL implementation was not optimal, with several shortcomings. When more complex visualizations were rendered, the scene became heavy in terms of computational resources used, entailing a negative impact in the user interaction. Besides, there are a few incompatibilities with some Graphical Processing Unit (GPU)’s and graphic cards drivers originating a defective rendered scene. To address these issues, the OpenGL-based visualizations were replaced with visualizations in Hypertext Markup Lan- guage, version 5 (HTML5): (1) to reduce the computational resources needed, (2) to improve the interaction with the user with new options, and (3) to even offer more visualizations. In particular, we considered the D3.js [6] JavaScript library to display digital data in dynamic graphical forms. The HTML5 visualizations provided by GZOLTAR, a novel concept in the context of fault localization, aid developers to pinpoint the most suspicious system components. Furthermore, users are able to interact with the visualizations in order to isolate the faulty component. The IDE’s editor also displays warnings next to the lines that are considered faulty by the fault localization technique for the developer to quickly spot suspicious parts. The toolset creates an ideal and integrated ecosystem to manage tasks related to testing and debugging tasks (from the execution of JUnit tests to the source code analysis) in order to help identifying and fixing the faults responsible for observed failures. We performed a user study with GZOLTAR and confirmed that the features provided by the toolset are of great benefit when testing and debugging a software program. Building on top of Parnin and Orso’s work [7], who concluded that only inspecting the rankings yielded by current fault localization