Upgrade to Pro — share decks privately, control downloads, hide ads and more …

Joint longitudinal and survival models for investigating the association between natural disasters and disability whilst accounting for non-random dropout due to death

Sam Brilleman
December 02, 2015

Joint longitudinal and survival models for investigating the association between natural disasters and disability whilst accounting for non-random dropout due to death

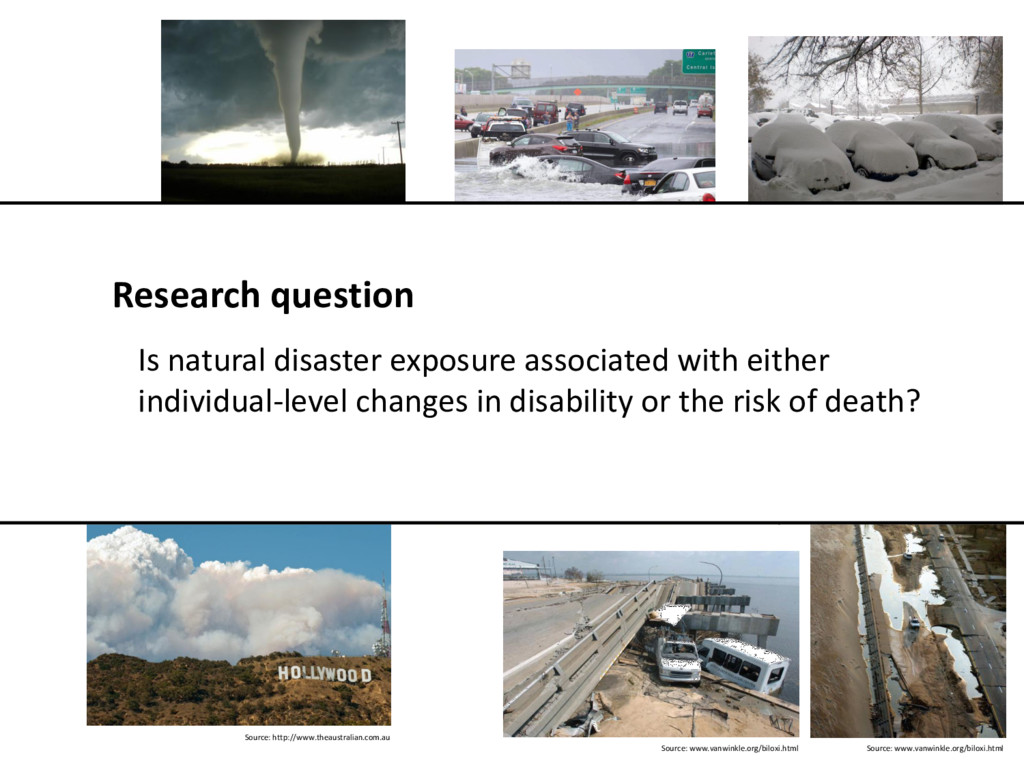
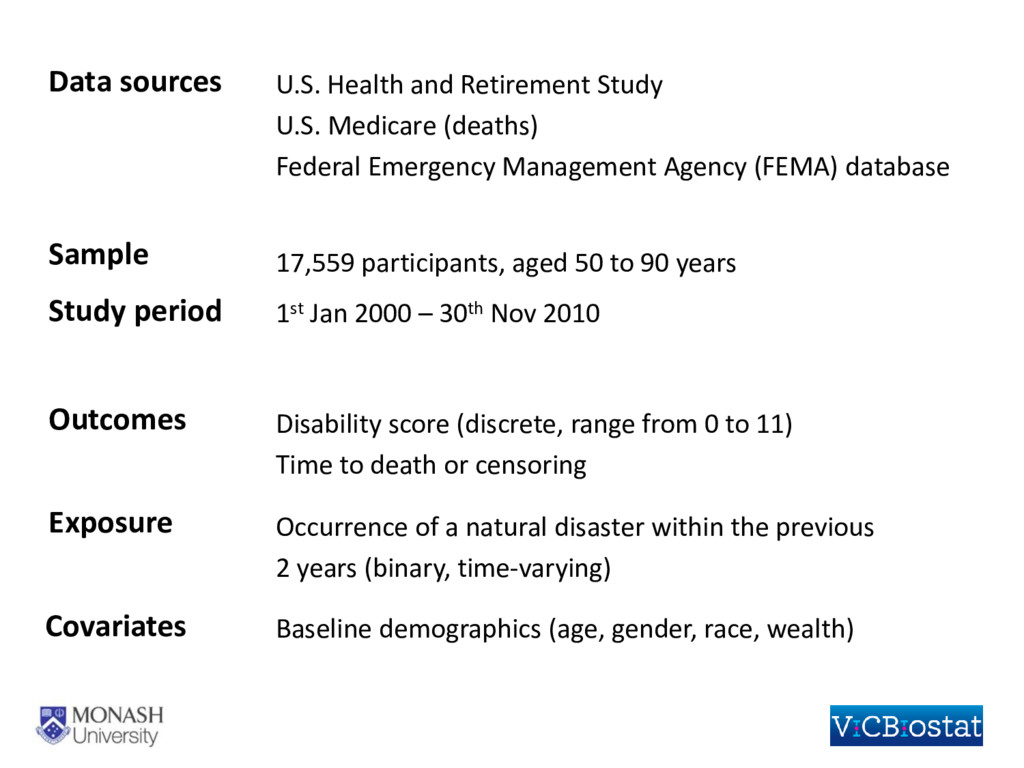
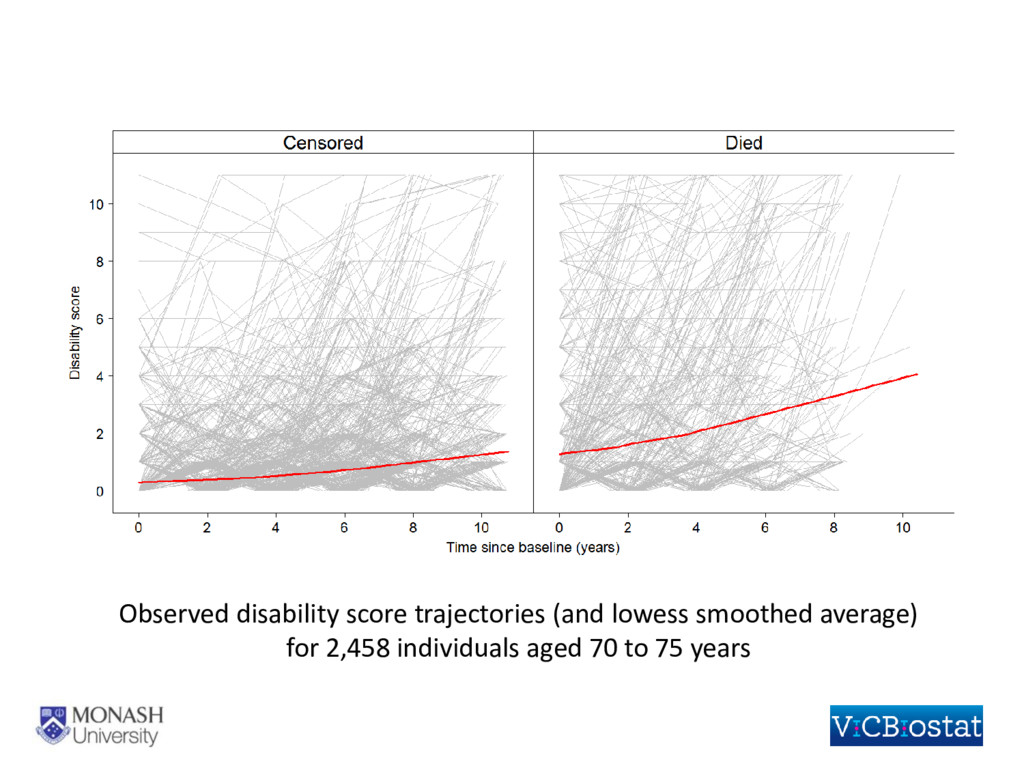
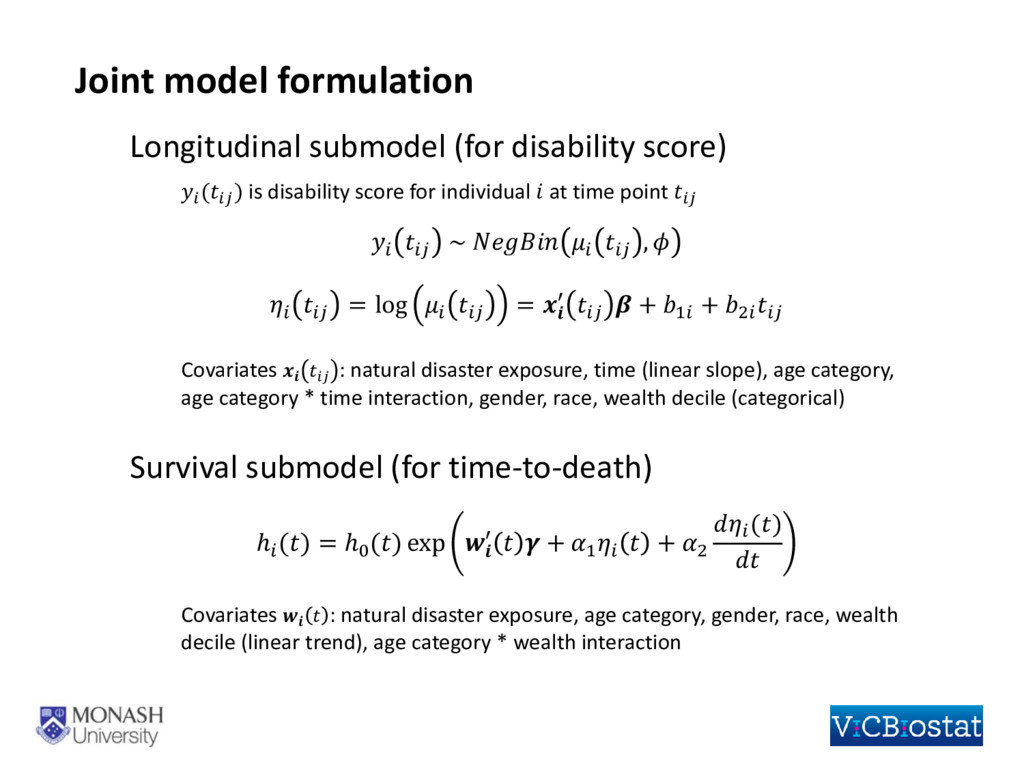
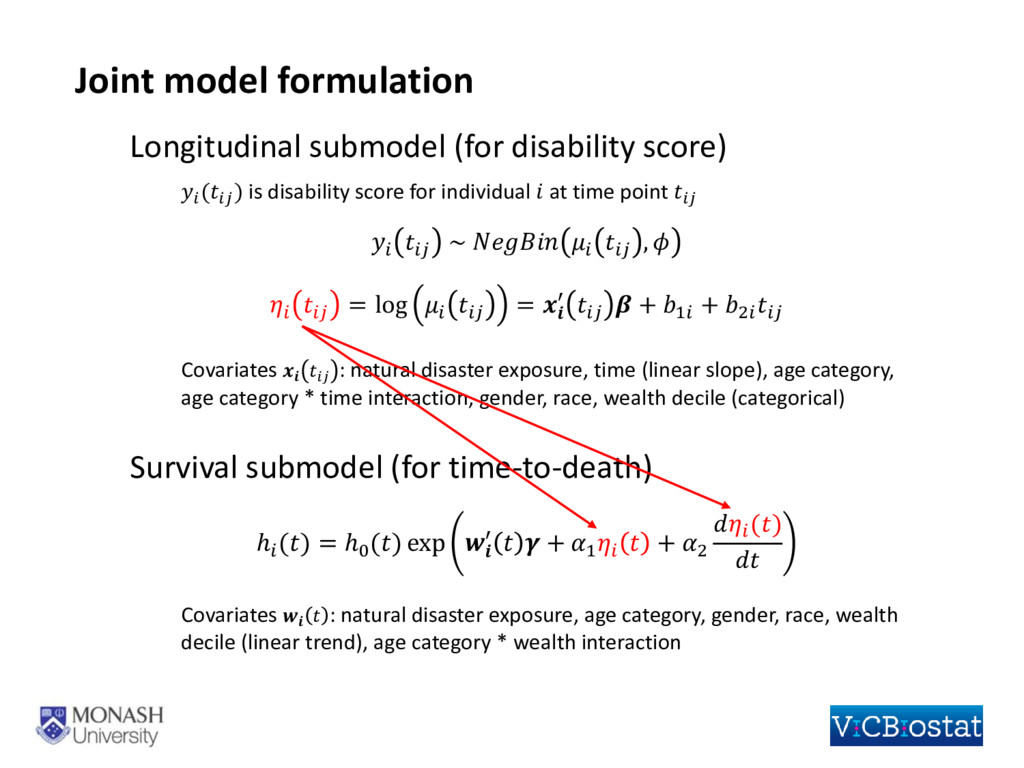
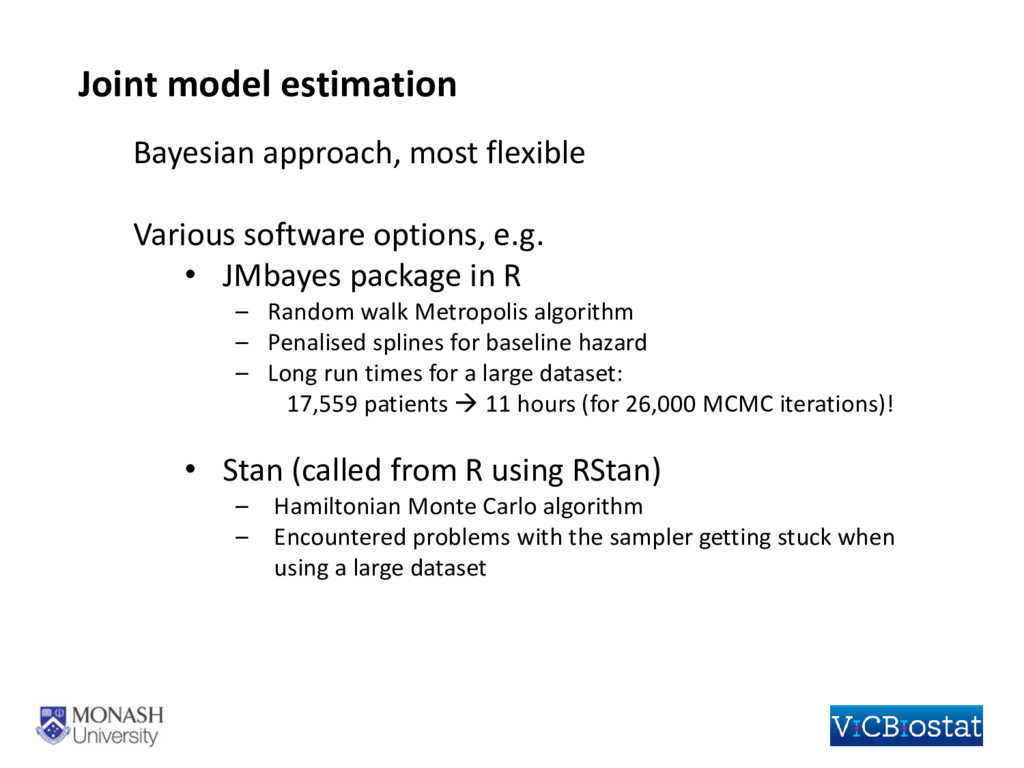
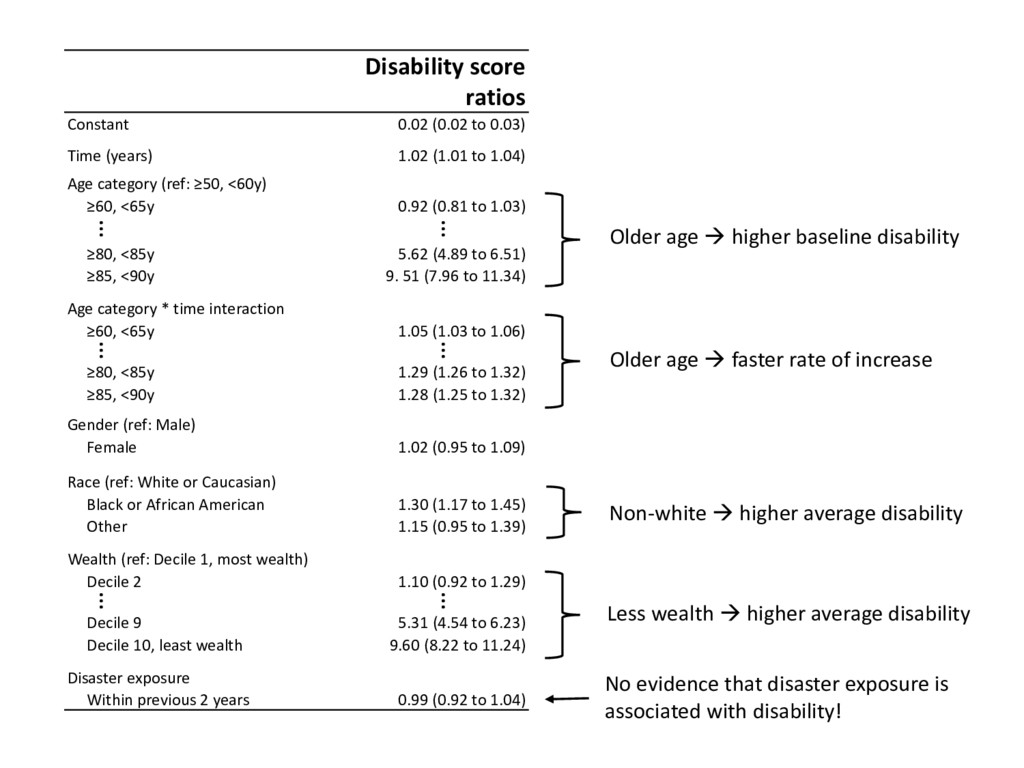
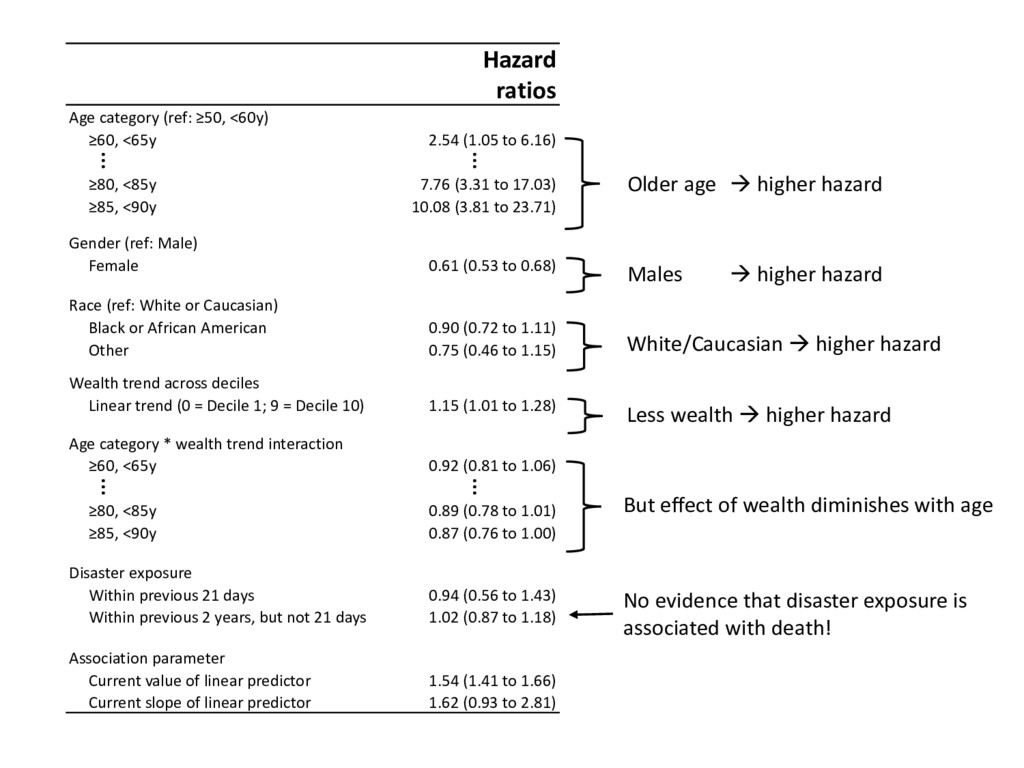
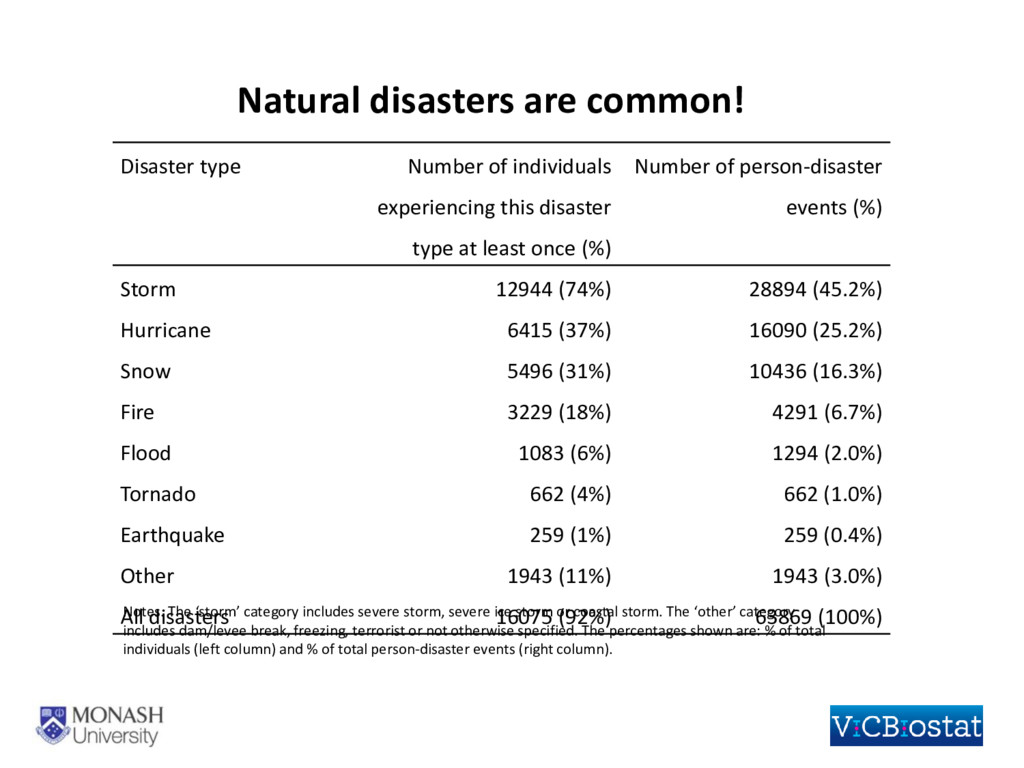
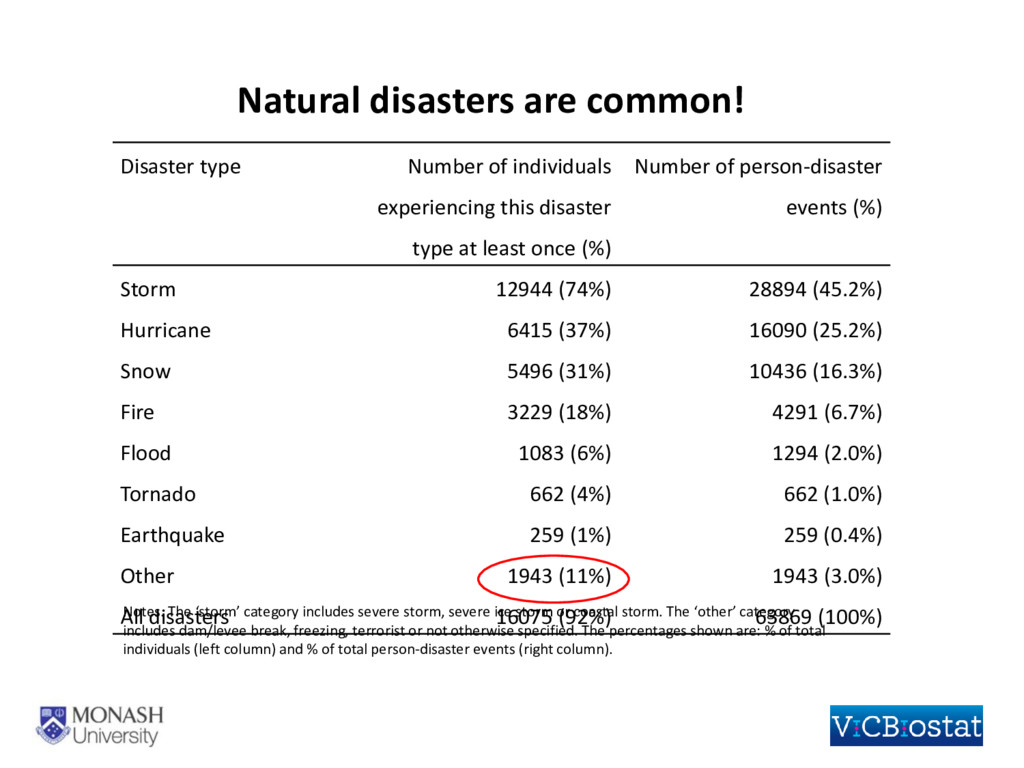
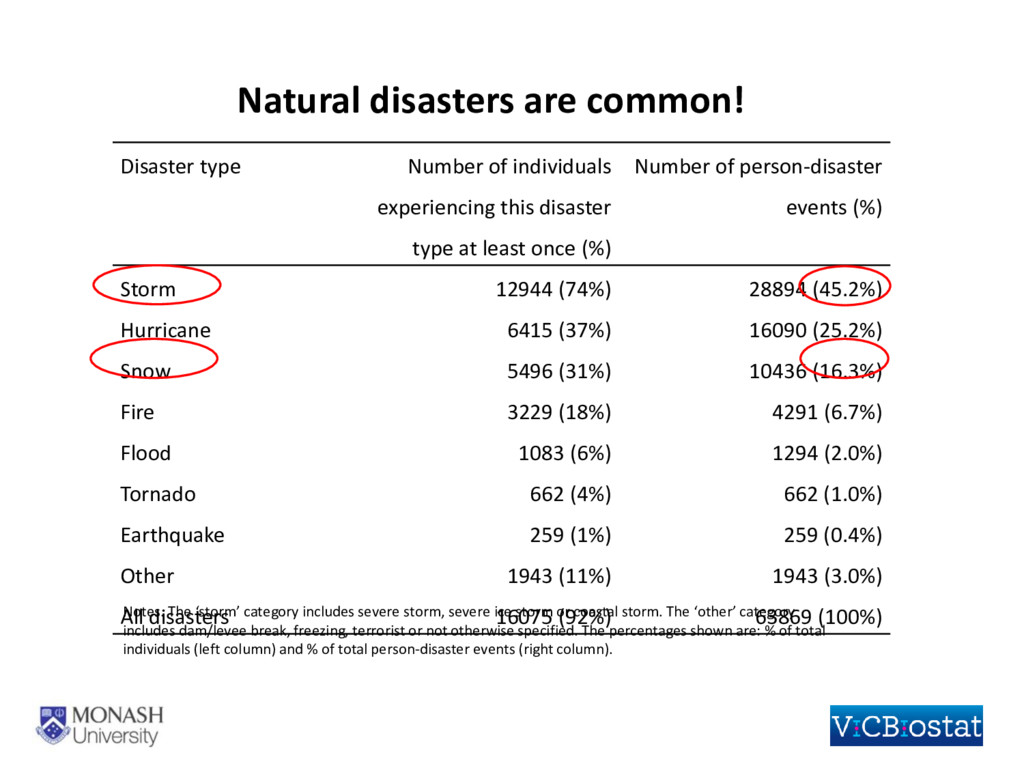
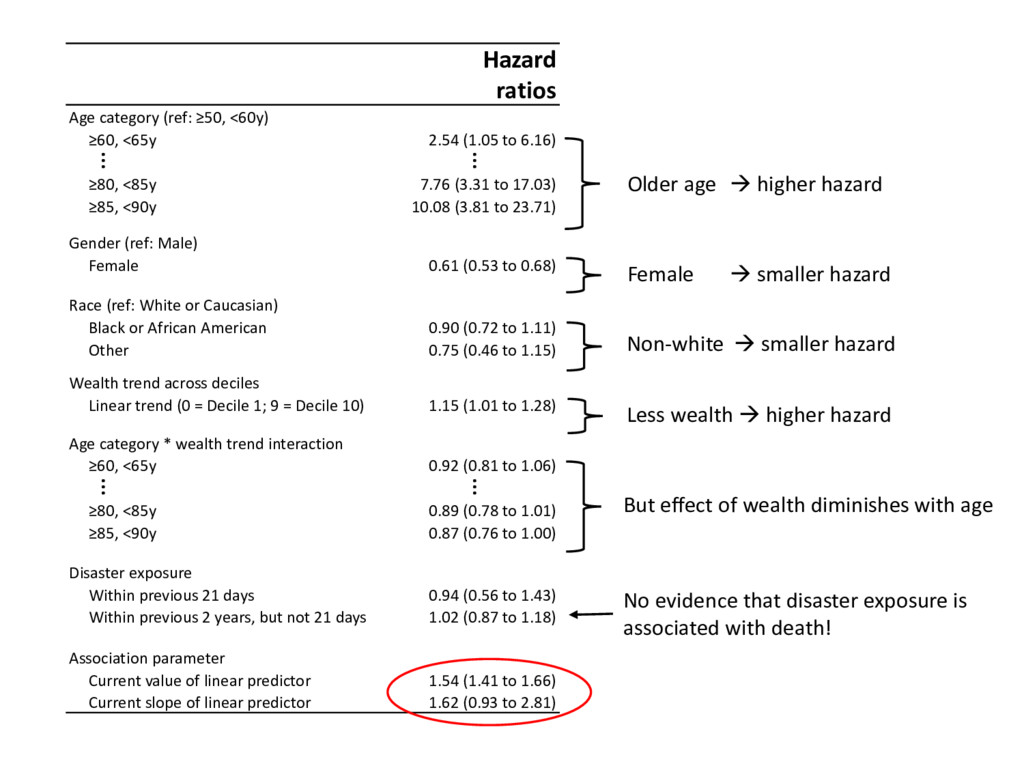
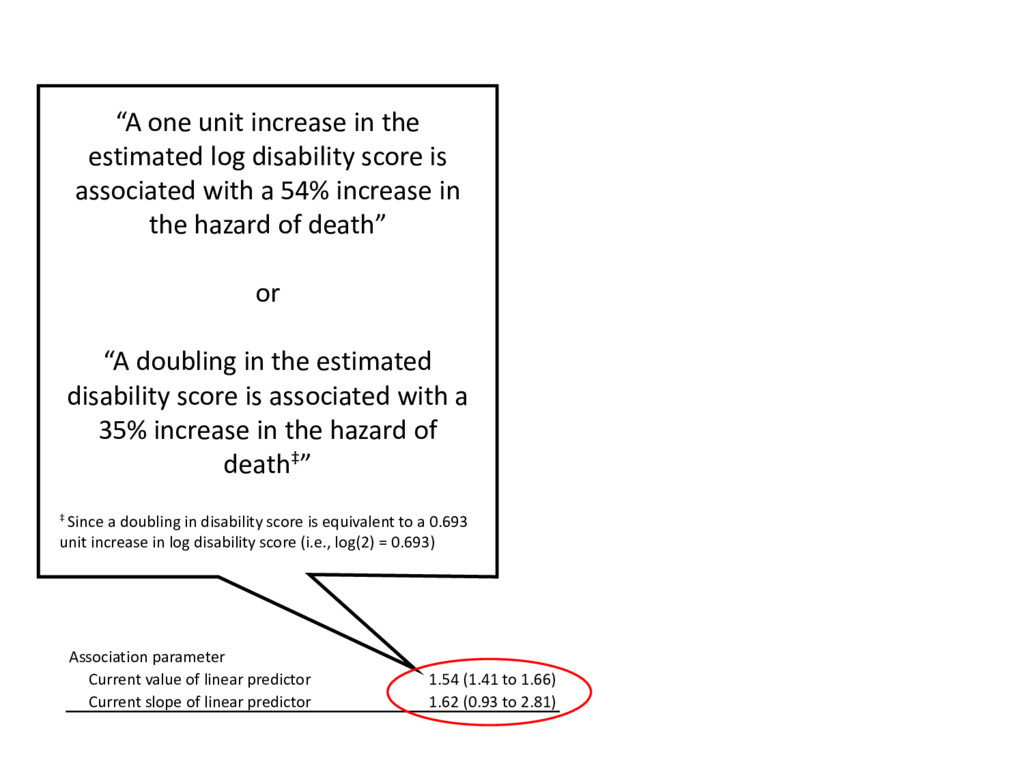
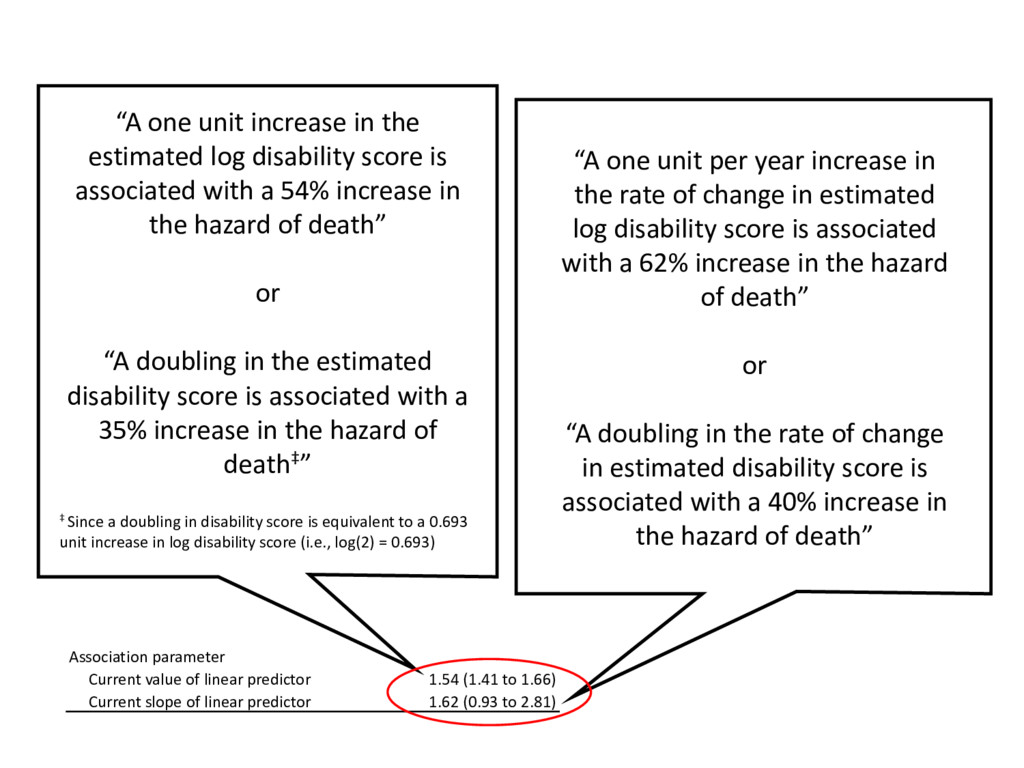
Joint modelling of longitudinal and survival (time-to-event) data has received significant attention in recent years, however much of the literature in this area has been methodological in nature. The use of joint models in applied research has been somewhat less evident. In this study we used a joint modelling approach to investigate the association between individual-level exposures to a natural disaster such as winter storm, flood, etc. and subsequent changes to physical disability, whilst accounting for non-random dropout due to death. Data for the study was based on a linked dataset containing 27,790 individuals who were interviewed at least once between 1st January 2000 and 1st December 2010 as part of the longitudinal ‘Health and Retirement Study’ in the United States. Disability was assessed using activities of daily living, measured on a discrete 12-point scale. Individual-level exposure to a natural disaster was identified at the county-level based on disaster funding received from the Federal Emergency Management Agency. Our joint model consisted of two submodels: (i) a negative-binomial mixed effects model with a log-link function for modelling the repeatedly measured disability scores and (ii) a proportional hazards model for time to death. The association between the two submodels can then be parameterised in various ways. We investigate the association between disaster exposure and disability using a time-varying exposure covariate which can be included in either one or both of the submodels. We fit the joint models using a Bayesian approach, since this provides the greatest flexibility.

Sam Brilleman

December 02, 2015
Tweet

More Decks by Sam Brilleman

Other Decks in Research

Transcript

  1. Joint longitudinal and survival models: associations between natural disasters exposure,

    disability and death Sam Brilleman1,2, Theodore J. Iwashyna3, Margarita Moreno-Betancur1,2,4, Rory Wolfe1,2 International Biometric Society Australasian Conference 2nd December 2015 1 Monash University 2 Victorian Centre for Biostatistics (ViCBiostat) 3 University of Michigan 4 Murdoch Childrens Research Institute
  2. Source: www.flickr.com/photos/kevharb/4199300356/in/photostream Source: www.vanwinkle.org/biloxi.html Source: www.vanwinkle.org/biloxi.html Credit: Steve Craven. Source:

    http://mercymedical.org Credit: Ed Betz. Source: www.usatoday.com Source: http://www.theaustralian.com.au Source: www.noaa.gov
  3. Source: www.flickr.com/photos/kevharb/4199300356/in/photostream Source: www.vanwinkle.org/biloxi.html Source: www.vanwinkle.org/biloxi.html Credit: Steve Craven. Source:

    http://mercymedical.org Credit: Ed Betz. Source: www.usatoday.com Source: http://www.theaustralian.com.au Source: www.noaa.gov Research question Is natural disaster exposure associated with either individual-level changes in disability or the risk of death?
  4. Data sources U.S. Health and Retirement Study U.S. Medicare (deaths)

    Federal Emergency Management Agency (FEMA) database 17,559 participants, aged 50 to 90 years 1st Jan 2000 – 30th Nov 2010 Disability score (discrete, range from 0 to 11) Time to death or censoring Occurrence of a natural disaster within the previous 2 years (binary, time-varying) Baseline demographics (age, gender, race, wealth) Study period Sample Outcomes Exposure Covariates
  5. Longitudinal submodel (for disability score) ( ) is disability score

    for individual at time point ~ , = log = ′ + 1 + 2 Covariates : natural disaster exposure, time (linear slope), age category, age category * time interaction, gender, race, wealth decile (categorical) Joint model formulation Survival submodel (for time-to-death) ℎ () = ℎ0 () exp ′ + 1 + 2 () Covariates : natural disaster exposure, age category, gender, race, wealth decile (linear trend), age category * wealth interaction
  6. Longitudinal submodel (for disability score) ( ) is disability score

    for individual at time point ~ , = log = ′ + 1 + 2 Covariates : natural disaster exposure, time (linear slope), age category, age category * time interaction, gender, race, wealth decile (categorical) Joint model formulation Survival submodel (for time-to-death) ℎ () = ℎ0 () exp ′ + 1 + 2 () Covariates : natural disaster exposure, age category, gender, race, wealth decile (linear trend), age category * wealth interaction
  7. Joint model estimation Bayesian approach, most flexible Various software options,

    e.g. • JMbayes package in R – Random walk Metropolis algorithm – Penalised splines for baseline hazard – Long run times for a large dataset: 17,559 patients  11 hours (for 26,000 MCMC iterations)! • Stan (called from R using RStan) – Hamiltonian Monte Carlo algorithm – Encountered problems with the sampler getting stuck when using a large dataset
  8. Older age  higher baseline disability Non-white  higher average

    disability Less wealth  higher average disability No evidence that disaster exposure is associated with disability! Older age  faster rate of increase Disability score ratios Constant 0.02 (0.02 to 0.03) Time (years) 1.02 (1.01 to 1.04) Age category (ref: ≥50, <60y) ≥60, <65y 0.92 (0.81 to 1.03) … … ≥80, <85y 5.62 (4.89 to 6.51) ≥85, <90y 9. 51 (7.96 to 11.34) Age category * time interaction ≥60, <65y 1.05 (1.03 to 1.06) … … ≥80, <85y 1.29 (1.26 to 1.32) ≥85, <90y 1.28 (1.25 to 1.32) Gender (ref: Male) Female 1.02 (0.95 to 1.09) Race (ref: White or Caucasian) Black or African American 1.30 (1.17 to 1.45) Other 1.15 (0.95 to 1.39) Wealth (ref: Decile 1, most wealth) Decile 2 1.10 (0.92 to 1.29) … … Decile 9 5.31 (4.54 to 6.23) Decile 10, least wealth 9.60 (8.22 to 11.24) Disaster exposure Within previous 2 years 0.99 (0.92 to 1.04)
  9. Older age  higher hazard But effect of wealth diminishes

    with age No evidence that disaster exposure is associated with death! Males  higher hazard White/Caucasian  higher hazard Less wealth  higher hazard Hazard ratios Age category (ref: ≥50, <60y) ≥60, <65y 2.54 (1.05 to 6.16) … … ≥80, <85y 7.76 (3.31 to 17.03) ≥85, <90y 10.08 (3.81 to 23.71) Gender (ref: Male) Female 0.61 (0.53 to 0.68) Race (ref: White or Caucasian) Black or African American 0.90 (0.72 to 1.11) Other 0.75 (0.46 to 1.15) Wealth trend across deciles Linear trend (0 = Decile 1; 9 = Decile 10) 1.15 (1.01 to 1.28) Age category * wealth trend interaction ≥60, <65y 0.92 (0.81 to 1.06) … … ≥80, <85y 0.89 (0.78 to 1.01) ≥85, <90y 0.87 (0.76 to 1.00) Disaster exposure Within previous 21 days 0.94 (0.56 to 1.43) Within previous 2 years, but not 21 days 1.02 (0.87 to 1.18) Association parameter Current value of linear predictor 1.54 (1.41 to 1.66) Current slope of linear predictor 1.62 (0.93 to 2.81)
  10. Natural disasters are common! Disaster type Number of individuals experiencing

    this disaster type at least once (%) Number of person-disaster events (%) Storm 12944 (74%) 28894 (45.2%) Hurricane 6415 (37%) 16090 (25.2%) Snow 5496 (31%) 10436 (16.3%) Fire 3229 (18%) 4291 (6.7%) Flood 1083 (6%) 1294 (2.0%) Tornado 662 (4%) 662 (1.0%) Earthquake 259 (1%) 259 (0.4%) Other 1943 (11%) 1943 (3.0%) All disasters 16075 (92%) 63869 (100%) Notes. The ‘storm’ category includes severe storm, severe ice storm or coastal storm. The ‘other’ category includes dam/levee break, freezing, terrorist or not otherwise specified. The percentages shown are: % of total individuals (left column) and % of total person-disaster events (right column).
  11. Disaster type Number of individuals experiencing this disaster type at

    least once (%) Number of person-disaster events (%) Storm 12944 (74%) 28894 (45.2%) Hurricane 6415 (37%) 16090 (25.2%) Snow 5496 (31%) 10436 (16.3%) Fire 3229 (18%) 4291 (6.7%) Flood 1083 (6%) 1294 (2.0%) Tornado 662 (4%) 662 (1.0%) Earthquake 259 (1%) 259 (0.4%) Other 1943 (11%) 1943 (3.0%) All disasters 16075 (92%) 63869 (100%) Notes. The ‘storm’ category includes severe storm, severe ice storm or coastal storm. The ‘other’ category includes dam/levee break, freezing, terrorist or not otherwise specified. The percentages shown are: % of total individuals (left column) and % of total person-disaster events (right column). Natural disasters are common!
  12. Disaster type Number of individuals experiencing this disaster type at

    least once (%) Number of person-disaster events (%) Storm 12944 (74%) 28894 (45.2%) Hurricane 6415 (37%) 16090 (25.2%) Snow 5496 (31%) 10436 (16.3%) Fire 3229 (18%) 4291 (6.7%) Flood 1083 (6%) 1294 (2.0%) Tornado 662 (4%) 662 (1.0%) Earthquake 259 (1%) 259 (0.4%) Other 1943 (11%) 1943 (3.0%) All disasters 16075 (92%) 63869 (100%) Notes. The ‘storm’ category includes severe storm, severe ice storm or coastal storm. The ‘other’ category includes dam/levee break, freezing, terrorist or not otherwise specified. The percentages shown are: % of total individuals (left column) and % of total person-disaster events (right column). Natural disasters are common!
  13. Older age  higher hazard But effect of wealth diminishes

    with age No evidence that disaster exposure is associated with death! Female  smaller hazard Non-white  smaller hazard Less wealth  higher hazard Hazard ratios Age category (ref: ≥50, <60y) ≥60, <65y 2.54 (1.05 to 6.16) … … ≥80, <85y 7.76 (3.31 to 17.03) ≥85, <90y 10.08 (3.81 to 23.71) Gender (ref: Male) Female 0.61 (0.53 to 0.68) Race (ref: White or Caucasian) Black or African American 0.90 (0.72 to 1.11) Other 0.75 (0.46 to 1.15) Wealth trend across deciles Linear trend (0 = Decile 1; 9 = Decile 10) 1.15 (1.01 to 1.28) Age category * wealth trend interaction ≥60, <65y 0.92 (0.81 to 1.06) … … ≥80, <85y 0.89 (0.78 to 1.01) ≥85, <90y 0.87 (0.76 to 1.00) Disaster exposure Within previous 21 days 0.94 (0.56 to 1.43) Within previous 2 years, but not 21 days 1.02 (0.87 to 1.18) Association parameter Current value of linear predictor 1.54 (1.41 to 1.66) Current slope of linear predictor 1.62 (0.93 to 2.81)
  14. Association parameter Current value of linear predictor 1.54 (1.41 to

    1.66) Current slope of linear predictor 1.62 (0.93 to 2.81) “A one unit increase in the estimated log disability score is associated with a 54% increase in the hazard of death” or “A doubling in the estimated disability score is associated with a 35% increase in the hazard of death‡” ‡ Since a doubling in disability score is equivalent to a 0.693 unit increase in log disability score (i.e., log(2) = 0.693)
  15. Association parameter Current value of linear predictor 1.54 (1.41 to

    1.66) Current slope of linear predictor 1.62 (0.93 to 2.81) “A one unit increase in the estimated log disability score is associated with a 54% increase in the hazard of death” or “A doubling in the estimated disability score is associated with a 35% increase in the hazard of death‡” ‡ Since a doubling in disability score is equivalent to a 0.693 unit increase in log disability score (i.e., log(2) = 0.693) “A one unit per year increase in the rate of change in estimated log disability score is associated with a 62% increase in the hazard of death” or “A doubling in the rate of change in estimated disability score is associated with a 40% increase in the hazard of death”
  16. Conclusions Able to estimate the effect of disaster exposure on

    disability, even in the presence of non-random dropout due to death • i.e., disability data which was missing not at random (MNAR) Able to estimate the effect of disaster exposure on death, conditional on an individual’s underlying level of disability Able to quantify the association between disability and death in a (hopefully!) meaningful way