Upgrade to Pro — share decks privately, control downloads, hide ads and more …

Modeling Distributed Platforms from Application Traces for Realistic File Transfer Simulation

SciTech
January 13, 2017

Modeling Distributed Platforms from Application Traces for Realistic File Transfer Simulation

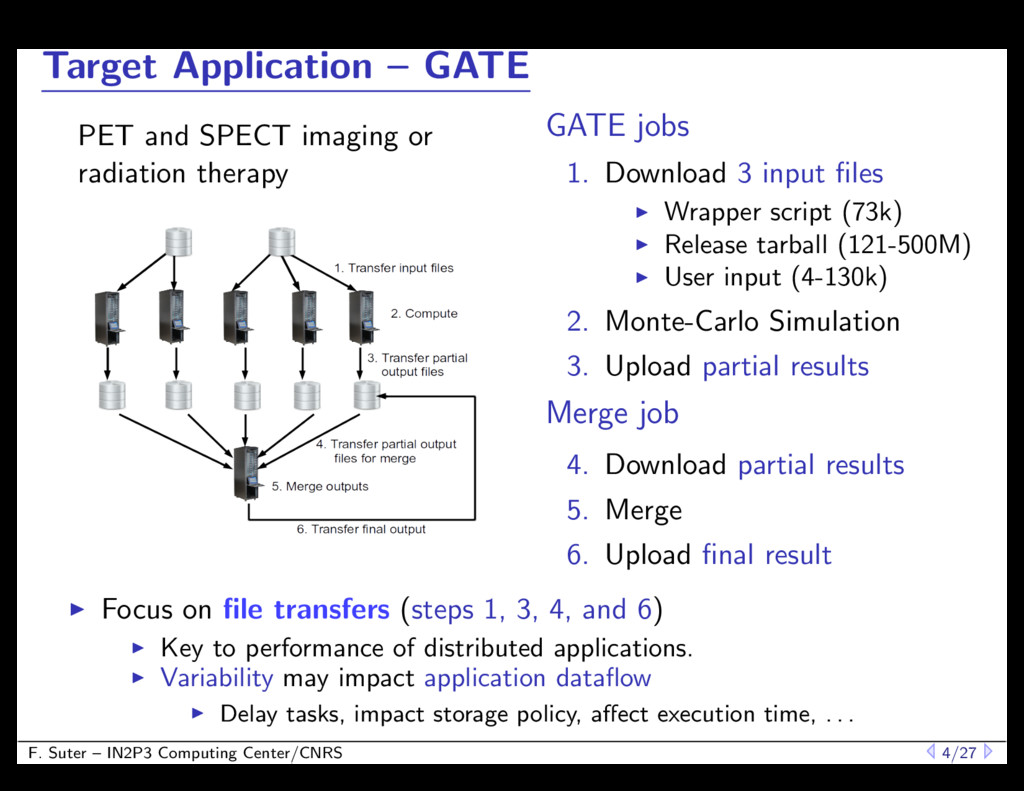
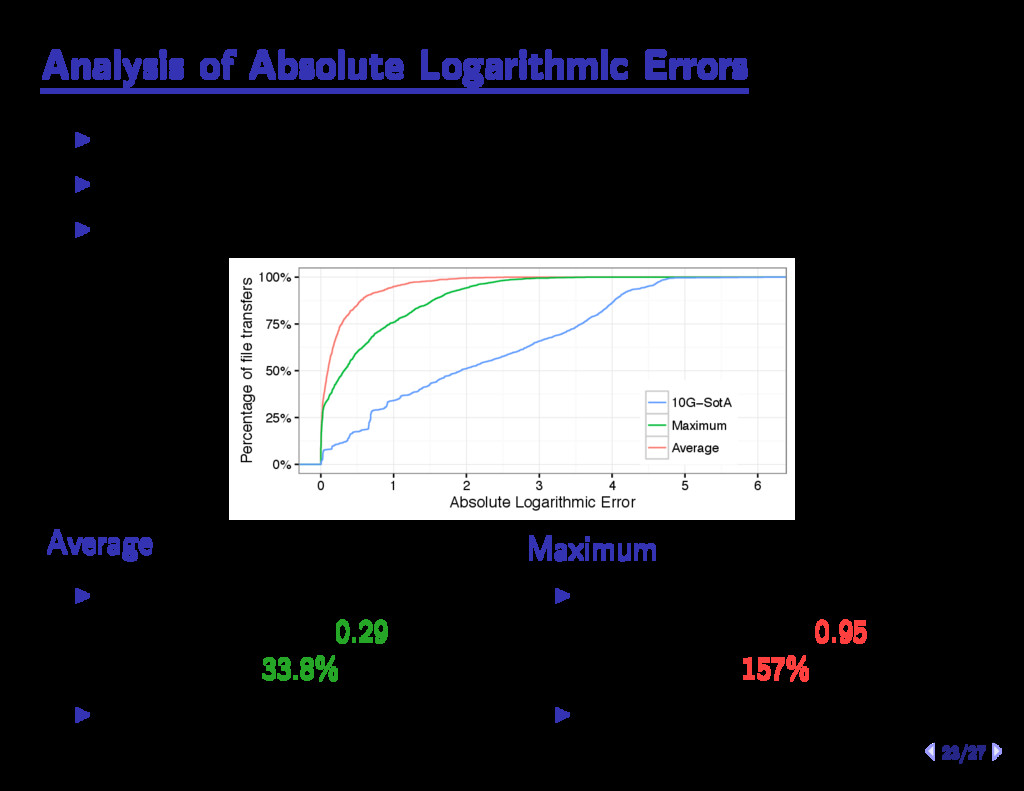
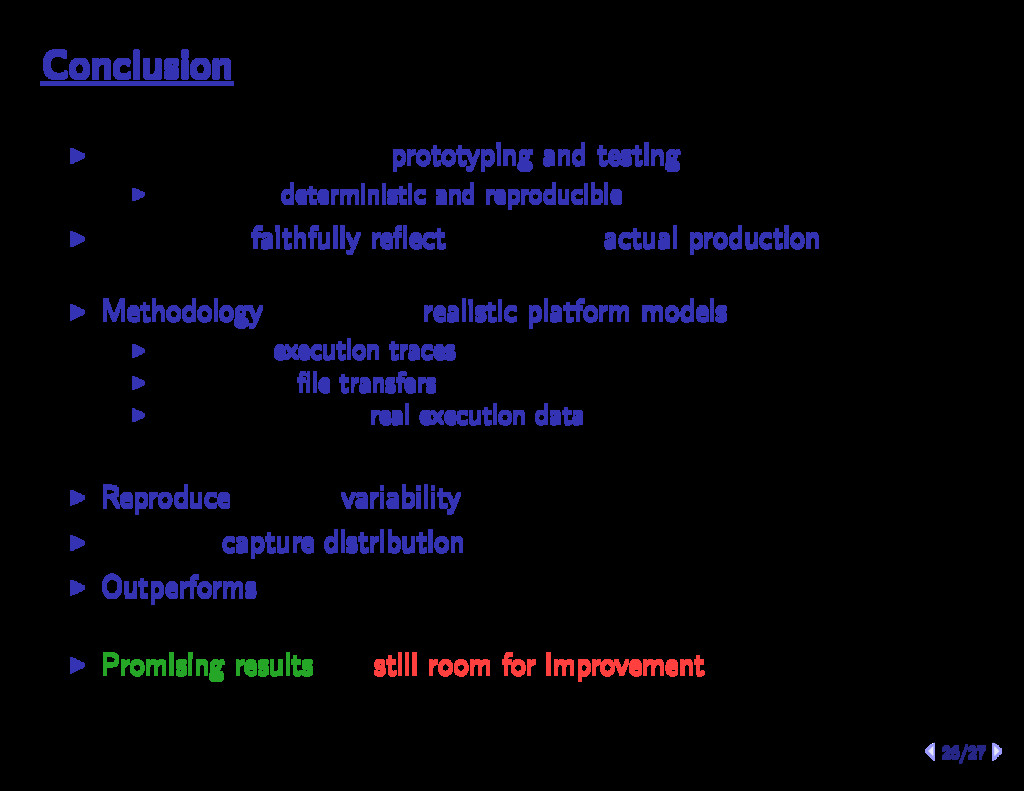
Simulation is a fast, controlled, and reproducible way to evaluate new algorithms for distributed computing platforms in a variety of conditions. However, the realism of simulations is rarely assessed, which critically questions the applicability of a whole range of findings. In this talk, I will present our efforts to build platform models from application traces, to allow for the accurate simulation of file transfers across a distributed infrastructure. File transfers are key to performance, as the variability of file transfer times has important consequences on the dataflow of the application. I will present a methodology to build realistic platform models from application traces and provide a quantitative evaluation of the accuracy of the derived simulations. Results will show that the proposed models are able to correctly capture real-life variability and significantly outperform a state-of-the-art platform model.

SciTech

January 13, 2017
Tweet

More Decks by SciTech

Other Decks in Technology

Transcript

  1. Modeling Distributed Platforms from Application Traces for Realistic File Transfer

    Simulation A. Chai, M.-M. Bazm, S. Camarasu-Pop T. Glatard, H. Benoit-Cattin, F. Suter ISI–USC December 21, 2016 F. Suter – IN2P3 Computing Center/CNRS 1/27
  2. Developing WMS and Scientific Gateways Developers Wishes 1. Controlled and

    replicable results 2. Test many di↵erent experimental scenarios 3. Shorter time to conduct large experimentation campaigns Possible Answer: Simulation 1. Reproducible executions (performance, bugs) 2. Cheaper than running on real distributed infrastructures 3. Potential predictive power F. Suter – IN2P3 Computing Center/CNRS 2/27
  3. Target System – The Virtual Imaging Platform I Supported by

    the BioMed VO within EGI I 65 sites worldwide, 130 computing clusters and 5 PB of storage I Focus on steps 8 to 10 F. Suter – IN2P3 Computing Center/CNRS 3/27
  4. Target Application – GATE PET and SPECT imaging or radiation

    therapy GATE jobs 1. Download 3 input files I Wrapper script (73k) I Release tarball (121-500M) I User input (4-130k) 2. Monte-Carlo Simulation 3. Upload partial results Merge job 4. Download partial results 5. Merge 6. Upload final result I Focus on file transfers (steps 1, 3, 4, and 6) I Key to performance of distributed applications. I Variability may impact application dataflow I Delay tasks, impact storage policy, a↵ect execution time, . . . F. Suter – IN2P3 Computing Center/CNRS 4/27
  5. From Application to Simulation VIPSimulator I A SimGrid-Based Simulator in

    Java ; Modular and extensible I Decoupled implementation I Application and Middleware service ; the simulator I Hardware resources ; the platform file I Compute nodes, network, and hierarchical topology I Mapping of components to resources ; the deployment file Why SimGrid? I 15-years old project for the simulation of distributed systems I Open source, sustainable, widely used I Main Strengths I Versatility: simulates Grids, Clouds, P2P, and HPC systems I Fast and scalable simulation kernel I Tractable models: fluid models and Max-Min fairness sharing I (In)validation studies: simulation results can be trusted F. Suter – IN2P3 Computing Center/CNRS 5/27
  6. Execution Traces I 24 workflows from 6 users submitted from

    9/8/15 to 10/1/15 I 1 database per workflow I Timestamp for each milestone of job execution I Creation, queuing, download/computation/upload phases I 1,796 jobs on 32 computing sites I 1 trace per job I Compute nodes: Name, #cores, processing speed, and NIC bandwidth I Inferred topology: Organization in clusters and sites I 8,932 file transfers to/from 32 di↵erent storage elements I Source, destination, size, and duration F. Suter – IN2P3 Computing Center/CNRS 6/27
  7. From Traces to Simulation – Log2sim Workflow Execution Workflow Simulation

    gate-sh.1.out gate-sh.2.out gate-sh.n.out merge-sh.out DB log_extractor log_extractor log_extractor log_extractor db_extractor deployment_generator platform_generator db_dump.csv file_catalog.csv worker_nodes.csv file_transfers.csv deployment.xml platform.xml I Today’s focus: Platform generator I How to model the set of the hardware resources in a realistic way? F. Suter – IN2P3 Computing Center/CNRS 7/27
  8. A Word on Reproducibililty and Open Science I All the

    code is Open Source and available I VIPSimulator: http://github.com/frs69ws/VIPSimulator I Log2sim: http://github.com/frs69ws/log2sim I Simgrid: http://simgrid.gforge.inria.fr/download.php I The 3.14 ”Christmas Pi” release available on Sunday I All the data and scripts used for the study are also available I Figshare companion: https://dx.doi.org/10.6084/m9.figshare.4253426 F. Suter – IN2P3 Computing Center/CNRS 8/27
  9. Outline Introduction Modeling Platform from Execution Traces – Step by

    Step Experimental Evaluation Conclusion and Future Work F. Suter – IN2P3 Computing Center/CNRS 9/27
  10. A Baseline model Main sources of (in)accuracy in file transfer

    simulation I Interconnection topology: How compute nodes are organized I Instantiation of network links: How fast can data be transferred What can be done without specific information I Topology: Assume a uniform connectivity I Connect a Storage Element to all Sites through a single backbone I Instantiation: Assume 10 Gb/s links I SE are large disk bays with good connectivity A state-of-the-art model I Seems straightforward (or even naive) I But used in some work on workflow simulation F. Suter – IN2P3 Computing Center/CNRS 10/27
  11. Quality of the Baseline Model • • • • •

    • • • • • • • • • • • • • • • • • • • • • • • • • • • • • • • • • • • • • • • • • • • • • • • • • • • • • • • • • • • • • • • • • • • • • • • • • • • • • • • • • • • • • • • • • • • • • • • • • • • • • • • • • • • • • • • • • • • • • • • • • • • • • • • • • • • • • • • • • • • • • • • • • • • • • • • • • • • • • • • • • • • • • • • • • • • • • • • • • • • • • • • • • • • • • • • • • • Wrapper Release 1 2 3 4 5 0 50 100 150 200 0 25 50 75 100 0 25 50 75 100 Jobs Duration (in seconds) • Measured Simulated I Global and severe underestimation of transfer durations I Fail to capture the variability of transfer durations I Overestimated capacity hides contention e↵ects F. Suter – IN2P3 Computing Center/CNRS 11/27
  12. Leveraging Trace Contents I Derive network bandwidth from individual transfer

    durations I Use common-sense aggregation methods Average I Method: Compute mid-mean over all transfers to/from a given SE I Network sharing directly captured in the model I Pros: Reflect connectivity as experienced by application ; Realism I Cons: Validity limited to the workflow instance Maximum I Method: Determine maximum over all transfers to/from a given SE I Pros: Reusable beyond simulated replay of one execution I Possible spatial and temporal aggregation with other traces I Cons: Burden of resource sharing on simulation kernel F. Suter – IN2P3 Computing Center/CNRS 12/27
  13. Quality of Trace-Based Instantiation • • • • • •

    • • • • • • • • • • • • • • • • • • • • • • • • • • • • • • • • • • • • • • • • • • • • • • • • • • • • • • • • • • • • • • • • • • • • • • • • • • • • • • • • • • • • • • • • • • • • • • • • • • • • • • • • • • • • • • • • • • • • • • • • • • • • • • • • • • • • • • • • • • • • • • • • • • • • • • • • • • • • • • • • • • • • • • • • • • • • • • • • • • • • • • • • • • • • • • • • • Wrapper Release 1 2 3 4 5 0 50 100 150 200 0 25 50 75 100 0 25 50 75 100 Jobs Duration (in seconds) • Measured Simulated (Average) Simulated (Maximum) I Partially addresses variability capture I Especially for large files I Still fail to be accurate I Requires further investigations . . . F. Suter – IN2P3 Computing Center/CNRS 13/27
  14. Distinguish Transfer Type and File Size Analysis of individual bandwidths

    I Great di↵erences for a given SE I Of two orders of magnitude or more I Some unrealistically high or low bandwidths I Di↵erences between uploads and downloads Causes I Low bandwidths (< 1 kb/s): delayed upload tests I High bandwidths (> 10 Gb/s): log precision for short transfers I Upload/download discrepancy: di↵erent concurrency conditions Solution I Group transfers by type and direction F. Suter – IN2P3 Computing Center/CNRS 14/27
  15. Quality of Trace-Based Instantiation • • • • • •

    • • • • • • • • • • • • • • • • • • • • • • • • • • • • • • • • • • • • • • • • • •• • • • • • • • • • • • • • • • • • • • • • • • •• • • •• • • • • • • • • • • • • • • • • • • • • • • ccsrm02.in2p3.fr marsedpm.in2p3.fr sbgse1.in2p3.fr 0 50 100 150 200 0 25 50 75 100 0 25 50 75 100 0 25 50 75 100 Jobs Duration (in seconds) • Measured Average (All) Average (Grouped) I Improve simulation accuracy I Not enough though I Still fail to capture variability for a given SE I Have to focus on a specific Storage Element (e.g., marsedpm) F. Suter – IN2P3 Computing Center/CNRS 15/27
  16. Distinguish Computing Sites – Average-based • • • • •

    • • • • • • • • • • • • • • • • • • • • • • • • 0 50 100 150 200 Duration (in seconds) • Measured By SE By SE−Site • • • • • 0 50 100 150 200 250 INFN−BARI INFN−PISA UKI−LT2−IC−HEP UKI−LT2−QMUL UKI−LT2−RHUL Computing Sites Bandwidth (in Mb/s) I Global average bandwidth of 33.52 Mb/s I Rather good approximation for INFN-BARI and UKI-LT2-RHUL I Overestimation by a 2+ factor for INFN-PISA and UKI-LT2-IC-HEP I Clear underestimation for UKI-LT2-QMUL I Solution: Modify the topology I Single backbone ; Distinct SE-SITE links F. Suter – IN2P3 Computing Center/CNRS 16/27
  17. Distinguish Computing Sites – Maximum-based • • • • •

    • • • • • • • • • • • • • • • • • •• • • • • • 0 1000 2000 Duration (in seconds) • Measured By SE By SE−Site • • • • • 0 100 200 300 INFN−BARI INFN−PISA UKI−LT2−IC−HEP UKI−LT2−QMUL UKI−LT2−RHUL Computing Sites Bandwidth (in Mb/s) I Global maximum bandwidth of 321 Mb/s I Single value for all sites ; similar durations for all transfers. I Distinct maximum bandwidth per site ; dramatic degradation of simulation accuracy I Estimation of the maximum value is biased ; underestimation I Especially when there are many transfers F. Suter – IN2P3 Computing Center/CNRS 17/27
  18. Maximum Bandwidth Correction Determination of the maximum for INFN-PISA SITE

    I All transfers are concurrent and of similar durations I Derived bandwidth impacted by concurrency for each transfer I We observe the resource sharing, not the full capacity 1 2 3 4 5 6 7 8 9 4200 4300 4400 4500 Time (in seconds) Transfers Correction I Uniformly sample each transfer in n intervals I Estimate concurrency c i in each interval I Compute a correction factor f = n P n i=1 1 ci F. Suter – IN2P3 Computing Center/CNRS 18/27
  19. Impact of Maximum Correction • •• • • • •

    • • • • • • • • • • • • • • • • • • • • • • 0 1000 2000 INFN−BARI INFN−PISA UKI−LT2−IC−HEP UKI−LT2−QMUL UKI−LT2−RHUL Computing Sites Duration (in seconds) • Measured Maximum (w/o correction) Maximum (w/ correction) I Important overestimation of transfer durations disappears I Simulation accuracy globally improved I Some inaccuracies remain I INFN-PISA: Two transfers are longer than they should in real execution I UKI-LT2-RHUL: Impact of destination cluster F. Suter – IN2P3 Computing Center/CNRS 19/27
  20. Distinguish Clusters in Sites I Single bandwidth for Site fails

    to capture cluster-related di↵erences • • • • • • • • • • • • • • • • • • • • • • • • • • • • • • • • • • • • Average Maximum 0 100 200 ne1wn−32cores s1wn−32cores so1wn−4cores ne1wn−32cores s1wn−32cores so1wn−4cores Clusters Duration (in seconds) • Measured By Site By Cluster By (Cluster−SE) I Solution 1: Di↵erentiate links that connect clusters in a Site I Change the aggregation of observed durations I Only partially improve the accuracy I Solution 2: Consider distinct Cluster - SE routes F. Suter – IN2P3 Computing Center/CNRS 20/27
  21. Outline Introduction Modeling Platform from Execution Traces – Step by

    Step Experimental Evaluation Conclusion and Future Work F. Suter – IN2P3 Computing Center/CNRS 21/27
  22. Analysis of Simulated Transfer Durations • • • • •

    • • • • • • • • • • • • • • • • • • • • • • • • • • • • • • • • • • • • • • • • • • • • • • • • • • • • • • • • • • • • • • • • • • • • • • • • • • • • • • • • • • • • • • • • • • • • • • • • • • • • • • • • • • • • • • • • • • • • • • • • • • • • • • • • • • • • • • • • • • • • • • • • • • • • • • • • • • • • • • • • • • • • • • • • • • • • • • • • • • • • • • • • • • • • • • • • • • • • • • • • • • • • • • • • • • • • • • • • • • • • • • • • • • • • • • • • • • • • • • • • • • • • • • • • • • • • • • • • • • • • • • • • • • • • • • • • • • • • • • • • • • • • • • • • • • • • • • • • • • • • • • • • • • • • • • • • • • • • • • • • • • • • • • • • • • • • • • • • • • • • • • • • • • • • • • • • • • • • • • • • • • • • • • • • • • • • • • • • • • • • • • • • • • • • • • • • • • • • • • • • • • • • • • • • • • • • • • • • • • • • • • • • • • • • • • • • • • • • • • • • • • • • • • • • • • • • • • • • • • • • • • • • • • • • • • • • • • • • • • • • • • • • • • • • • • • • • • • • • • • • • • • • • • • • • • • • • • • • • • • • • • • • • • • • • • • • • • • • • • • • • • • • • • • • • • • • • • • • • • • • • • • • • • • • • • • • • • • • • • • • • • • • • • • • • • • • • • • • • • • • • • • • • • • • • • • • • • • • • • • • • • • • • • • • • • • • • • • • • • • • • • • • • • • • • • • • • • • • • • • • • • • • • • • • • • • • • • • • • • • • • • • • • • • • • • • • • • • • • • • • • • • • • • • • • • • • • • • • • • • • • • • • • • • • • • • • • • • • • • • • • • • • • • • • • • • • • • • • • • • • • • • • • • • • • • • • • • • • • • • • • • • • • • • • • • • • • • • • • • • • • • • • • • • • • • • • • • • • • • • • • • • • • • • • • • • • • • • • • • • • • • • • • • • • • • • • • • • • • • • • • • • • • • • • • • • • • • • • • • • • • • • • • • • • • • • • • • • • • • • • • • • • • • • • • • • • • • • • • • • • • • • • • • • • • • • • • • • • • • • • • • • • • • • • • • • • • • • • • • • • • • • • • • • • • • • • • • • • • • • • • • • • • • • • • • • • • • • • • • • • • • • • • • • • • • • • • • • • • • • • • • • • • • • • • • • • • • • • • • • • • • • • • • • • • • • • • • • • • • • • • • • • • • • • • • • • • • • • • • • • • • • • • • • • • • • • • • • • • • • • • • • • • • • • • • • • • • • • • • • • • • • • • • • • • • • • • • • • • • • • • • • • • • • • • • • • • • • • • • • • • • • • • • • • • • • • • • • • • • • • • • • • • • • • • • • • • • • • • • • • • • • • • • • • • • • • • • • • • • • • • • • • • • • • • • • • • • • • • • • • • • • • • • • • • • • • • • • • • • • • • • • • • • • • • • • • • • • • • • • • • • • • • • • • • • • • • • • • • • • • • • • • • • • • • • • • • • • • • • • • • • • • • • • • • • • • • • • • • • • • • • • • • • • • • • • • • • • • • • • • • • • • • • • • • • • • • • • • • • • • • • • • • • • • • • • • • • • • • • • • • • • • • • • • • • • • • • • • • • • • • • • • • • • • • • • • • • • • • • • • • • • • • • • • • • • • • • • • • • • • • • • • • • • • • • • • • • • • • • • • • • • • • • • • • • • • • • • • • • • • • • • • • • • • • • • • • • • • • • • • • • • • • • • • • • • • • • • • • • • • • • • • • • • • • • • • • • • • • • • • • • • • • • • • • • • • • • • • • • • • • • • • • • • • • • • • • • • • • • • • • • • • • • • • • • • • • • • • • • • • • • • • • • • • • • • • • • • • • • • • • • • • • • • • • • • • • • • • • • • • • • • • • • • • • • • • • • • • • • • • • • • • • • • • • • • • • • • • • • • • • • • • • • • • • • • • • • • • • • • • • • • • • • • • • • • • • • • • • • • • • • • • • • • • • • • • • • • • • • • • • • • • • • • • • • • • • • • • • • • • • • • • • • • • • • • • • • • • • • • • • • • • • • • • • • • • • • • • • • • • • • • • • • • • • • • • • • • • • • • • • • • • • • • • • • • • • • • • • • • • • • • • • • • • • • • • • • • • • • • • • • • • • • • • • • • • • • • • • • • • • • • • • • • • • • • • • • • • • • • • • • • • • • • • • • • • • • • • • • • • • • • • • • • • • • • • • • • • • • • • • • • • • • • • • • • • • • • • • • • • • • • • • • • • • • • • • • • • • • • • • • • • • • • • • • • • • • • • Input and Wrapper Files (< 130 kB) Release Files (> 121 MB) 0 20 40 60 0 250 500 750 Measured Baseline Average Maximum Measured Baseline Average Maximum Durations (in seconds) Min. 1st Qu. Median Mean 3rd Qu. Max. Measured 2.00 5.01 17.42 49.91 77.31 888.80 Baseline 1.19 2.02 2.03 2.55 2.15 11.52 Average 2.00 5.13 13.12 48.19 76.11 873.80 Maximum 1.98 3.17 7.06 31.02 35.29 873.80 F. Suter – IN2P3 Computing Center/CNRS 22/27
  23. Analysis of Absolute Logarithmic Errors I Symmetrical I Error(Duration) ,

    Error(Bandwidth) I Maximum and mean are comparable LogErr = | log(R) log(S) | Rel. Error = exp(Log. Error) - 1 0% 25% 50% 75% 100% 0 1 2 3 4 5 6 Absolute Logarithmic Error Percentage of file transfers 10G−SotA Maximum Average Average I 75% of transfers with error smaller than 0.29 (Rel. Error: 33.8%) I Worst error: 2.83 Maximum I 75% of transfers with error smaller than 0.95 (Rel. Error: 157%) I Worst error: 4 F. Suter – IN2P3 Computing Center/CNRS 23/27
  24. Identified Root Causes of Main Simulation Errors Influence of external

    load I EGI is a (very) shared platform 1 2 3 4 5 200 400 600 Time (in seconds) Transfers Software configuration on Storage Elements I Limits the number of concurrent transfers I Might trigger some timeout-retry mechanisms I Information not captured in the traces F. Suter – IN2P3 Computing Center/CNRS 24/27
  25. Outline Introduction Modeling Platform from Execution Traces – Step by

    Step Experimental Evaluation Conclusion and Future Work F. Suter – IN2P3 Computing Center/CNRS 25/27
  26. Conclusion I Simulation can help at prototyping and testing for

    WMS design I Allows for deterministic and reproducible experiments I Requires to faithfully reflect behavior of actual production runs I Methodology for building realistic platform models I Based on execution traces I Focused on file transfers I Evaluated against real execution data I Reproduce real-life variability I Correctly capture distribution of transfer durations I Outperforms the baseline used in previous works I Promising results but still room for improvement F. Suter – IN2P3 Computing Center/CNRS 26/27
  27. Future work I Conduct a deep analysis of the simulation

    results (ongoing) I Understand (if not solve) inaccuracies I Confirm findings on a larger set of execution traces I Consider spatial and temporal aggregation of traces I Towards a model of the full Biomed Grid I Extend the simulation capacities of the VIPSimulator I Simulate other components of a workflow execution I Towards the generation of realistic execution scenarios I Provide a trustable tool to help WMS developers I Test and assess new optimizations I Explore what-if scenarios F. Suter – IN2P3 Computing Center/CNRS 27/27