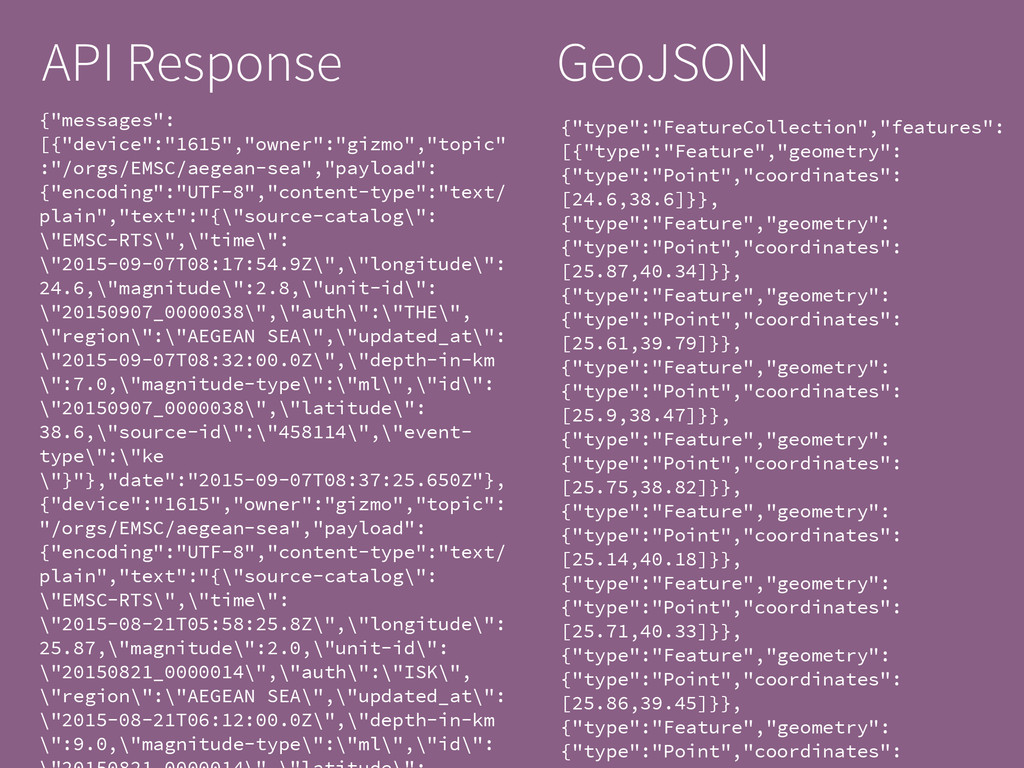
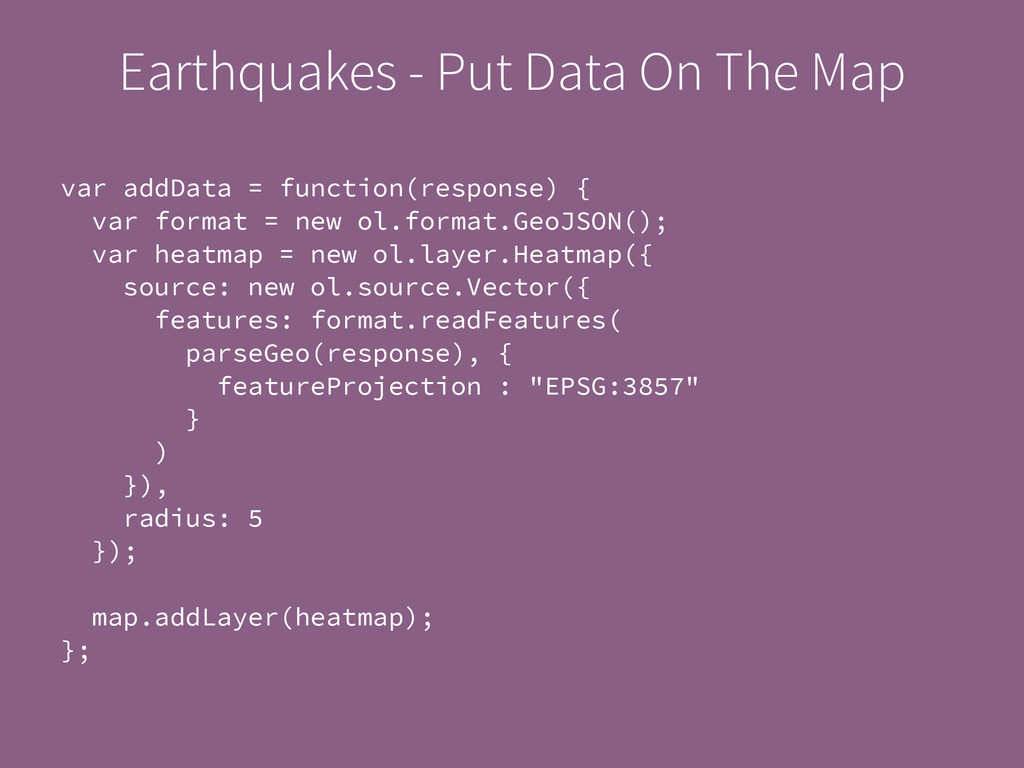
SEA\",\"updated_at\": \"2015-09-07T08:32:00.0Z\",\"depth-in-km \":7.0,\"magnitude-type\":\"ml\",\"id\": \"20150907_0000038\",\"latitude\": 38.6,\"source-id\":\"458114\",\"event- type\":\"ke \"}"},"date":"2015-09-07T08:37:25.650Z"}, {"device":"1615","owner":"gizmo","topic": "/orgs/EMSC/aegean-sea","payload": {"encoding":"UTF-8","content-type":"text/ plain","text":"{\"source-catalog\": \"EMSC-RTS\",\"time\": \"2015-08-21T05:58:25.8Z\",\"longitude\": 25.87,\"magnitude\":2.0,\"unit-id\": \"20150821_0000014\",\"auth\":\"ISK\", \"region\":\"AEGEAN SEA\",\"updated_at\": \"2015-08-21T06:12:00.0Z\",\"depth-in-km \":9.0,\"magnitude-type\":\"ml\",\"id\": API Response {"type":"FeatureCollection","features": [{"type":"Feature","geometry": {"type":"Point","coordinates": [24.6,38.6]}}, {"type":"Feature","geometry": {"type":"Point","coordinates": [25.87,40.34]}}, {"type":"Feature","geometry": {"type":"Point","coordinates": [25.61,39.79]}}, {"type":"Feature","geometry": {"type":"Point","coordinates": [25.9,38.47]}}, {"type":"Feature","geometry": {"type":"Point","coordinates": [25.75,38.82]}}, {"type":"Feature","geometry": {"type":"Point","coordinates": [25.14,40.18]}}, {"type":"Feature","geometry": {"type":"Point","coordinates": [25.71,40.33]}}, {"type":"Feature","geometry": {"type":"Point","coordinates": [25.86,39.45]}}, {"type":"Feature","geometry": {"type":"Point","coordinates": GeoJSON
![Using Google Charts To Produce A Map google.load("visualization", "1", {packages:["geochart"]});](https://files.speakerdeck.com/presentations/7928256340294e7ab83f2c189f2d4c6f/slide_45.jpg)
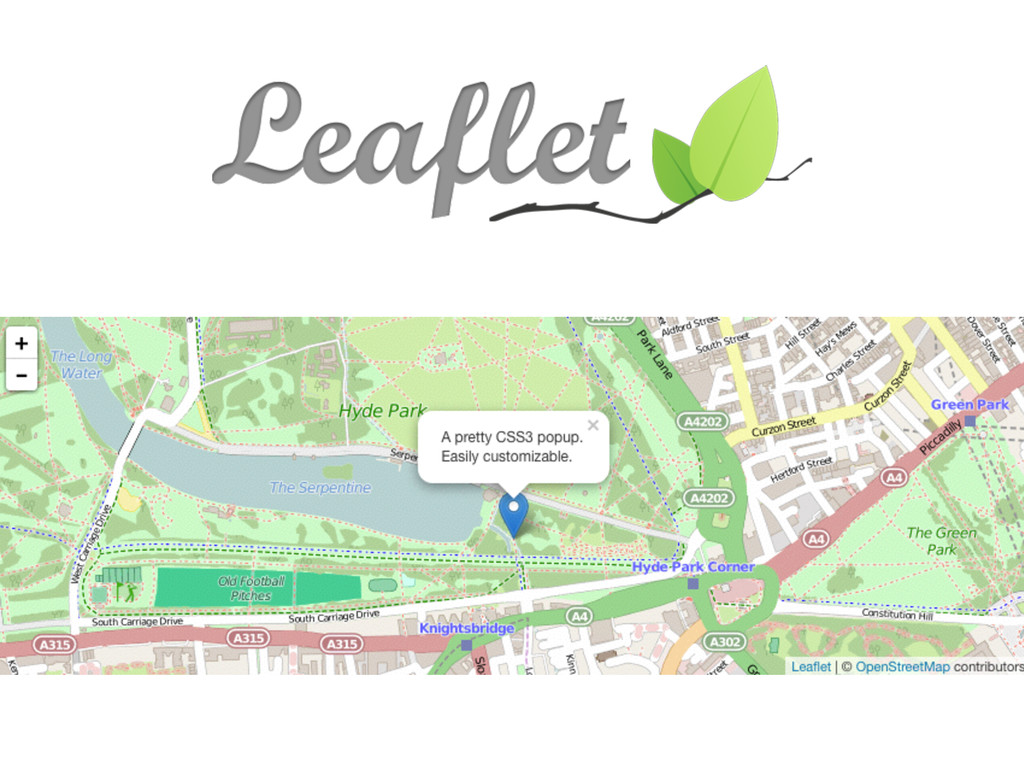
![Leaflet var map = L.map('map').setView([51.505, -0.09], 13); L.tileLayer('http://{s}.tile.osm.org/{z}/{x}/{y}.png', { attribution:](https://files.speakerdeck.com/presentations/7928256340294e7ab83f2c189f2d4c6f/slide_61.jpg)