$30 off During Our Annual Pro Sale. View Details »

FlameGraph: What you need to know to get started

FlameGraph: What you need to know to get started

These are the slides from my FlameGraph talk from Linuxfest Northwest 2014. I will be putting the youtube video up in the next month or so (it takes a while for me to edit).

shawn-sterling

April 28, 2014
Tweet

More Decks by shawn-sterling

Other Decks in Technology

Transcript

  1. FlameGraph
    What you need to know to get started

    View Slide

  2. Who am I
    email: [email protected]

    web: www.systemtemplar.org

    github: github.com/shawn-sterling

    https://speakerdeck.com/shawnsterling
    member of -->
    <-- trust me, I have a huge beard
    aerodynamic -->
    <-- Sysadmin for 18 years, small start ups -> large enterprises
    <-- I am the guy (google: I wanna be the guy + sysadmin)
    <-- contributes to several open source projects including FlameGraph
    <-- Author of graphios (nagios plugin for graphite)
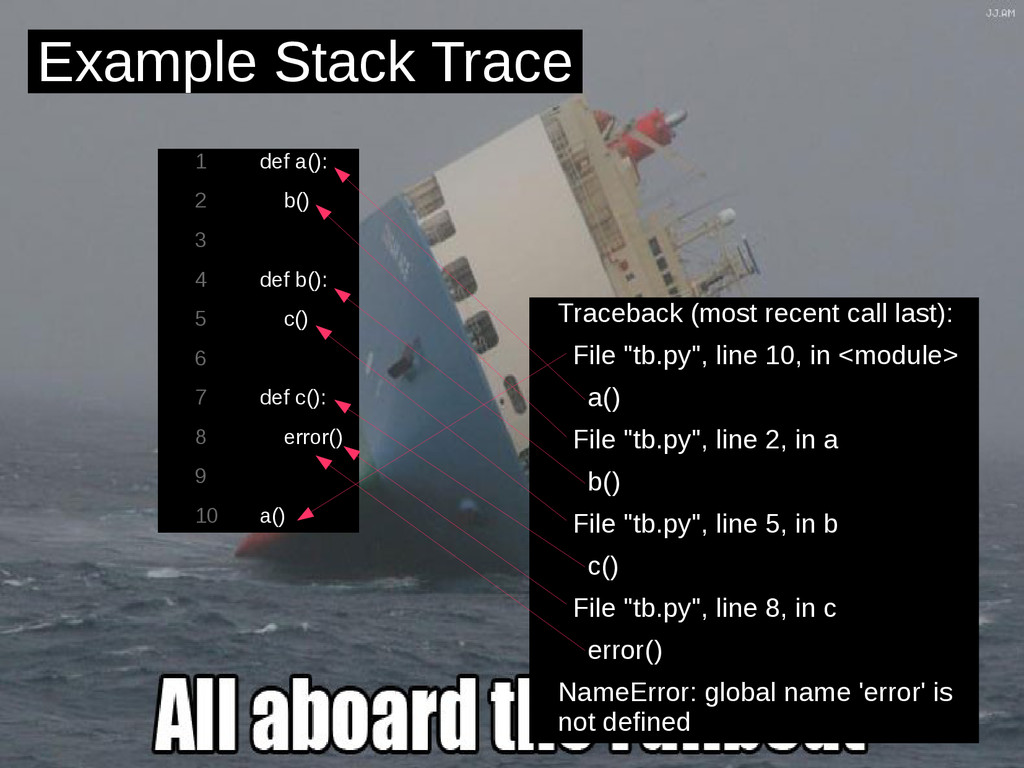
    View Slide

  3. What is my purpose?
    * you should totally watch this show (Rick and Morty).

    View Slide

  4. Audience pole

    View Slide

  5. View Slide

  6. Example Stack Trace
    def a():
    b()
    def b():
    c()
    def c():
    error()
    a()
    1

    2

    3

    4

    5

    6

    7

    8

    9

    10

    View Slide

  7. Traceback (most recent call last):
    File "tb.py", line 10, in
    a()
    File "tb.py", line 2, in a
    b()
    File "tb.py", line 5, in b
    c()
    File "tb.py", line 8, in c
    error()
    NameError: global name 'error' is
    not defined
    Example Stack Trace
    def a():
    b()
    def b():
    c()
    def c():
    error()
    a()
    1

    2

    3

    4

    5

    6

    7

    8

    9

    10

    View Slide

  8. Traceback (most recent call last):
    File "tb.py", line 10, in
    a()
    File "tb.py", line 2, in a
    b()
    File "tb.py", line 5, in b
    c()
    File "tb.py", line 8, in c
    error()
    NameError: global name 'error' is
    not defined
    Example Stack Trace
    def a():
    b()
    def b():
    c()
    def c():
    error()
    a()
    1

    2

    3

    4

    5

    6

    7

    8

    9

    10

    View Slide

  9. Actual Stack Trace
    *Java is a nightmare

    View Slide

  10. A single stack trace can take a long time to go through and figure out what is going on.

    View Slide

  11. FlameGraph lets you analyze MANY stack stack traces at once

    View Slide

  12. View Slide

  13. View Slide

  14. View Slide

  15. The top edge is where cpu time is consumed

    View Slide


  16. steal agentz's picture
    Agentzh made this awesome picture.

    View Slide

  17. View Slide

  18. View Slide

  19. View Slide

  20. View Slide


  21. Click to add text

    View Slide

  22. View Slide

  23. Full stack problems
    <-- Slow

    View Slide

  24. Full stack problems
    <-- Slow

    View Slide

  25. View Slide

  26. View Slide

  27. .

    get the real flamegraph here!

    View Slide

  28. View Slide

  29. View Slide

  30. View Slide

  31. Comparison of working system and broken system
    working broken

    View Slide

  32. Same side by side, consistent palette
    working broken

    View Slide

  33. Comparison mode with different palette option

    View Slide

  34. View Slide

  35. View Slide

  36. View Slide


  37. getting started
    Let's get started

    View Slide

  38. .
    rhel: yum install $package-debuginfo
    ie: yum install mysql-debuginfo
    debian/ubuntu: apt-get install $package-dbg
    ie: apt-get install varnish-dbg
    fedora/rhel7: debuginfo-install $package
    ie: debuginfo-install kernel

    View Slide

  39. View Slide

  40. Gather Data

    View Slide

  41. Using DTrace
    # dtrace -x ustackframes=100 -n 'profile-97 /execname ==
    "mysqld" && arg1/ {
    @[ustack()] = count(); } tick-60s { exit(0); }' -o out.stacks
    # ./stackcollapse.pl out.stacks > out.folded
    # ./flamegraph.pl out.folded > out.svg

    View Slide

  42. Using Perf
    # perf record -a -g -F 99 sleep 60
    # perf script | ./stackcollapse-perf.pl > out.perf-folded
    # ./flamegraph.pl out.perf-folded > perf-kernel.svg

    View Slide

  43. Using System Tap
    # stap -s 32 -D MAXBACKTRACE=100 -D MAXSTRINGLEN=4096 -D MAXMAPENTRIES=10240 \
    -D MAXACTION=10000 -D STP_OVERLOAD_THRESHOLD=5000000000 --all-modules \
    -ve 'global s; probe timer.profile { s[backtrace()] <<< 1; }
    probe end { foreach (i in s+) { print_stack(i);
    printf("\t%d\n", @count(s[i])); } } probe timer.s(60) { exit(); }' \
    > out.stap-stacks
    # ./stackcollapse-stap.pl out.stap-stacks > out.stap-folded
    # cat out.stap-folded | ./flamegraph.pl > stap-kernel.svg

    View Slide

  44. Using ktap
    # ktap -e 's = ptable(); profile-1ms { s[backtrace(12, -1)] <<< 1 }
    trace_end { for (k, v in pairs(s)) { print(k, count(v), "\n") } }
    tick-30s { exit(0) }' -o out.kstacks
    # sed 's/ //g' out.kstacks | stackcollapse.pl > out.kstacks.folded
    # ./flamegraph.pl out.kstacks.folded > out.kstacks.svg

    View Slide

  45. Using hprof (java)
    # java
    -agentlib:hprof=cpu=samples,depth=100,interval=1ms,lineno=y,thr
    ead=y,file=output.hprof[...]
    # hprof2flamegraph output.hprof > output-folded.txt
    # flamegraph.pl output-folded.txt > output.svg
    Also google 'spf4j'

    View Slide

  46. Using Xperf (Windows)
    C:>xperf_to_collapsedstacks.py name.etl starttime stoptime
    C:>flamegraph.pl output.txt > graph.svg
    * See http://randomascii.wordpress.com/2013/03/26/summarizing-
    xperf-cpu-usage-with-flame-graphs/

    View Slide

  47. View Slide

  48. View Slide

  49. get folding

    View Slide

  50. dtrace:
    ./stackcollapse.pl broken.dtrace > broken.folded
    perf:
    perf script -i broken.perf | ./stackcollapse-perf.pl > broken.folded
    stap:
    ./stackcollapse-stap.pl broken.stap > broken.folded
    ktap:
    sed 's/ //g' broken.ktap | stackcollapse.pl > broken.folded
    hprof:
    hprof2flamegraph broken.hprof > broken.folded get folding

    View Slide

  51. cat broken.folded | ./flamegraph.pl > broken.svg

    View Slide

  52. cat broken.folded | ./flamegraph.pl --hash > broken.svg

    View Slide

  53. cat broken.folded | ./flamegraph.pl --cp > broken.svg
    cat working.folded | ./flamegraph.pl --cp > working.svg

    View Slide

  54. cat working.folded | ./flamegraph.pl --cp > working.svg
    cat broken.folded | ./flamegraph.pl --cp --colors mem > broken.svg
    rm palette.map
    broken.svg

    View Slide

  55. what else ya got

    View Slide

  56. off cpu flamegraphs

    View Slide

  57. off cpu flamegraphs

    View Slide

  58. Script VM (Perl, Python, Ruby, etc)
    Userspace
    Kernel
    Debug Flow

    View Slide

  59. git clone https://github.com/agentzh/nginx-systemtap-toolkit.git

    View Slide

  60. check-debug-info

    View Slide

  61. # ./check-debug-info -p 16882
    File /usr/bin/bash has no debug info embedded.
    File /usr/lib64/ld-2.16.so has no debug info embedded.
    File /usr/lib64/libc-2.16.so has no debug info embedded.
    File /usr/lib64/libdl-2.16.so has no debug info embedded.
    File /usr/lib64/libnss_files-2.16.so has no debug info embedded.
    # rpm -qf /usr/lib64/ld-2.16.so
    glibc-2.16-34.fc18.x86_64
    # yum install glibc-debuginfo

    View Slide

  62. sample-bt

    View Slide

  63. ## Kernel calls
    # ./sample-bt -p 1784 -k -t 60 > kern.st
    ## User calls
    # ./sample-bt -p 1784 -u -t 60 > user.st
    ## Kernal and User calls
    # ./sample-bt -p 1784 -k -u -t 60 > both.st

    View Slide

  64. ## Kernel calls
    # ./sample-bt -p 1784 -k -t 60 > kern.st
    $ ./stackcollapse-stap.pl kern.st > kern.folded
    $ ./flamegraph.pl kern.folded > kern.svg

    View Slide

  65. ## User calls
    # ./sample-bt -p 1784 -u -t 60 > user.st
    $ ./stackcollapse-stap.pl user.st > user.folded
    $ ./flamegraph.pl user.folded > user.svg

    View Slide

  66. ## Kernal and User calls
    # ./sample-bt -p 1784 -k -u -t 60 > both.st
    $ ./stackcollapse-stap.pl both.st > both.folded
    $ ./flamegraph.pl both.folded > both.svg

    View Slide

  67. ## Kernal and User calls
    # ./sample-bt -p 1784 -k -u -t 60 > both.st
    $ ./stackcollapse-stap.pl both.st > both.folded
    $ cat both.folded | grep -v execute_command | ./flamegraph.pl both.folded > nex.svg

    View Slide

  68. ## Debug flag to dump stap file:
    # ./sample-bt -p 1784 -k -d > test.stap
    # stap -x 1794 test.stap
    # cat test.stap
    probe begin {
    warn(sprintf("Tracing %d (/usr/bin/bash) in kernel-space only...\n", target()))
    }
    global bts;
    probe timer.profile {
    if (pid() == target() && !user_mode()) {
    bts[backtrace()] <<< 1
    }
    }
    probe end {
    nstacks = 0
    foreach (bt in bts limit 1) {
    nstacks++
    }
    if (nstacks == 0) {
    warn("No backtraces found. Quitting now...\n")
    } else {
    foreach (bt in bts- limit 1024) {
    print_stack(bt)
    printf("\t%d\n", @count(bts[bt]))
    }
    }
    }
    probe timer.s(5) {
    warn("Time's up. Quitting now...(it may take a while)\n")
    exit()
    }

    View Slide

  69. sample-bt-off-cpu

    View Slide

  70. sample-bt-off-cpu
    # ./sample-bt-off-cpu -k -u -p 12861 -t 10 > bash.st

    View Slide

  71. # ./sample-bt-off-cpu -k -u -p 12861 -t 10 > bash.st
    $ ./stackcollapse-stap.pl bash.st > bash.folded
    $ ./flamegraph.pl bash.folded > bash.svg

    View Slide

  72. sample-bt-vfs

    View Slide

  73. sample-bt-vfs
    # ./sample-bt-vfs -p 15206 -t 10 > vfs.st
    or
    # ./sample-bt-vfs -p 15206 -t 10 --latency > vfs.st

    View Slide

  74. View Slide

  75. git clone https://github.com/agentzh/perl-systemtap-toolkit.git

    View Slide

  76. # ./pl-sample-bt -t 60 -p 754 > nginx.st
    $ ./stackcollapse-stap.pl nginx.st > nginx.folded
    $ ./flamegraph.pl nginx.folded > nginx.svg

    View Slide

  77. View Slide

  78. View Slide

  79. Google flamegraph to download

    View Slide

  80. email: [email protected]

    web: www.systemtemplar.org

    github: github.com/shawn-sterling

    https://speakerdeck.com/shawnsterling
    And thanks to Brendan Gregg for writing FlameGraph
    Also thanks to Yichun Zhang (agentzh) for his toolkits

    View Slide

  81. Questions?
    email: [email protected]

    web: www.systemtemplar.org

    github: github.com/shawn-sterling

    https://speakerdeck.com/shawnsterling

    View Slide

  82. Image Credits
    Most of these images were found in google's 
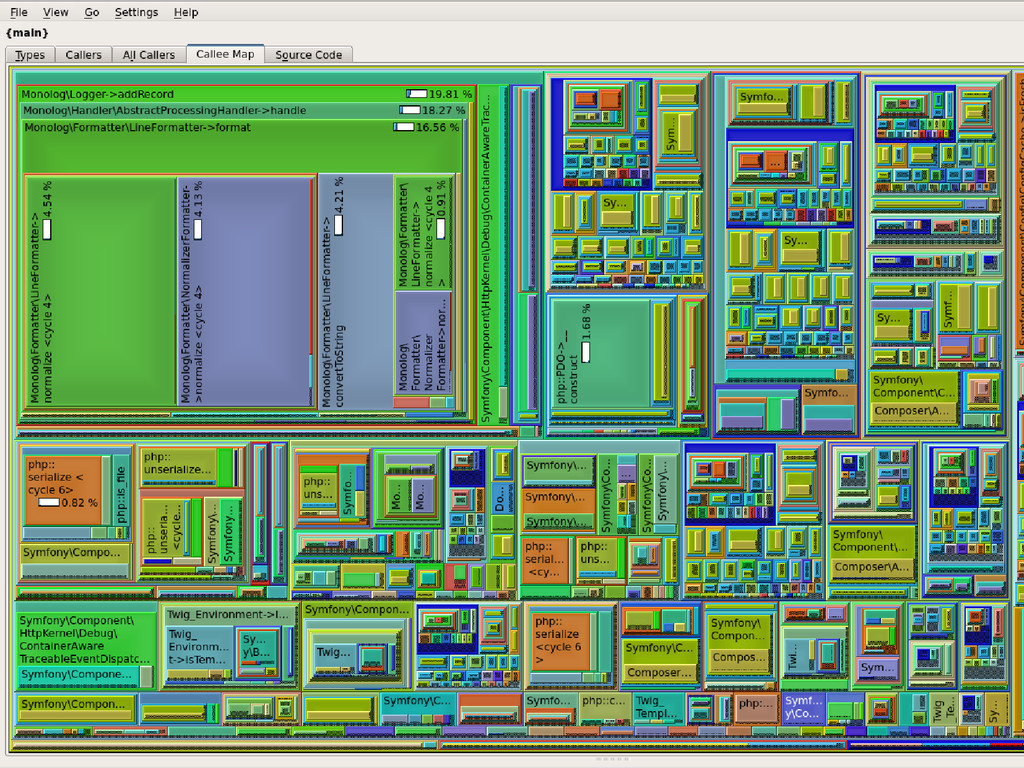
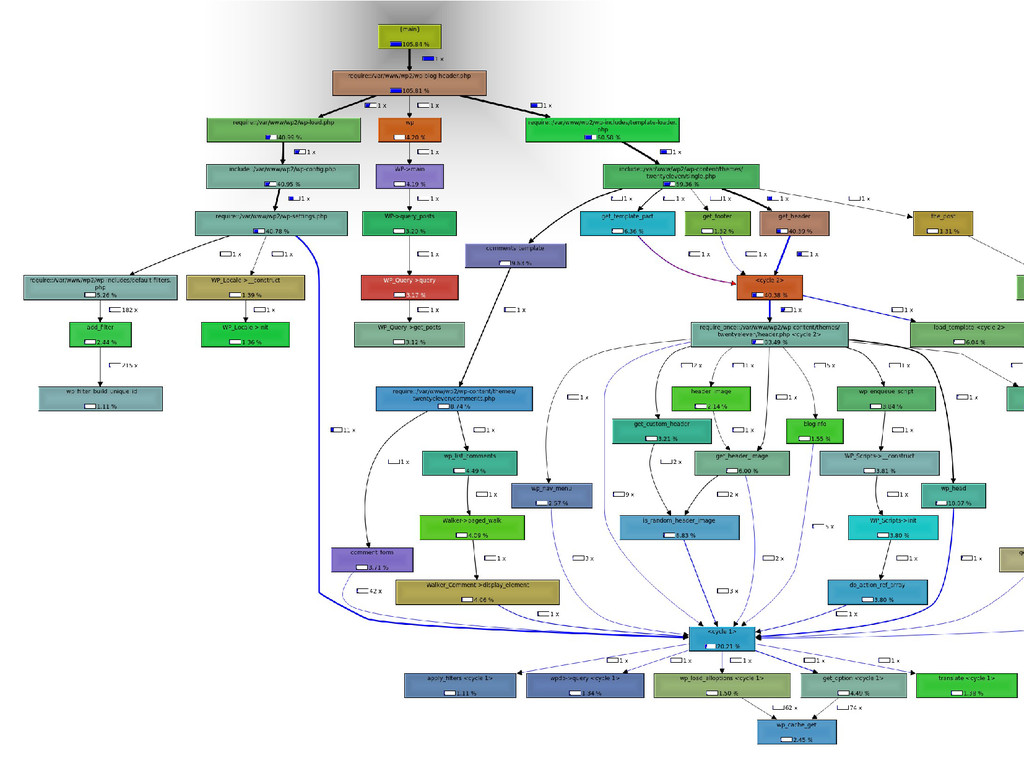
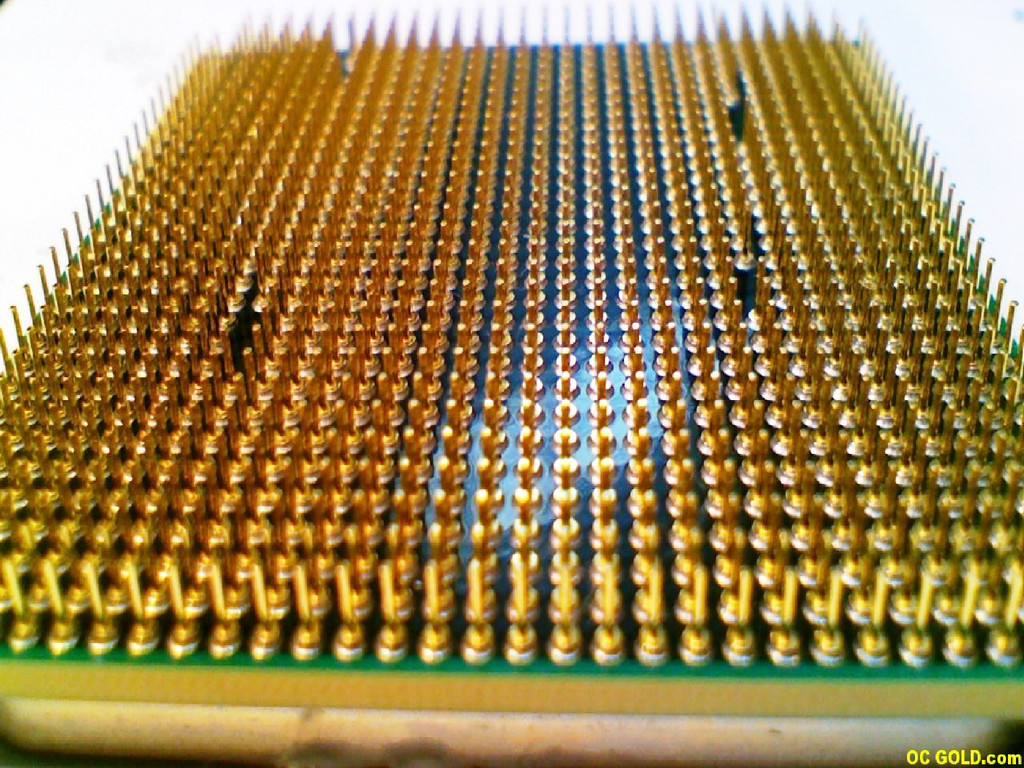
image search with “labeled for non commercial reuse” turned on.
    No money will be made from these slides if it remains under my control. If I have incorrectly used your image
    please let me know and I will remove it.
    Fire Breather http://commons.wikimedia.org/wiki/File:Fire_breathing_20060715_7005_collien.jpg
    Rick and Morty Screenshot http://video.adultswim.com/rick-and-morty/
    Stack Trace http://www.flickr.com/photos/miltown77/327120002/
    Failboat http://www.flickr.com/photos/jeffmcneill/4252968654/
    Kcachegrind http://itarato.blogspot.ca/2013/01/drupal-and-symfony-with-xdebug-and.html
    Code path map http://talks.php.net/show/confoo10/10
    Snowflake http://www.flickr.com/photos/chaoticmind75/10152925944/
    Snow Scene http://www.flickr.com/photos/vesiaphotography/12544068844/
    Hand drawn flamegraph http://agentzh.org/
    Demo http://www.flickr.com/photos/democonference/3948252064/
    Show me http://csd-berlin.de/blog/2013/05/29/show-me-glamour-is-back-19-30-uhr-im-friedrichstadt-palast/
    Picard meme http://foolz.us
    Jackie Chan meme http://alltheragefaces.com/
    CPU pins http://ocgold.com/blog/?p=7240
    Willy Wonka meme http://memegenerator.net/
    Cereal Guy meme http://alltheragefaces.com/face/cereal-guy-cereal-guy-spitting
    cpu picture http://uk.hardware.info/
    Symbols http://wojtas19.deviantart.com/art/Transmutation-Circle-115246997
    Fire Dancer http://www.flickr.com/photos/sunphotoaz/4487436356/
    My little ponies http://ex0artefact.deviantart.com/art/Mlp-and-What-the-fuck-386595361
    Whats the problem pony http://mylittlefacewhen.com/f/5170/
    lighter fluid guy http://www.flickr.com/photos/silvermarquis/477978519/
    telephone pole http://www.flickr.com/photos/strollers/90725657/
    nuts http://www.flickr.com/photos/cifor/9944748885/
    Tell me more http://ww.jduensing.com/
    off hours waiting https://www.flickr.com/photos/tiptoe/5608253489/
    Safe http://safemanitoba.com/sites/default/files/styles/node_display_image/public/safeproduction650x290.png
    paper phoenix http://www.flickr.com/photos/jon_tucker/2707620458/
    do it live http://www.mixcrate.com/img/ugc/covers/1/7/176688_l.jpg?v=713201235
    debug car https://plus.google.com/103443672885327262273/about
    drive like you stole it http://cdn.a1decals.com/wp-content/uploads/drive-it-like-you-stole-it-w-n-1024x1024.jpeg
    please wait https://www.flickr.com/photos/askpang/6773635892/
    linux filesystems http://cs.jhu.edu/~razvanm/fs-expedition/tux3.html
    what else http://www.enjoy-your-car.com/31-what-else.html
    sample pic http://images.cdn.fotopedia.com/flickr-3465412768-hd.jpg
    try it http://www.flickr.com/photos/mag3737/5191418684/
    question marks http://www.flickr.com/photos/oberazzi/318947873/
    thank you http://www.flickr.com/photos/nateone/3768979925/

    View Slide