Upgrade to Pro — share decks privately, control downloads, hide ads and more …

Who owns what? Graph theory application @ PyCon MY 2015

Who owns what? Graph theory application @ PyCon MY 2015

Finding companies indirect ownership can be tricky. Look at how we make use of graph theory and linear algebra to solve real world application.

Shulhi Sapli

August 23, 2015
Tweet

Other Decks in Programming

Transcript

  1. WHO OWNS WHAT?
    A graph theory application.
    @shulhi

    View Slide

  2. Background
    Mathematics & Actuarial Science
    SWE @ Millennium Radius
    shulhi @ gmail, github, twitter, etc

    View Slide

  3. Overview
    1. Problems
    2. Optimizations

    View Slide

  4. Problems
    Given list of companies and their respective
    shareholders, find all companies’ effective
    ownership.

    View Slide

  5. Company Shareholder Share
    Foo Sdn. Bhd A 50
    Foo Sdn. Bhd Bar Sdn. Bhd 50
    Bar Sdn. Bhd B 50
    Bar Sdn. Bhd C 50

    View Slide

  6. Foo
    Bar A
    B C
    50%
    50% 50%
    50%
    Effective ownership
    own-a relationship

    View Slide

  7. Foo
    Bar A
    B C
    50%
    50% 50%
    50%
    25%
    25%
    Effective ownership

    View Slide

  8. Foo
    Bar A
    B C
    50%
    50% 50%
    50%
    25%
    25%
    Effective ownership

    View Slide

  9. Trial & Error #1
    Graph traversal

    View Slide

  10. Graph traversal
    1. Simple for linear relationship. Remember
    our first example? That’s linear.
    Foo
    Bar A
    B C
    50%
    50% 50%
    50%

    View Slide

  11. View Slide

  12. Graph traversal
    2. Headache for cycles relationship.
    Foo
    Bar A
    B C
    33%
    34%
    50%
    33%
    50%

    View Slide

  13. View Slide

  14. Correct answer:
    A -> Bar = 0.20481928
    C -> Foo = 0.19879518
    B -> Foo = 0.19879518

    View Slide

  15. Graph traversal
    3. Cycle relationship needs to be converted
    into geometric series formula in order to be
    correctly calculated.
    Foo
    Bar A
    B C
    33%
    34%
    50%
    33%
    50%

    View Slide

  16. Graph traversal
    4. Lots of cycle in real data :\

    5. Lots of tracking to be done.

    View Slide

  17. Graph traversal
    5. From our runs, it took more than a week+
    to calculate all the results.

    View Slide

  18. Trial & Error #2
    Graph traversal + The Matrix

    View Slide

  19. Matrix: Revolutions
    1. Model companies/shareholders’
    relationship into adjacency matrix.

    2. Feed into given equation

    3. Calculate the inverse

    4. Profit!

    View Slide

  20. Equation

    View Slide

  21. Equation
    where,
    I is the identity matrix and A is the adjacency matrix
    corresponding to the relationship of companies.

    View Slide

  22. Adjacency Matrix
    A C B Foo Bar
    A 0 0 0 0.5 0
    C 0 0 0 0 0.5
    B 0 0 0 0 0.5
    Foo 0 0 0 0 0
    Bar 0 0 0 0.5 0
    A =

    View Slide

  23. View Slide

  24. Even works for cycles!

    View Slide

  25. Optimizations

    View Slide

  26. CPU Utilization
    1. OpenBLAS - Multicore Numpy
    Numpy - Make use of BLAS
    BLAS - Low level linear algebra

    View Slide

  27. View Slide

  28. CPU Utilization
    2. Python multi-thread/process does not
    work for our 
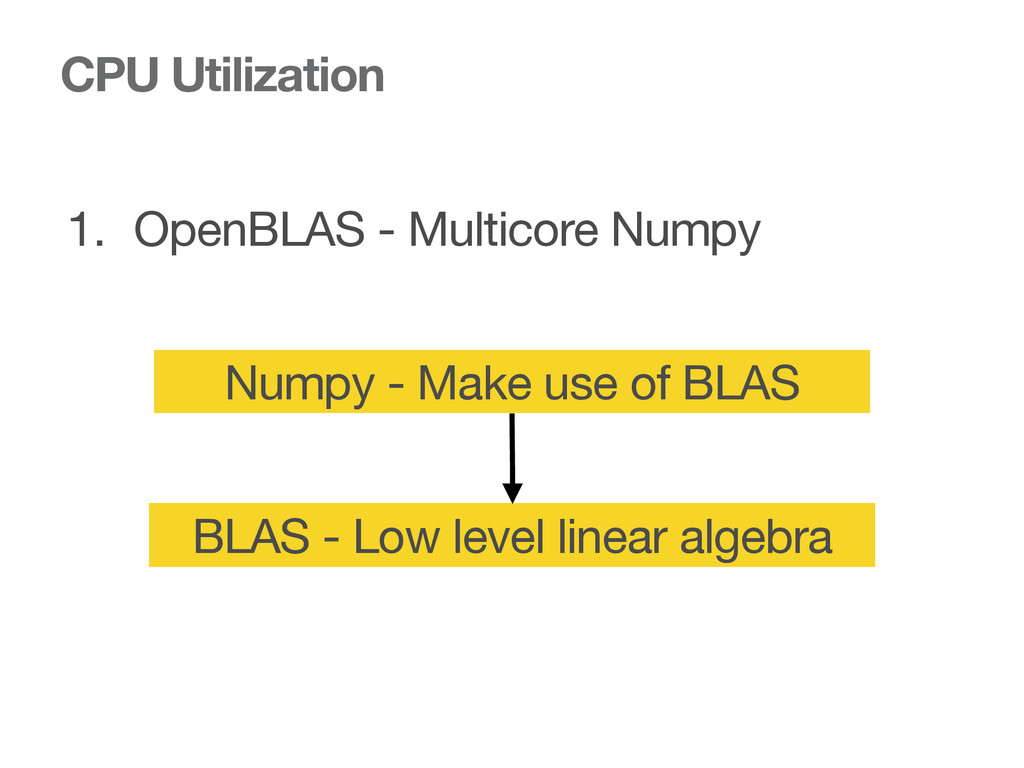
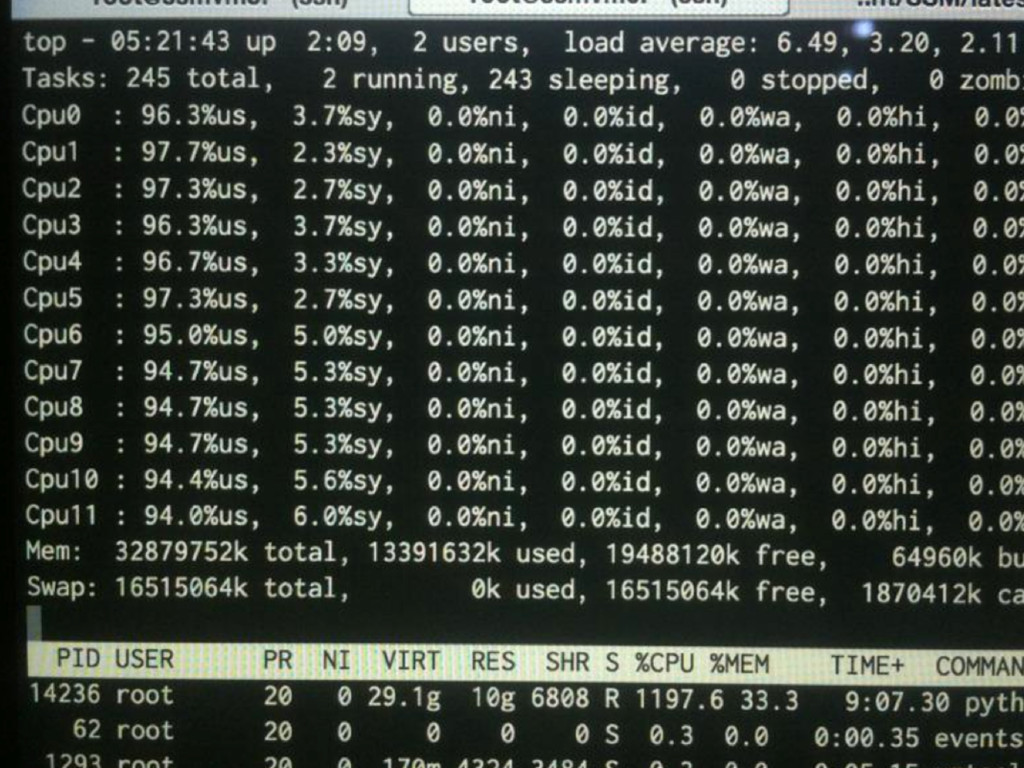
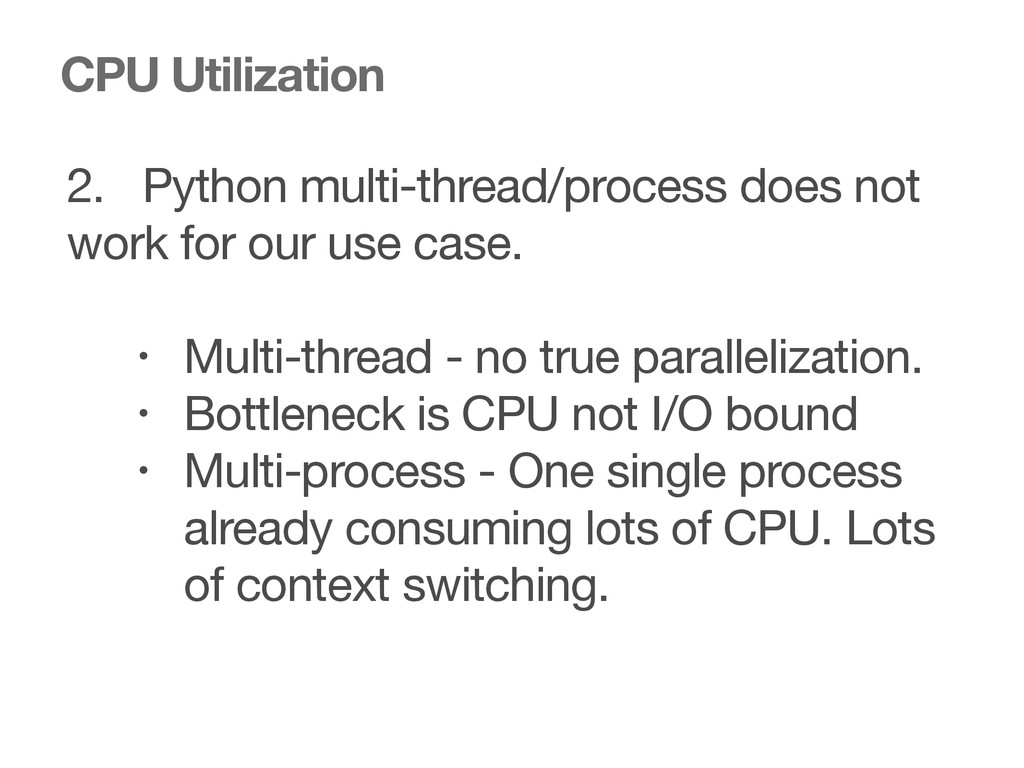
use case.

    • Multi-thread - no true parallelization.

    • Bottleneck is CPU not I/O bound

    • Multi-process - One single process
    already consuming lots of CPU. Lots
    of context switching.

    View Slide

  29. Memory usage
    1. Iterative vs recursive algorithm

    • Stack frame

    • No support for tail-call optimization

    2. del keyword in Python. Manual
    management of object reference count.

    View Slide

  30. Memory usage - del keyword

    View Slide

  31. View Slide

  32. Numpy quirks
    File  "/usr/local/lib/python2.7/dist-­‐packages/scipy/linalg/decomp_svd.py",  line  103,  in  
    svd  
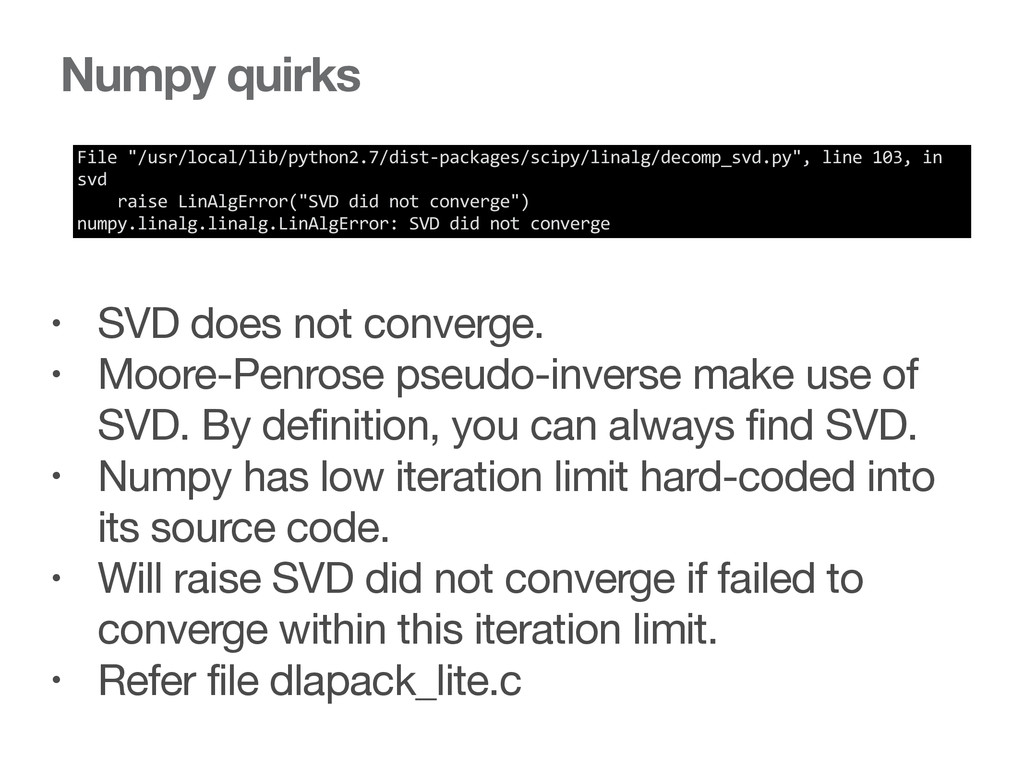
           raise  LinAlgError("SVD  did  not  converge")  
    numpy.linalg.linalg.LinAlgError:  SVD  did  not  converge
    • SVD does not converge.

    • Moore-Penrose pseudo-inverse make use of
    SVD. By definition, you can always find SVD.

    • Numpy has low iteration limit hard-coded into
    its source code.

    • Will raise SVD did not converge if failed to
    converge within this iteration limit.

    • Refer file dlapack_lite.c

    View Slide

  33. Data structures
    • Know when to use Set vs List

    • Lookup: Set O(1) vs List O(n)

    • Numpy matrices format - sparse vs
    dense

    View Slide

  34. Algorithm
    1. Re-frame the problem

    2. Matrix inverse is always 
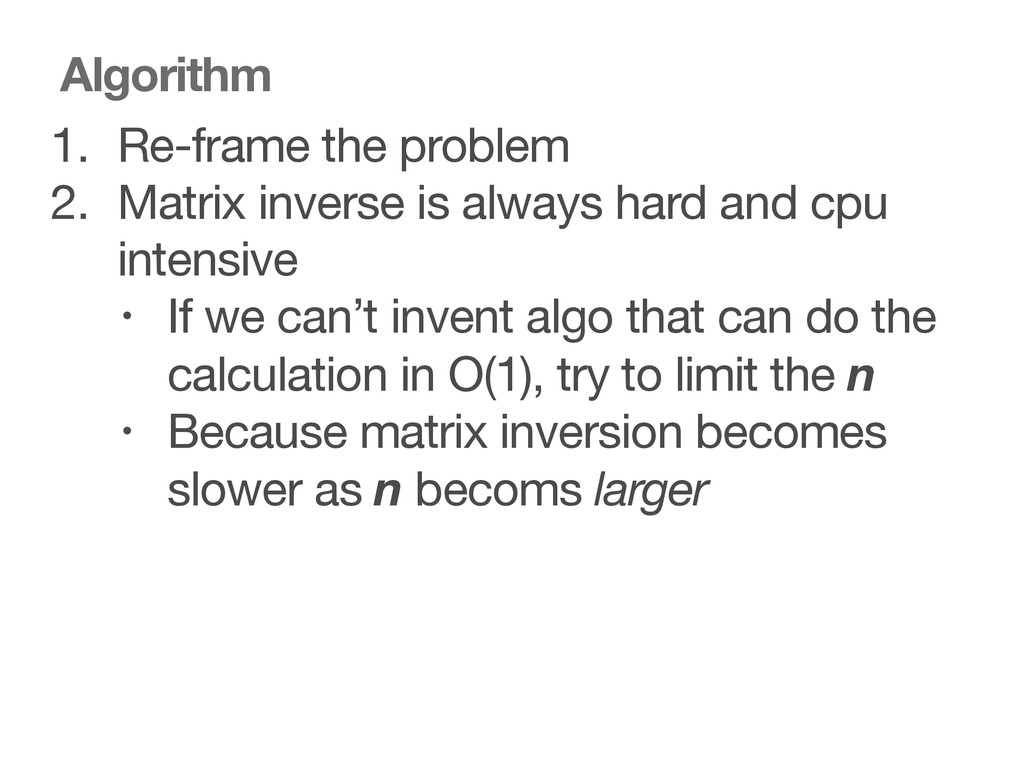
hard and cpu
    intensive

    • If we can’t invent algo that can do the
    calculation in O(1), try to limit the n
    • Because matrix inversion becomes
    slower as n becoms larger

    View Slide

  35. Algorithm - Limiting the n
    • Reducing memory usage

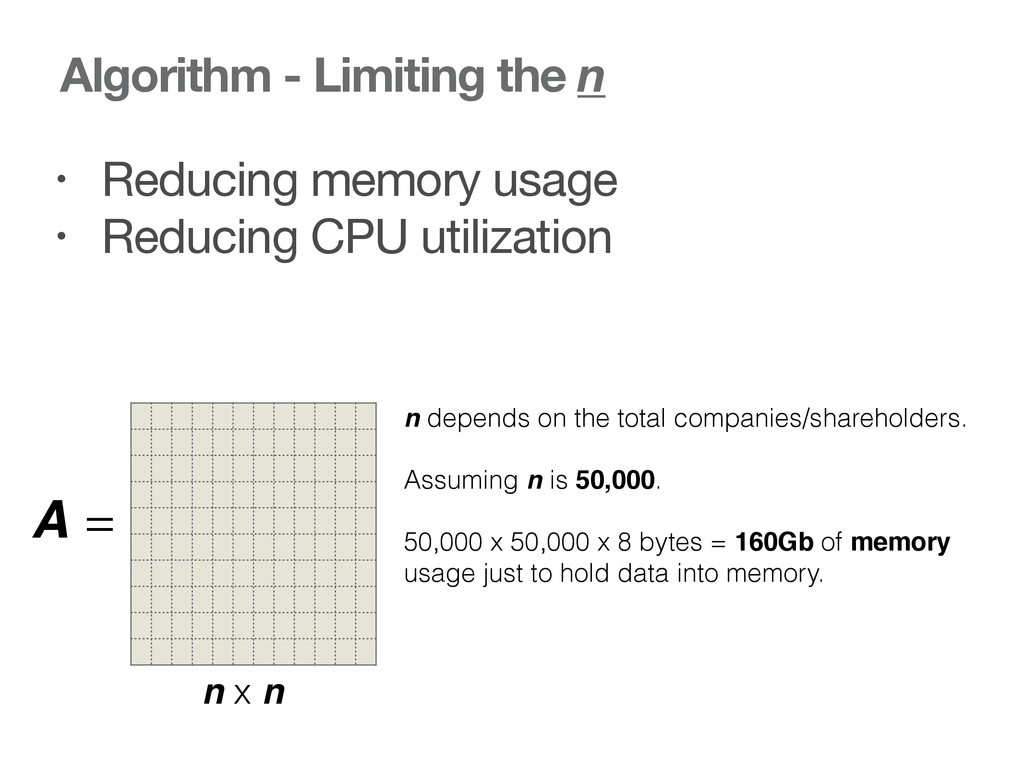
    • Reducing CPU utilization
    n x n
    n depends on the total companies/shareholders.
    Assuming n is 50,000.
    50,000 x 50,000 x 8 bytes = 160Gb of memory
    usage just to hold data into memory.
    A =

    View Slide

  36. Algorithm - Limiting the n
    1. Find smallest connected components
    2. Calculate on each component

    View Slide

  37. View Slide

  38. Algorithm - Limiting the n
    Lots of
    cyclic
    nodes
    }
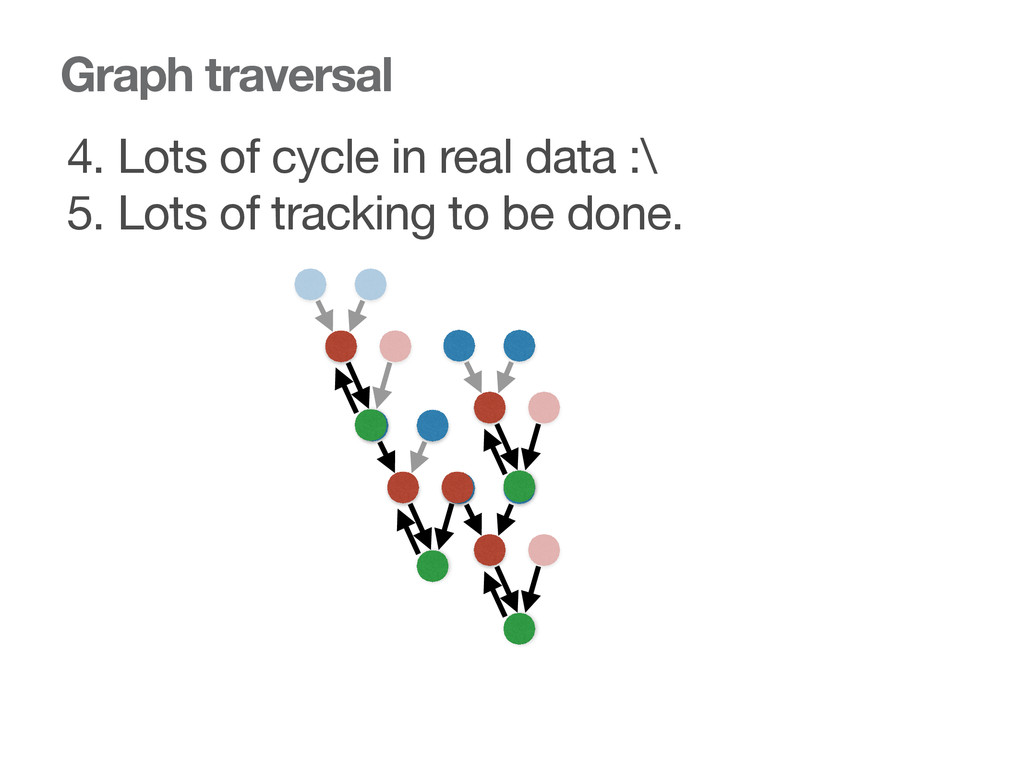
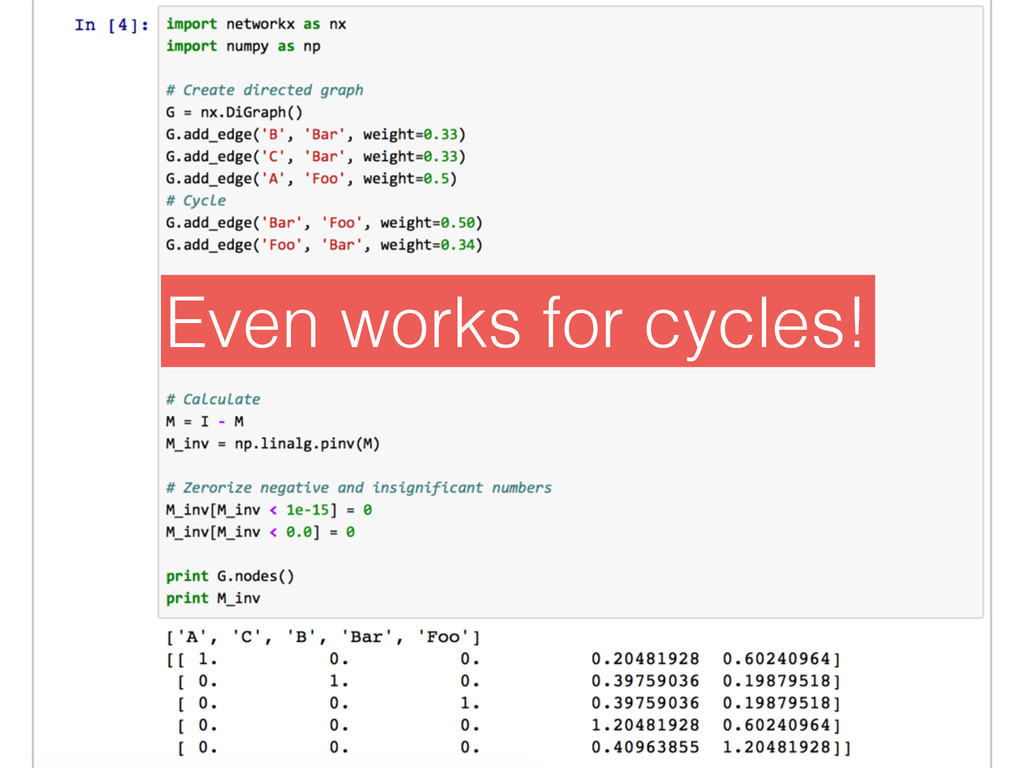
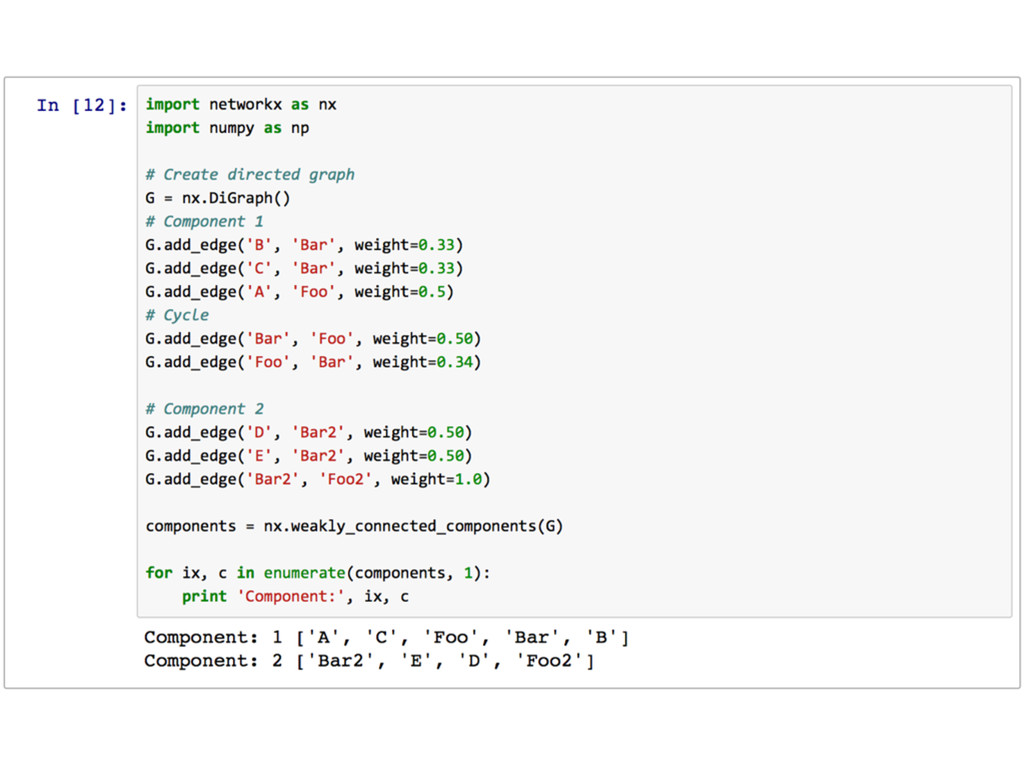
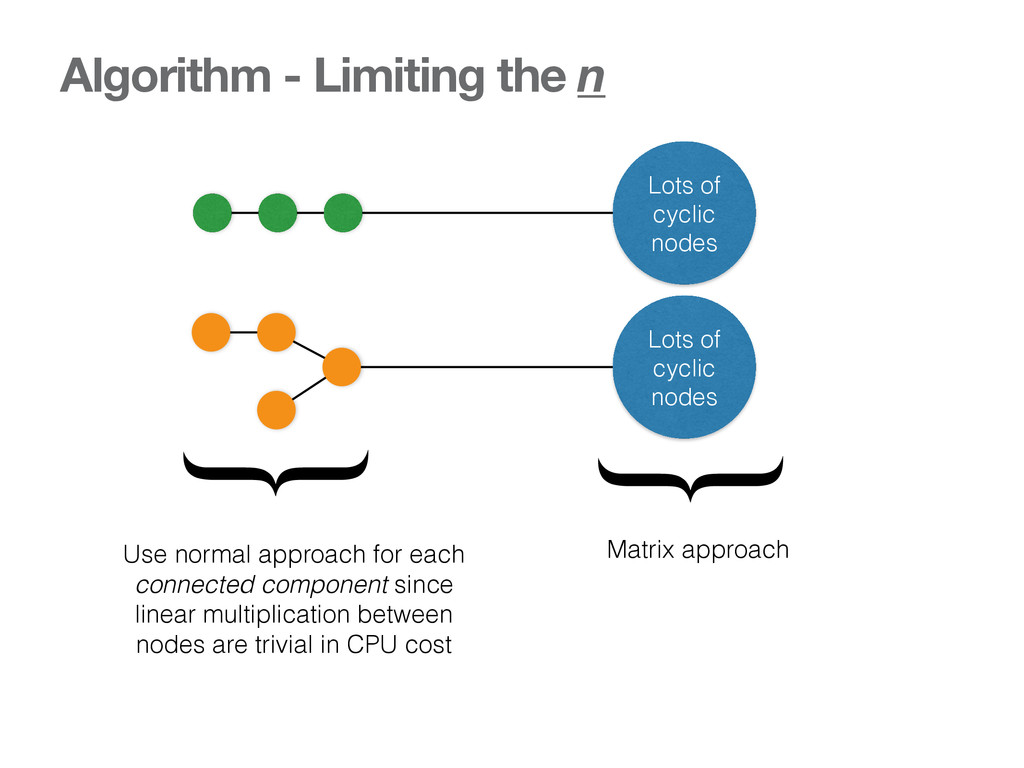
    Matrix approach
    }
    Use normal approach for each
    connected component since
    linear multiplication between
    nodes are trivial in CPU cost
    Lots of
    cyclic
    nodes

    View Slide

  39. Result
    Memory usage

    ~< 30Gb vs > 120Gb for our early trials & errors

    Run time calculation

    ~< 3 hours vs > 1 week for graph traversal
    approach

    View Slide

  40. Reference
    Dr. Ivan Keglević, Matrix Approach to the Calculation of
    Indirect Quotas

    http://web.math.pmf.unizg.hr/applmath99/245-251.pdf

    View Slide

  41. We’re hiring!
    Contact me at:

    shulhi @ gmail, github, twitter, etc

    View Slide