Upgrade to Pro — share decks privately, control downloads, hide ads and more …

Michigan Predator-Prey Project

Michigan Predator-Prey Project

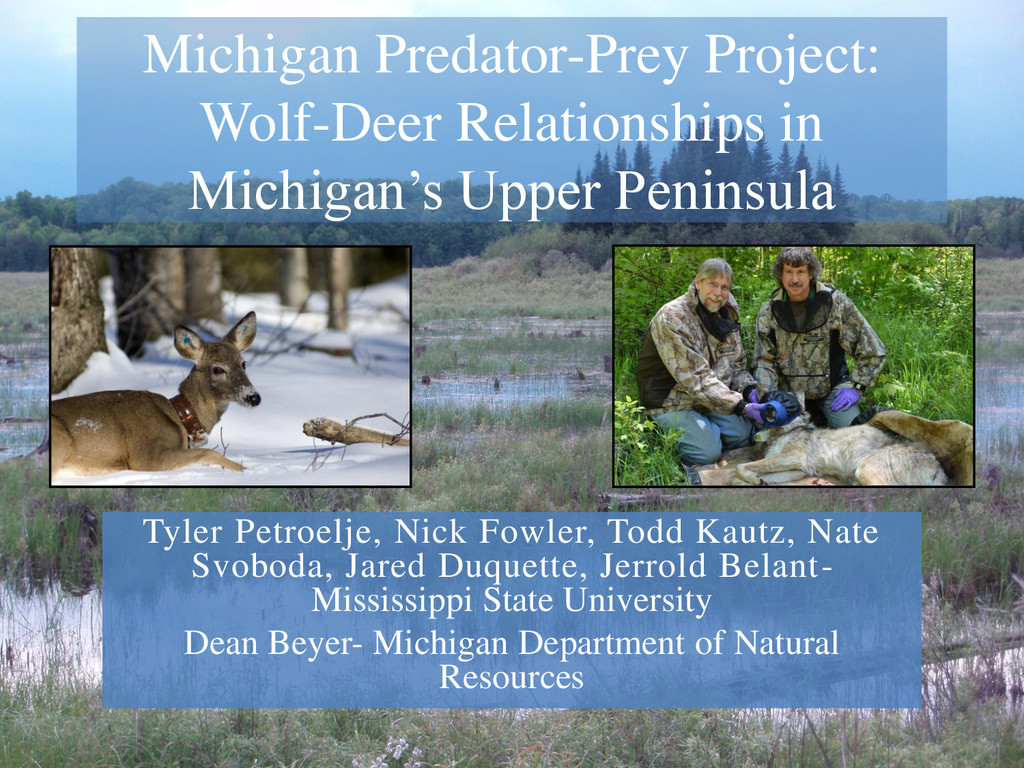
Authors: Tyler Petroelje, Nick Folwer, Todd Kautz, Nate Svoboda, Jared Duquette, and Jerrold Belant of Mississippi State University, Dean Beyer of Michigan Department of Natural Resources. A presentation given at the 2015 Midwest Wolf Stewards Conference

More Decks by Sigurd Olson Environmental Institute

Other Decks in Research

Transcript

  1. Michigan Predator-Prey Project: Wolf-Deer Relationships in Michigan’s Upper Peninsula Tyler

    Petroelje, Nick Fowler, Todd Kautz, Nate Svoboda, Jared Duquette, Jerrold Belant- Mississippi State University Dean Beyer- Michigan Department of Natural Resources
  2.  Abundance Estimates  Collar and monitor adult female deer

     Collar and monitor neonate deer  Collar and monitor predators  Monitor inter-year variation in weather  Estimate available habitat cover and forage
  3.  White-tailed deer – Remote camera surveys  Wolves –

    Track surveys  Coyotes – Howl surveys  Bobcats – Winter hair snares  Black bear – Summer hair snares
  4. • ’13 – 36 (0.036/sq. km) • ’14 – 38

    (0.038/sq. km) • ‘15 - 36 (0.036/sq. km)
  5.  Clover traps (January- March)  VHF radio-collar and vaginal

    implant transmitter on pregnant Does • Survival monitored weekly via airplane • Ground locations 3 times/day during May- August
  6.  2013  49 females collared  100% of adults

    pregnant (42)  89% of yearlings pregnant (9)  2014  45 females collared  100% of adults pregnant (44)  67% of yearlings pregnant (6)  2015  45 females collared  98% of adults pregnant (46)  0% of yearlings pregnant (2)  + 10 winter collared fawns
  7. Fawn:Doe Ratio 1:1 Fawn:Doe Ratio 0.27:1 Fawn:Doe Ratio 0.47:1 49

    27 6 8 22 7 0 10 20 30 40 50 60 Adult Fawn Yearling 2013 Female Male 45 6 7 5 6 4 0 10 20 30 40 50 Adult Fawn Yearling 2014 Female Male 45 10 2 4 11 2 0 10 20 30 40 50 Adult Fawn Yearling 2015 Female Male
  8.  2013: 54%  January-April: 70%  2014: 38% 

    January-April: 42%  2015: ...  January-17 April: 80% Importance of condition between years? Good bone marrow Poor bone marrow
  9. 0 0.1 0.2 0.3 0.4 0.5 0.6 0.7 0.8 0.9

    1 Jan Feb Mar Rump Fat Depth (cm) 2015 2014
  10. 1.90 2.10 2.30 2.50 2.70 2.90 3.10 3.30 JAN FEB

    MAR BODY CONDITION SCORE (1-5) Crystal Falls (2013-2015) Escanaba (2009-2011)
  11. 0 10 20 30 40 50 60 70 80 31-Dec

    7-Jan 14-Jan 21-Jan 28-Jan 4-Feb 11-Feb 18-Feb 25-Feb 4-Mar 11-Mar 18-Mar 25-Mar 1-Apr 8-Apr 15-Apr 22-Apr 29-Apr Snow Depth (cm) Date Snow Depth '12-'13 Snow Depth '13-'14 Snow Depth '14-'15
  12. 0 2 4 6 8 10 12 14 16 18

    Jan Feb Mar Apr May Jun Jul Aug Sep Oct Nov Dec Number of mortalities 2013 Mortality events 2014 Mortality events 2015 Mortality events
  13.  VIT drop site (birth site) searches and opportunistic captures

     Measurements and blood/hair samples • Expandable VHF radio- collar and ear-tags • Daily survival monitoring via ground telemetry
  14.  2013  43 fawns (26 male, 17 female) 

    2014  25 fawns (12 male, 13 female)
  15.  2013  0 of 43 fawns surviving 2013 (May

    2013-May 2014) Apparent survival: 0% (*13 censors*)  2014  2 of 25 fawns surviving 2014 (May 2014 – April 2015) Apparent survival: 11% (*7 censors*)
  16.  2013 – average birth mass 3.1 kg (6.8 lbs.)

     Lower mass and lesser survival  2014 – average birth mass 3.7 kg (8.1 lbs.)  Greater survival when born with greater birth mass, same trend observed in Escanaba  Why a greater weight following a tougher winter?  Only the adult females in best condition made it through winter  Possibly more singletons, more resources devoted to one fetus rather than two (hard to identify true twinning rates)
  17.  Capture with foot hold traps  Morphometrics  Biological

    Samples  Ear tags  GPS collar Capture totals  4 wolves from 3 packs collared in 2013  5 wolves from 3 packs collared in 2014
  18. Predation Investigation  GPS locations implemented into GIS and “clusters”

    are determined  Cluster is defined spatially as ≥8 locations within 50 m of each other  Search area using technicians and detection dogs
  19.  Investigated 568 clusters (2014)  Investigated 868 cluster (2013)

     Black bear – 1.6% fawns (insects/berries)  Bobcat – 3.7% fawns (snowshoe hare/grouse/porcupine)  Coyote – 1.6% fawns (snowshoe hare/grouse/adult deer)  Wolf – 3.9% fawns (yearling & adult deer)
  20.  Harsh winters resulted in poor condition deer  Very

    low survival, fewer deer producing fawns.  Largest source of mortality ~ Predation  Coyotes largest predator of adults and fawns, similar to Escanaba study area  Wolves have greater individual predation rate on fawns but at the population level have a lesser impact on the deer herd  Winter of 2014-2015 earlier melt than previous 2 years.  Lesser predation/mortality  Deer condition indices similar to previous years.  Early melt increases survival and may better prepare deer for fawning?  Importance of late winter forage and late season snow depth and melting date. Fawn birth mass and available cover important for survival