Upgrade to Pro — share decks privately, control downloads, hide ads and more …

Public Attitudes Toward Wolves in Wisconsin

Public Attitudes Toward Wolves in Wisconsin

Authors: Robert Holsman, Natalie Kaner, Jordan Petchenik and David MacFarland of Wisconsin Department of Natural Resources. Presentation given at 2015 Midwest Wolf Stewards Conference at Northland College. April 2015

More Decks by Sigurd Olson Environmental Institute

Other Decks in Research

Transcript

  1. Public Attitudes towards
    Wolves in Wisconsin
    Robert Holsman, Natalie Kaner,
    Jordan Petchenik & David MacFarland

    View Slide

  2. Statewide Mail Survey (Feb-Apr 2014)
    • Objective:
    To document public 
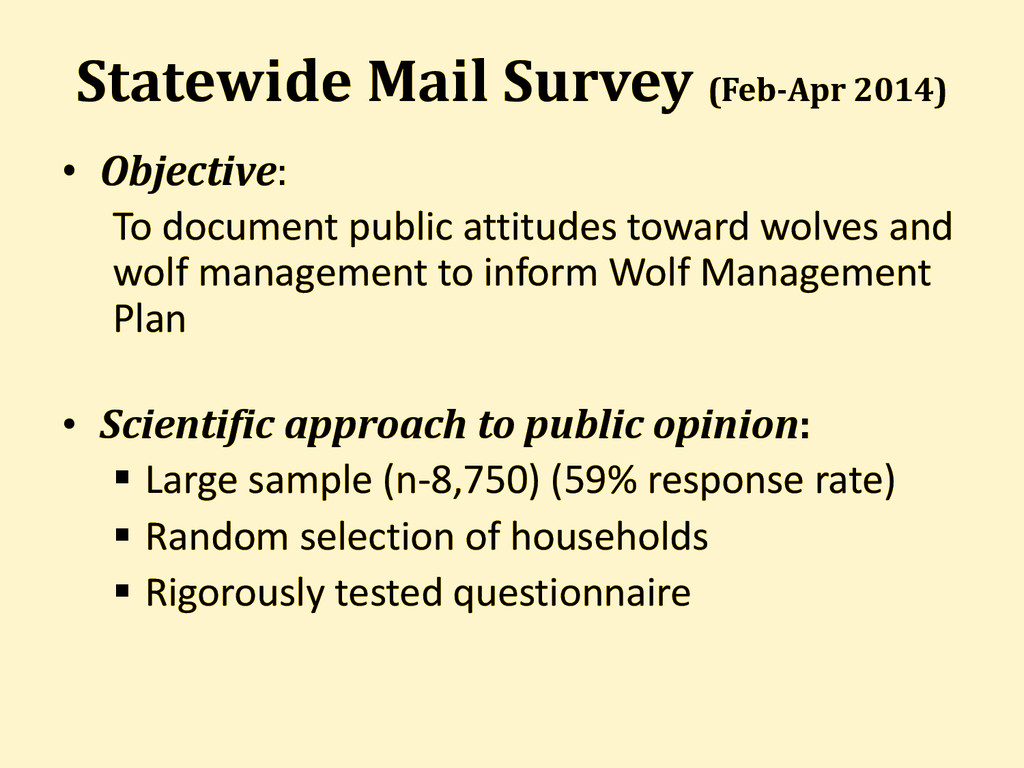
attitudes toward wolves and
    wolf management to inform Wolf Management
    Plan
    • Scientific approach to public opinion:
     Large sample (n-8,750) (59% response rate)
     Random selection of households
     Rigorously tested questionnaire

    View Slide

  3. • Wolf range clusters
    grouped by similar:
    – wolf densities
    – human densities
    – land use
    • “Non-range” (12)
    – No known packs
    P. 10

    View Slide

  4. Finding #1:
    Attitudes about wolves
    • State residents held attitudes 
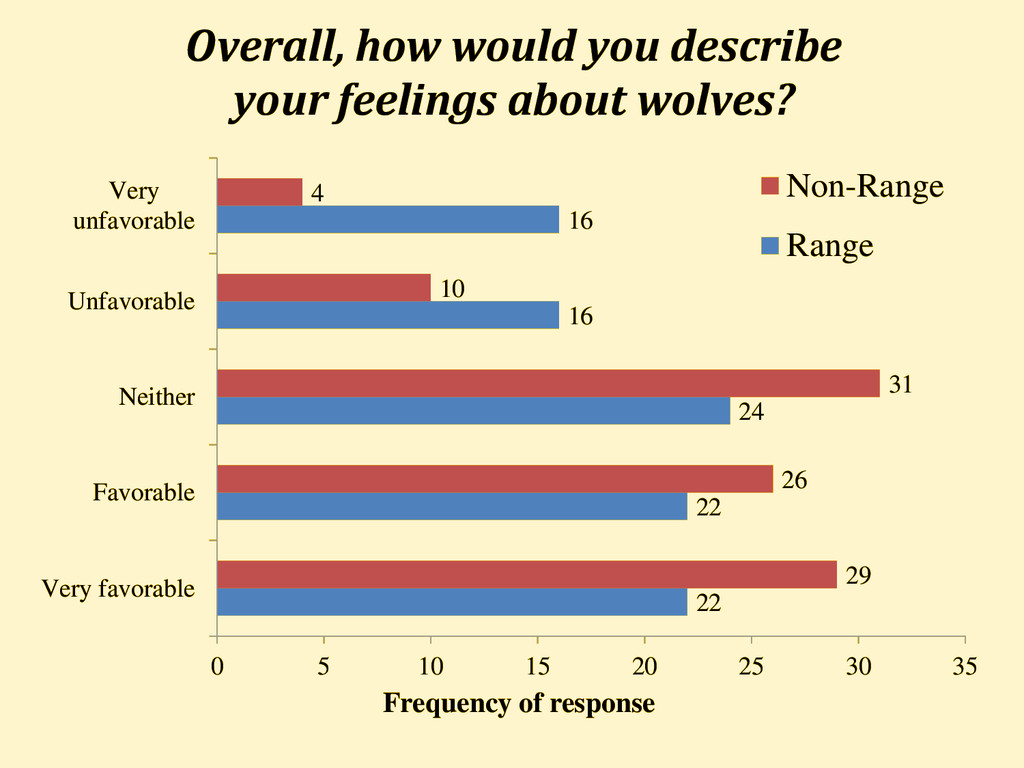
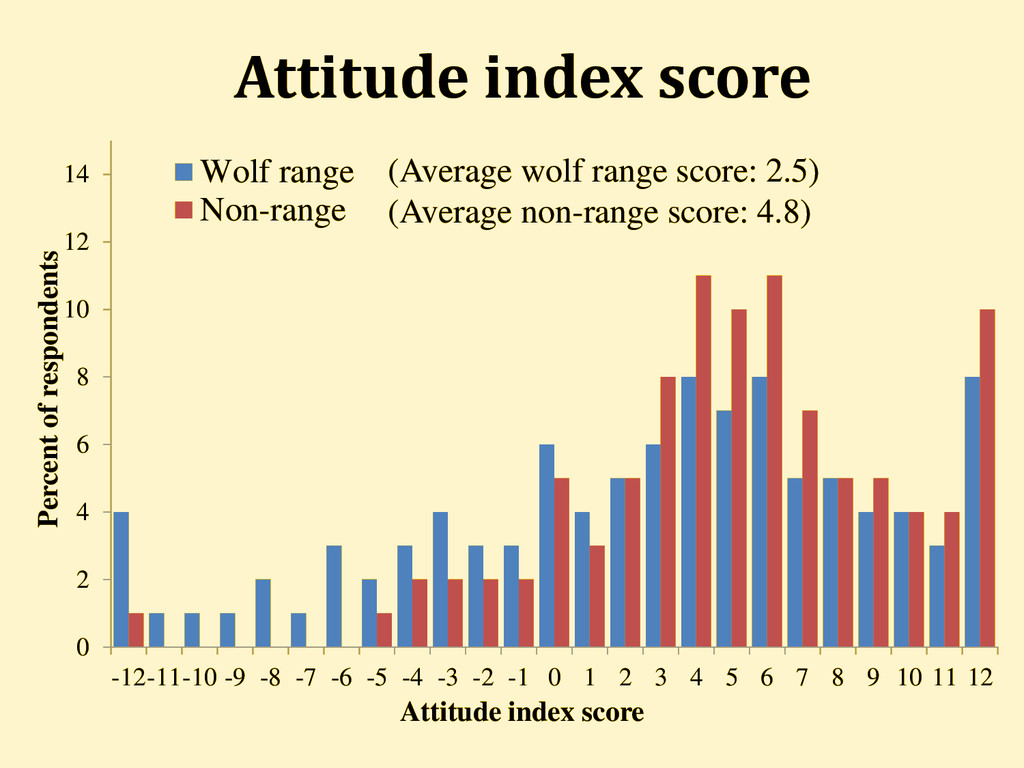
toward wolves
    that were more favorable than unfavorable
    – by a small margin within wolf range
    – and by a larger margin outside wolf range.
    • A relatively high percentage of respondents
    had neither favorable nor unfavorable feelings
    toward wolves
    p. 24

    View Slide

  5. Overall, how would you describe
    your feelings about wolves?
    22
    22
    24
    16
    16
    29
    26
    31
    10
    4
    0 5 10 15 20 25 30 35
    Very favorable
    Favorable
    Neither
    Unfavorable
    Very
    unfavorable
    Frequency of response
    Non-Range
    Range

    View Slide

  6. 6 question attitude index
    Wolves are special animals that deserve our admiration.
    People and wolves should be able to co-exist.
    Predators like wolves keep nature in balance.
    The previous generations were right in eliminating wolves
    from the landscape.
    Wolves provide no benefits to people.
    Wolves are a nuisance for people.

    View Slide

  7. Attitude index score
    0
    2
    4
    6
    8
    10
    12
    14
    -12-11-10 -9 -8 -7 -6 -5 -4 -3 -2 -1 0 1 2 3 4 5 6 7 8 9 10 11 12
    Percent of respondents
    Attitude index score
    Wolf range
    Non-range
    (Average wolf range score: 2.5)
    (Average non-range score: 4.8)

    View Slide

  8. Mean scores on wolf attitude scale
    by sampling cluster
    p. 83

    View Slide

  9. Finding #2:
    Population preferences
    • Most frequent response for residents 
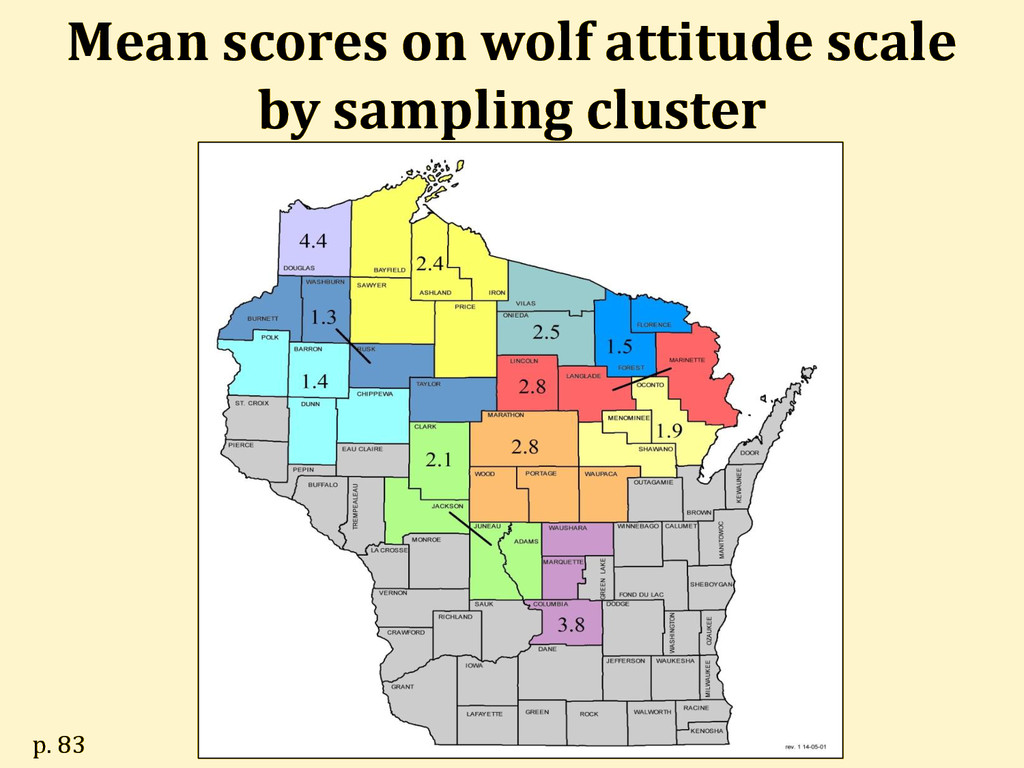
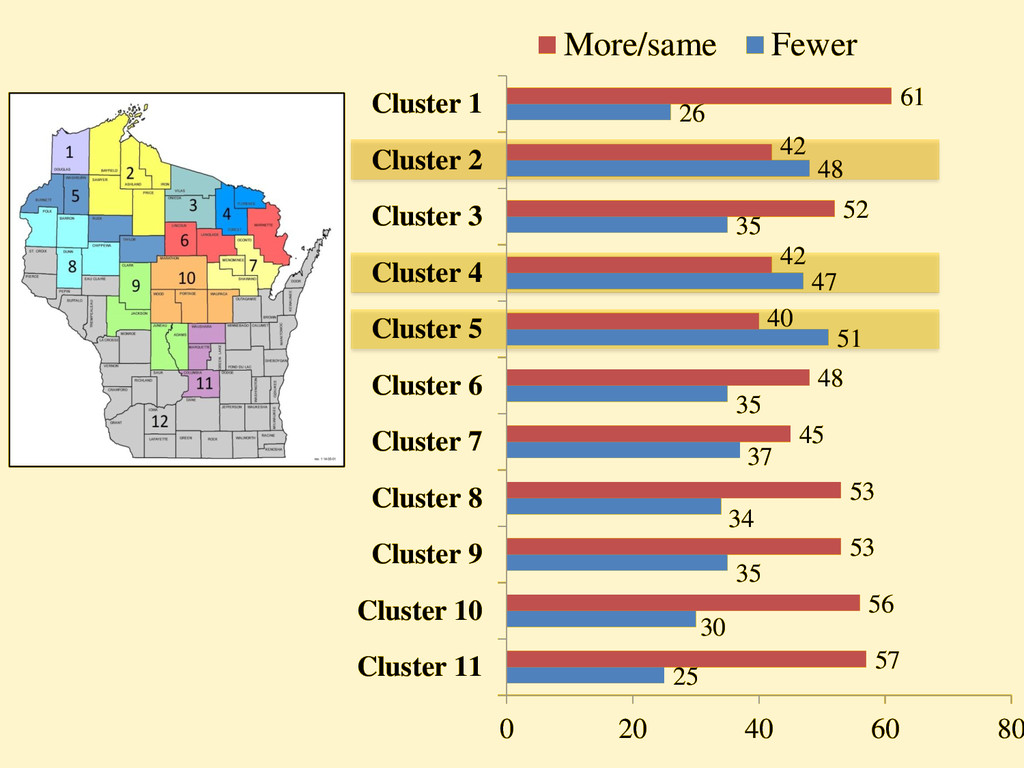
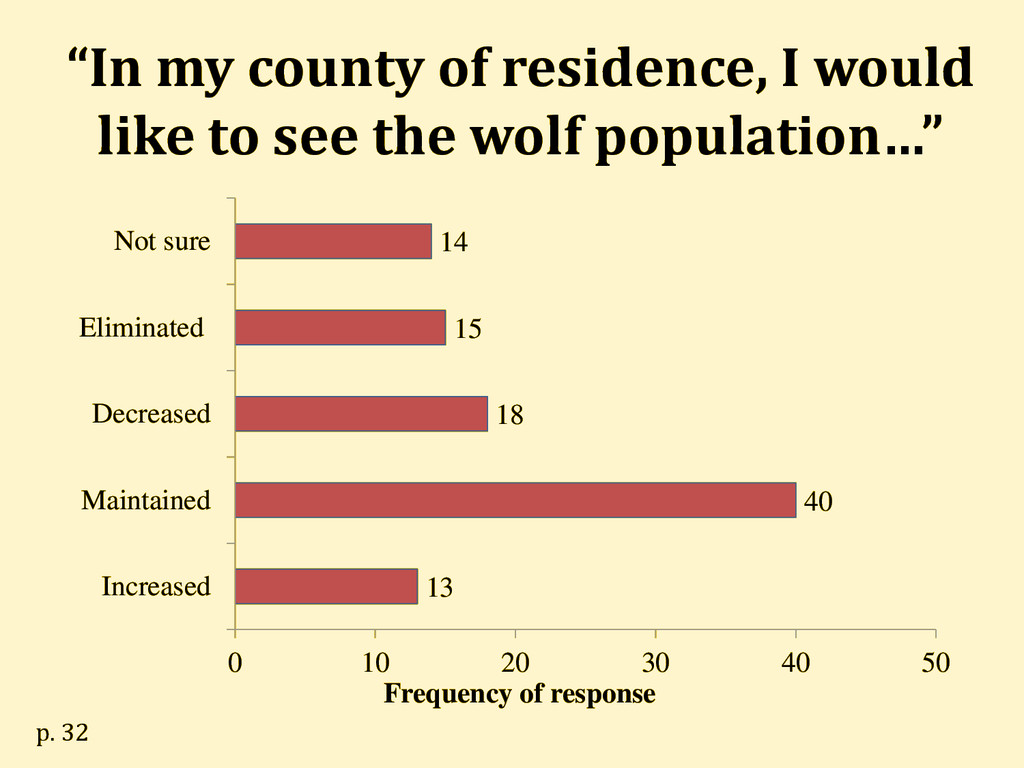
in range
    and non-range was to maintain wolves near
    current levels
    – A high % of non-range were unsure
    – More people selected “more” wolves than “less”
    wolves, even in wolf range
    • Attitude indices predict population goal
    preferences at state and county scale

    View Slide

  10. Preferences for
    statewide wolf numbers
    4
    15
    26
    15
    12 11
    17
    6
    21
    29
    8
    6
    3
    28
    0
    5
    10
    15
    20
    25
    30
    35
    Many
    more
    More Same Fewer Many
    fewer
    Zero Don't
    know
    Frequency of response (%)
    Range Non-Range
    p. 31

    View Slide

  11. “In which kinds of areas would you support
    allowing wolves 
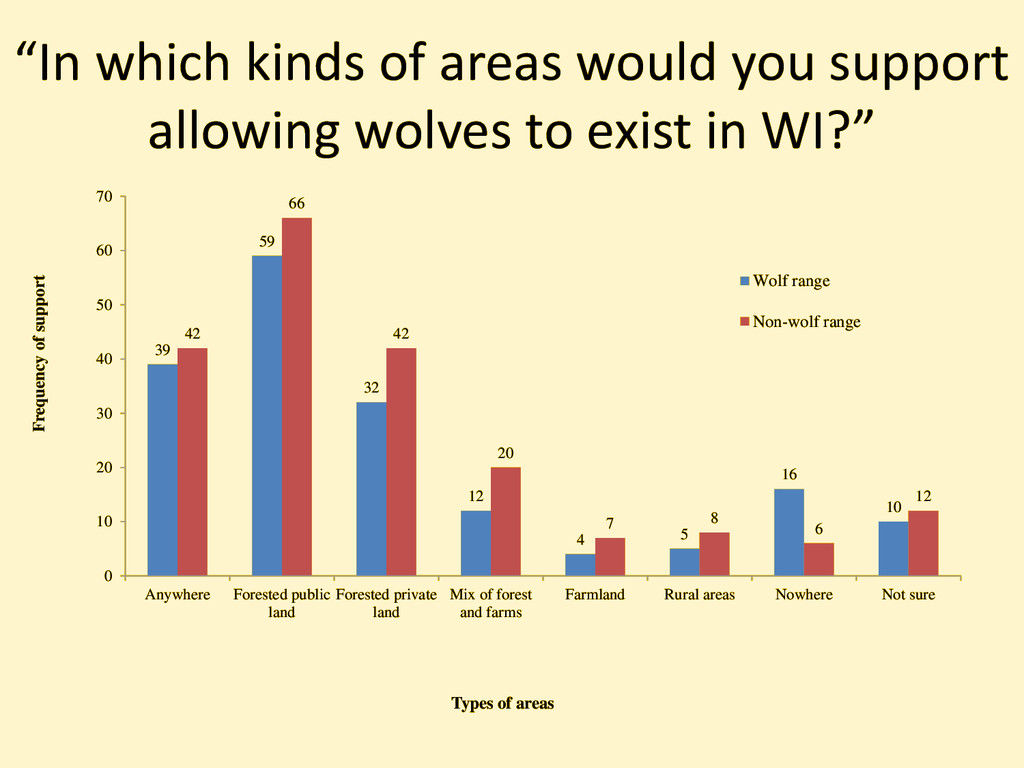
to exist in WI?”
    39
    59
    32
    12
    4 5
    16
    10
    42
    66
    42
    20
    7 8
    6
    12
    0
    10
    20
    30
    40
    50
    60
    70
    Anywhere Forested public
    land
    Forested private
    land
    Mix of forest
    and farms
    Farmland Rural areas Nowhere Not sure
    Frequency of support
    Types of areas
    Wolf range
    Non-wolf range

    View Slide

  12. Comparing respondents who want
    more, the same number of, or 
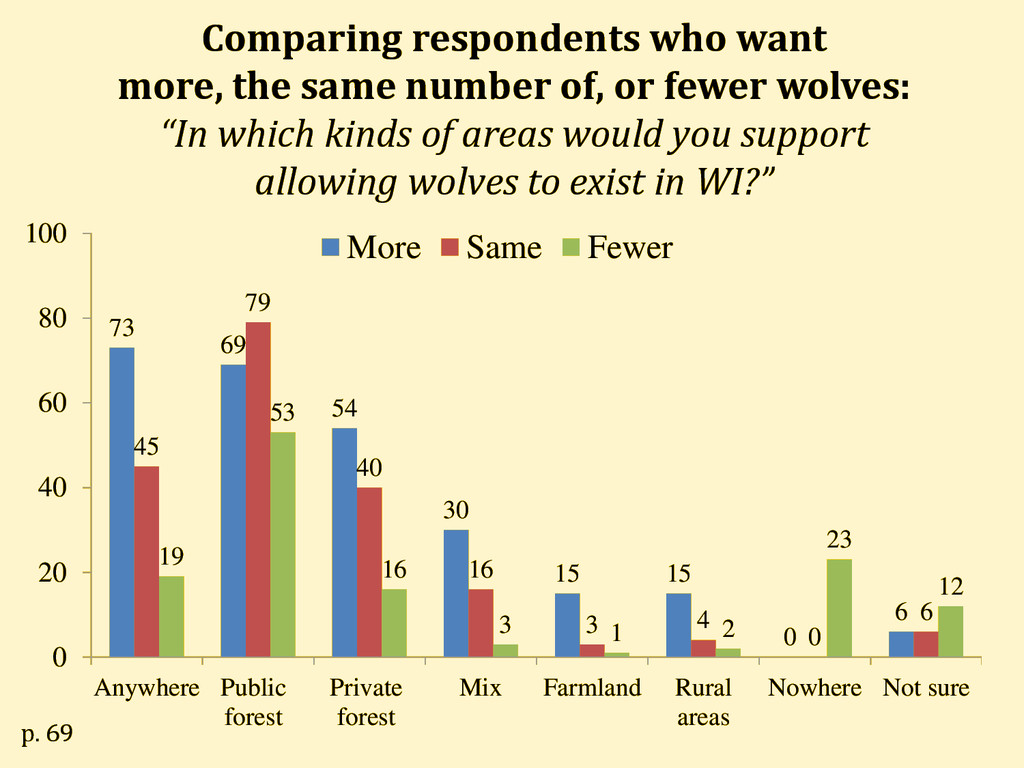
fewer wolves:
    “In which kinds of areas would you support
    allowing wolves to exist in WI?”
    73
    69
    54
    30
    15 15
    0
    6
    45
    79
    40
    16
    3 4
    0
    6
    19
    53
    16
    3 1 2
    23
    12
    0
    20
    40
    60
    80
    100
    Anywhere Public
    forest
    Private
    forest
    Mix Farmland Rural
    areas
    Nowhere Not sure
    More Same Fewer
    p. 69

    View Slide

  13. 25
    30
    35
    34
    37
    35
    51
    47
    35
    48
    26
    57
    56
    53
    53
    45
    48
    40
    42
    52
    42
    61
    0 20 40 60 80
    Cluster 11
    Cluster 10
    Cluster 9
    Cluster 8
    Cluster 7
    Cluster 6
    Cluster 5
    Cluster 4
    Cluster 3
    Cluster 2
    Cluster 1
    More/same Fewer

    View Slide

  14. Perceptions of wolf abundance
    in residents’ county
    6
    14
    45
    18
    17
    0 10 20 30 40 50
    Very abundant
    Abundant
    Present, but not
    abundant
    Rare/ very rare
    Don't know
    Frequency of response
    p. 37

    View Slide

  15. “In my county of residence, I would
    like to see the wolf population…”
    13
    40
    18
    15
    14
    0 10 20 30 40 50
    Increased
    Maintained
    Decreased
    Eliminated
    Not sure
    Frequency of response
    p. 32

    View Slide

  16. Willingness to live near wolves
    28
    21
    7
    24
    19
    0 5 10 15 20 25 30
    Yes, absolutely
    Yes, maybe
    Not sure
    No, rather not
    Absolutely not
    Frequency of response

    View Slide

  17. Finding #3
    Best Predictors Wolf attitudes
    Raised in Rural
    area
    Raised in Urban
    area
    Deer hunter Not a deer
    hunter
    +
    +

    View Slide

  18. Preferences for statewide
    population trends based on
    classification of residence
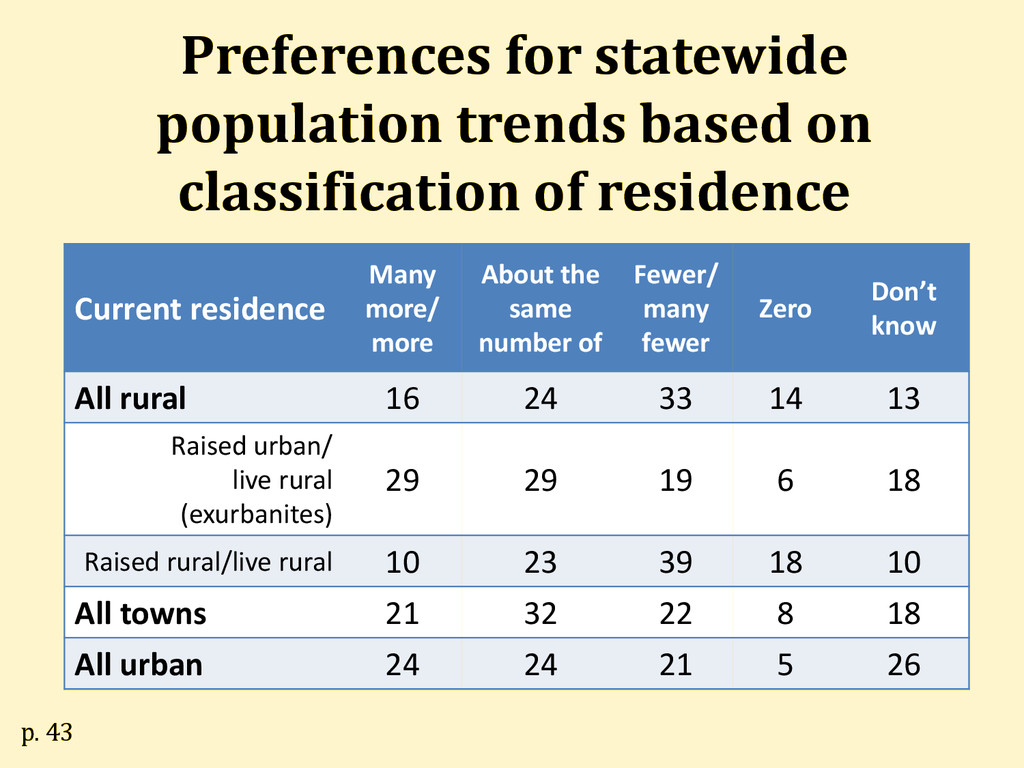
    Current residence
    Many
    more/
    more
    About the
    same
    number of
    Fewer/
    many
    fewer
    Zero
    Don’t
    know
    All rural 16 24 33 14 13
    Raised urban/
    live rural
    (exurbanites)
    29 29 19 6 18
    Raised rural/live rural 10 23 39 18 10
    All towns 21 32 22 8 18
    All urban 24 24 21 5 26
    p. 43

    View Slide

  19. Influence of deer hunting
    participation on preferences for
    statewide wolf 
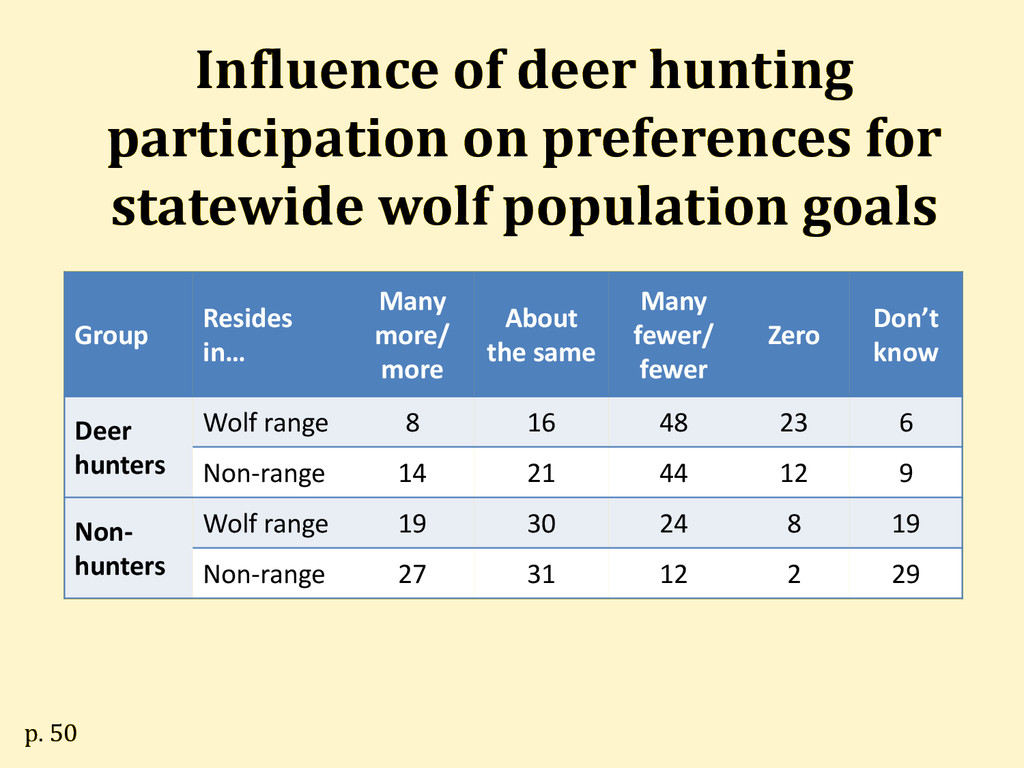
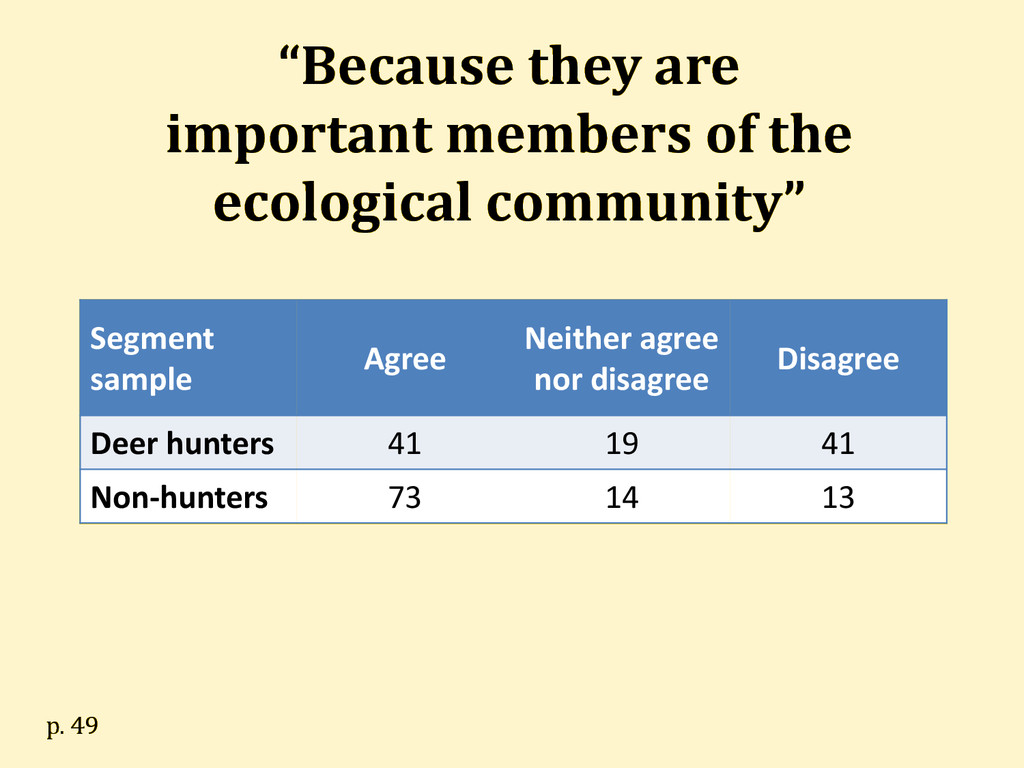
population goals
    Group
    Resides
    in…
    Many
    more/
    more
    About
    the same
    Many
    fewer/
    fewer
    Zero
    Don’t
    know
    Deer
    hunters
    Wolf range 8 16 48 23 6
    Non-range 14 21 44 12 9
    Non-
    hunters
    Wolf range 19 30 24 8 19
    Non-range 27 31 12 2 29
    p. 50

    View Slide

  20. “Because they are
    important members of the
    ecological community”
    Segment
    sample
    Agree
    Neither agree
    nor disagree
    Disagree
    Deer hunters 41 19 41
    Non-hunters 73 14 13
    p. 49

    View Slide

  21. “To help keep deer in balance
    with their habitat”
    Segment
    sample
    Agree
    Neither agree
    nor disagree
    Disagree
    Deer hunters 26 14 61
    Non-hunters 62 18 20
    p. 49

    View Slide

  22. Finding #4: Support for lethal
    control is context dependent
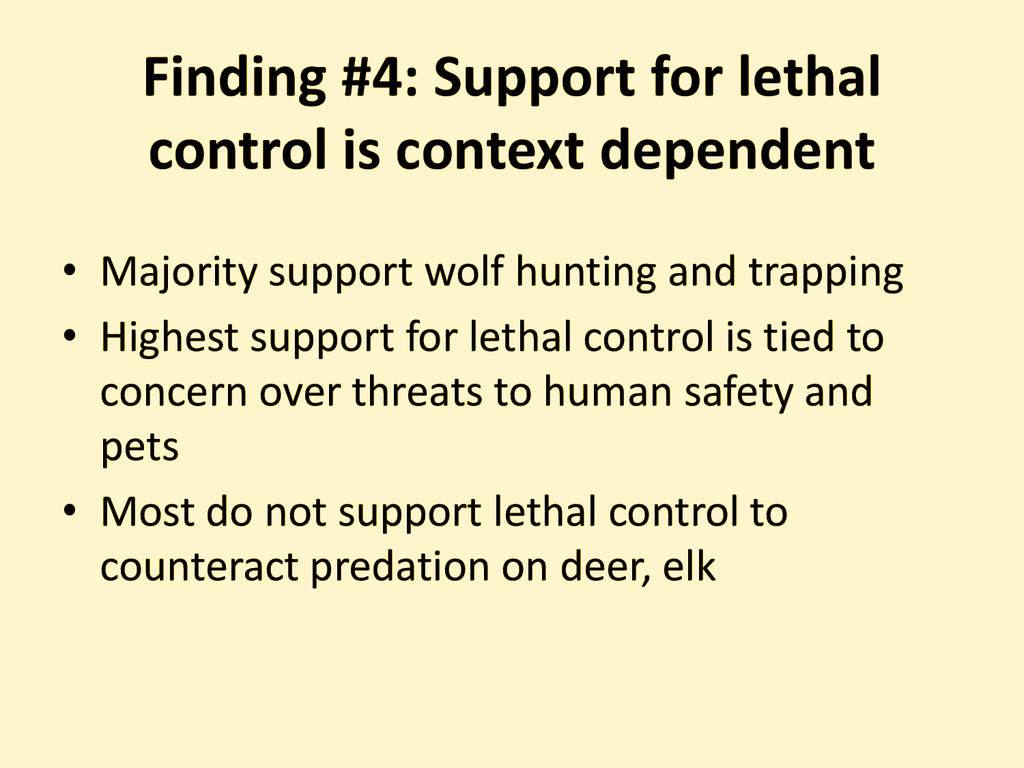
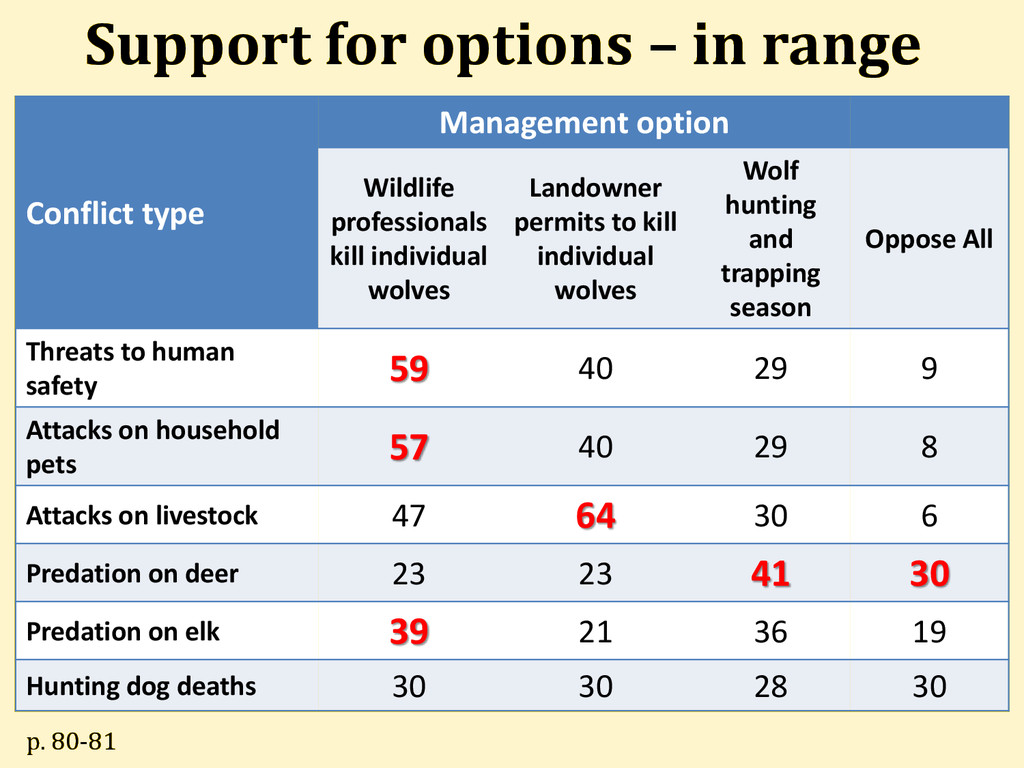
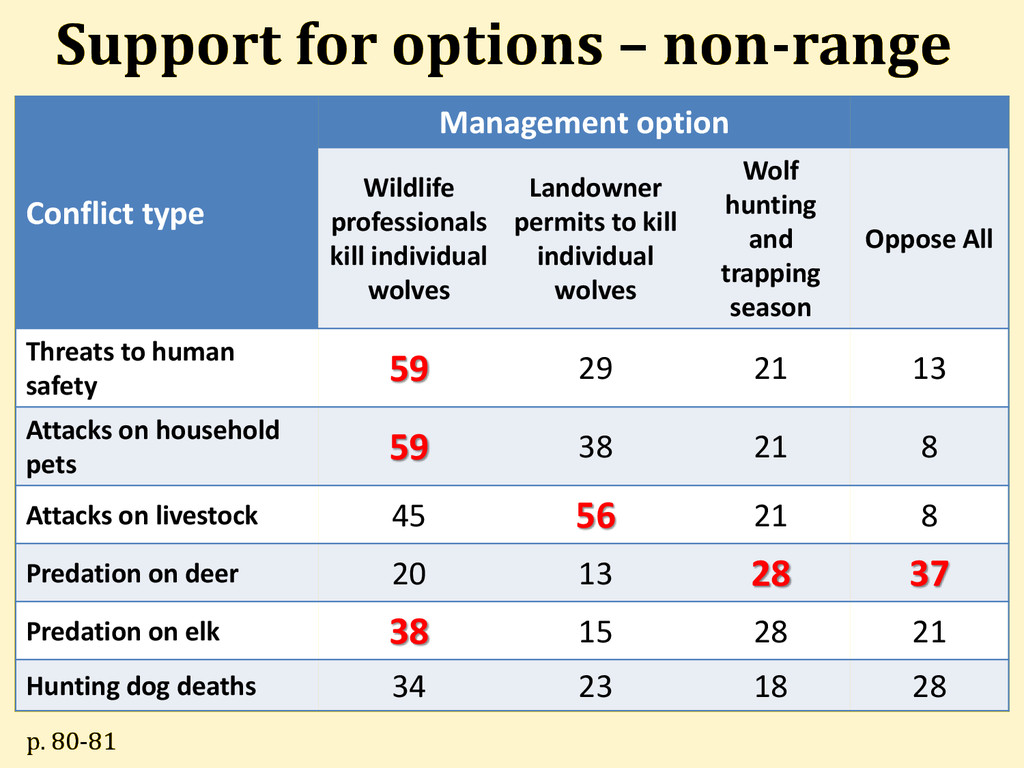
    • Majority support wolf hunting and trapping
    • Highest support for lethal control is tied to
    concern over threats to human safety and
    pets
    • Most do not support lethal control to
    counteract predation on deer, elk

    View Slide

  23. Majority support wolf harvest
    62
    21
    17
    Yes No Undecided
    51
    27
    22
    Yes No Undecided
    Range Non-range
    p. 75

    View Slide

  24. Support or opposition to a regulated
    wolf harvest season
    21
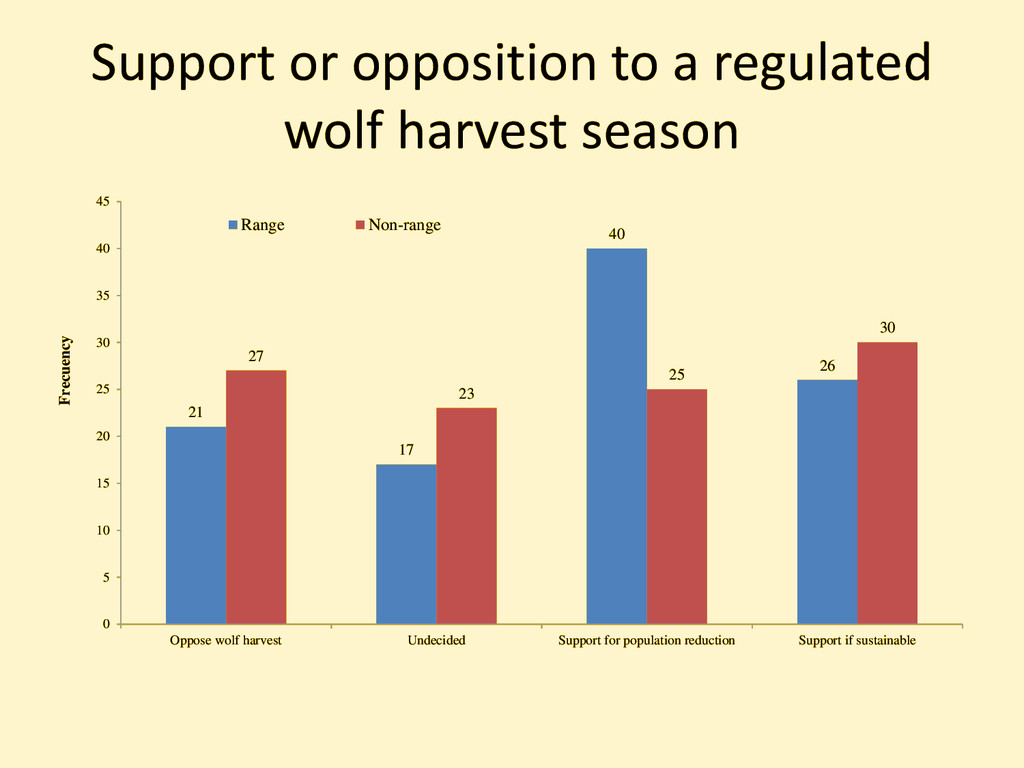
    17
    40
    26
    27
    23
    25
    30
    0
    5
    10
    15
    20
    25
    30
    35
    40
    45
    Oppose wolf harvest Undecided Support for population reduction Support if sustainable
    Frecuency
    Range Non-range

    View Slide

  25. Support for options – in range
    Conflict type
    Management option
    Wildlife
    professionals
    kill individual
    wolves
    Landowner
    permits to kill
    individual
    wolves
    Wolf
    hunting
    and
    trapping
    season
    Oppose All
    Threats to human
    safety
    59 40 29 9
    Attacks on household
    pets
    57 40 29 8
    Attacks on livestock 47 64 30 6
    Predation on deer 23 23 41 30
    Predation on elk 39 21 36 19
    Hunting dog deaths 30 30 28 30
    p. 80-81

    View Slide

  26. Support for options – non-range
    Conflict type
    Management option
    Wildlife
    professionals
    kill individual
    wolves
    Landowner
    permits to kill
    individual
    wolves
    Wolf
    hunting
    and
    trapping
    season
    Oppose All
    Threats to human
    safety
    59 29 21 13
    Attacks on household
    pets
    59 38 21 8
    Attacks on livestock 45 56 21 8
    Predation on deer 20 13 28 37
    Predation on elk 38 15 28 21
    Hunting dog deaths 34 23 18 28
    p. 80-81

    View Slide

  27. Questions

    View Slide