Upgrade to Pro — share decks privately, control downloads, hide ads and more …

Survival and Cause-Specific Mortality of White-tailed Deer in Wisconsin

Survival and Cause-Specific Mortality of White-tailed Deer in Wisconsin

Authors: Tim Van Deelen, Karl Martin, Dan Storm, Andrew Norton, Camille Warbington, Brittany Peterson, Ryan Walrath and Chris Jacques. Presentation given at the 2015 Midwest Wolf Stewards Conference at Northland College. April 2015.

More Decks by Sigurd Olson Environmental Institute

Other Decks in Research

Transcript

  1. Survival and Cause-Specific Mortality of
    White-tailed Deer in Wisconsin
    Photo credit: Dean Dekarske
    Tim Van Deelen, Karl Martin, Dan Storm, Andrew Norton, Camille
    Warbington, Brittany Peterson,Ryan Walrath, Chris Jacques

    View Slide

  2. Figure 1. Principal components analysis revealed 12 concerns loaded significantly 
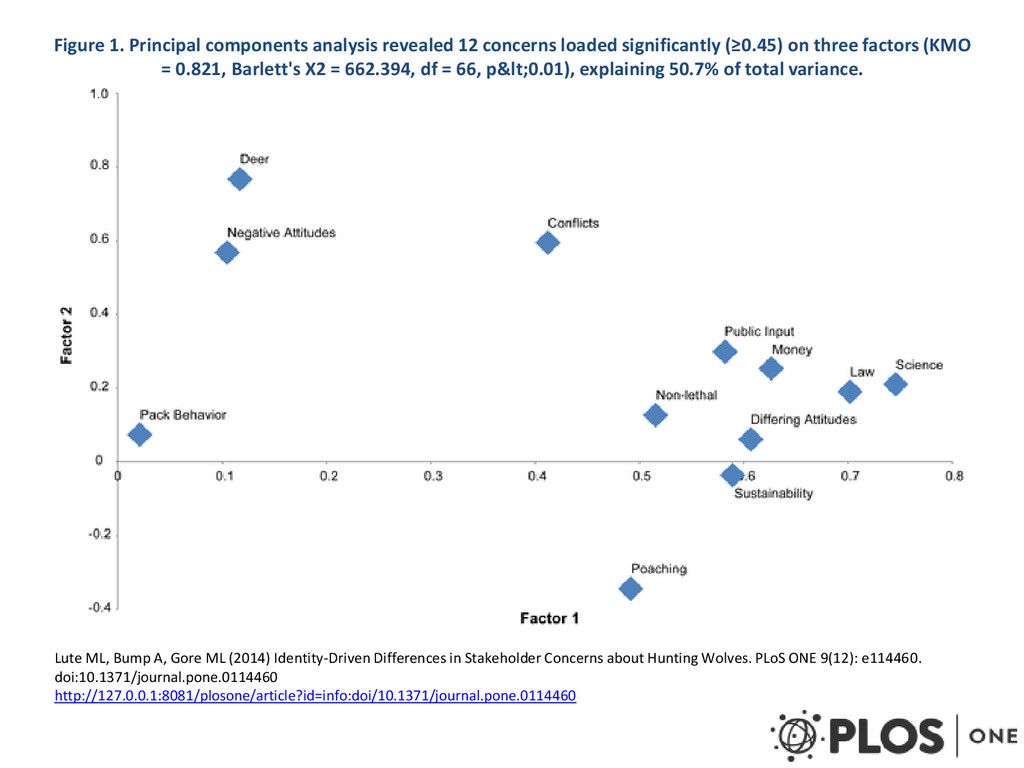
(≥0.45) on three factors (KMO
    = 0.821, Barlett's X2 = 662.394, df = 66, p<0.01), explaining 50.7% of total variance.
    Lute ML, Bump A, Gore ML (2014) Identity-Driven Differences in Stakeholder Concerns about Hunting Wolves. PLoS ONE 9(12): e114460.
    doi:10.1371/journal.pone.0114460
    http://127.0.0.1:8081/plosone/article?id=info:doi/10.1371/journal.pone.0114460

    View Slide

  3. Adult Survival
    2011-2015
    Fawn Recruitment
    2011-2013
    Two Telemetry Projects
    (with comparisons to modeling from harvest data)
    Collect data to improve
    population estimates
    Understand factors that
    are limiting recruitment

    View Slide

  4. Study Areas

    View Slide

  5. kootenaynaturephotos.com
    Northern Forest
    National Geographic Image Collection

    View Slide

  6. Eastern Farmland
    Kaylee Schroeder

    View Slide

  7. 2,158 deer handled
    • 1,001 radiocollared
    • 436 events
    Capture
    Results
    2011-2014

    View Slide

  8. Fawn Capture

    View Slide

  9. Adult Winter Capture
    Box Traps
    Darting
    Helicopter
    Netted Cage Traps
    Drop Nets

    View Slide

  10. Telemetry
    • Weekly bi-angulations
    • Occasional aerial telemetry (~5-6 times/year)

    View Slide

  11. Mortality Investigations
    •Field Necropsy and Site Investigation
    • Ante-mortem wounds, bruising
    • Portion consumed
    • Predator sign (cache, beds, scat, trails, etc.)
    •Veterinarian Necropsy
    •Proportional Assignment to cause

    View Slide

  12. 2011, n 48
    2012, n 46
    2013, n 45
    2011, 
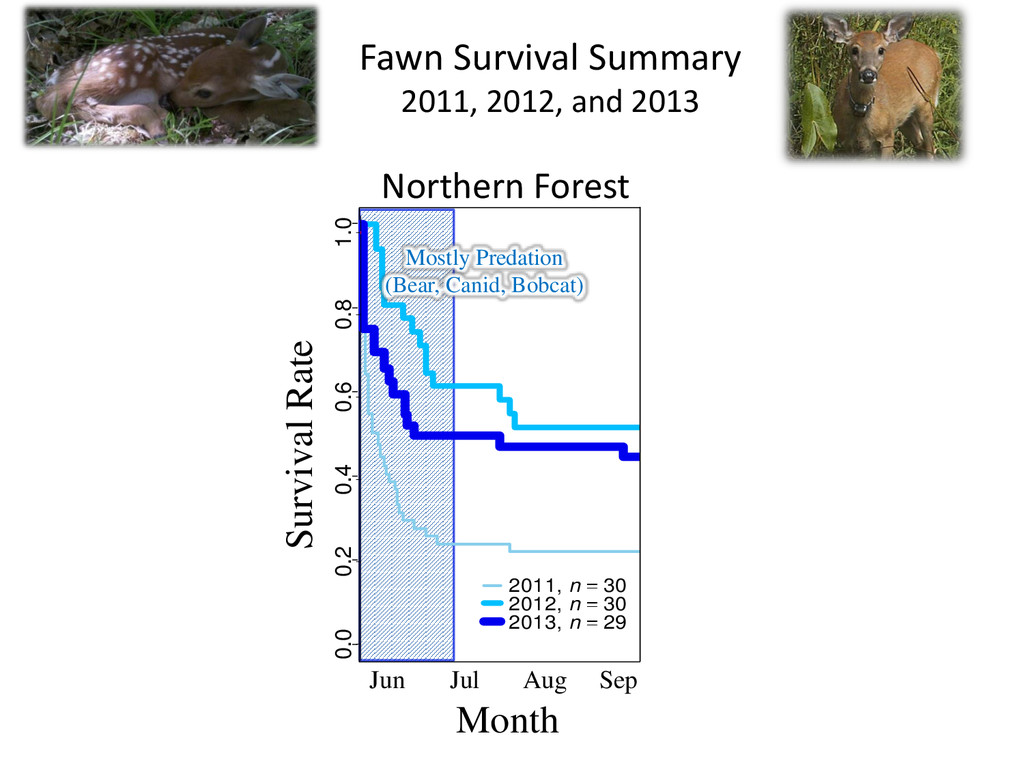
n 30
    2012, n 30
    2013, n 29
    0.0 0.2 0.4 0.6 0.8 1.0
    2011, n 48
    2012, n 46
    2013, n 45
    2011, n 30
    2012, n 30
    2013, n 29
    Survival Rate
    Northern Forest
    Month
    Jun Jul Aug Sep
    Fawn Survival Summary
    2011, 2012, and 2013
    Mostly Predation
    (Bear, Canid, Bobcat)
    0.0 0.2 0.4 0.6 0.8 1.0
    2011, n 48
    2012, n 46
    2013, n 45
    2011, n 3
    2012, n 3
    2013, n 2

    View Slide

  13. 0%
    5%
    10%
    15%
    20%
    0%
    5%
    10%
    15%
    20%
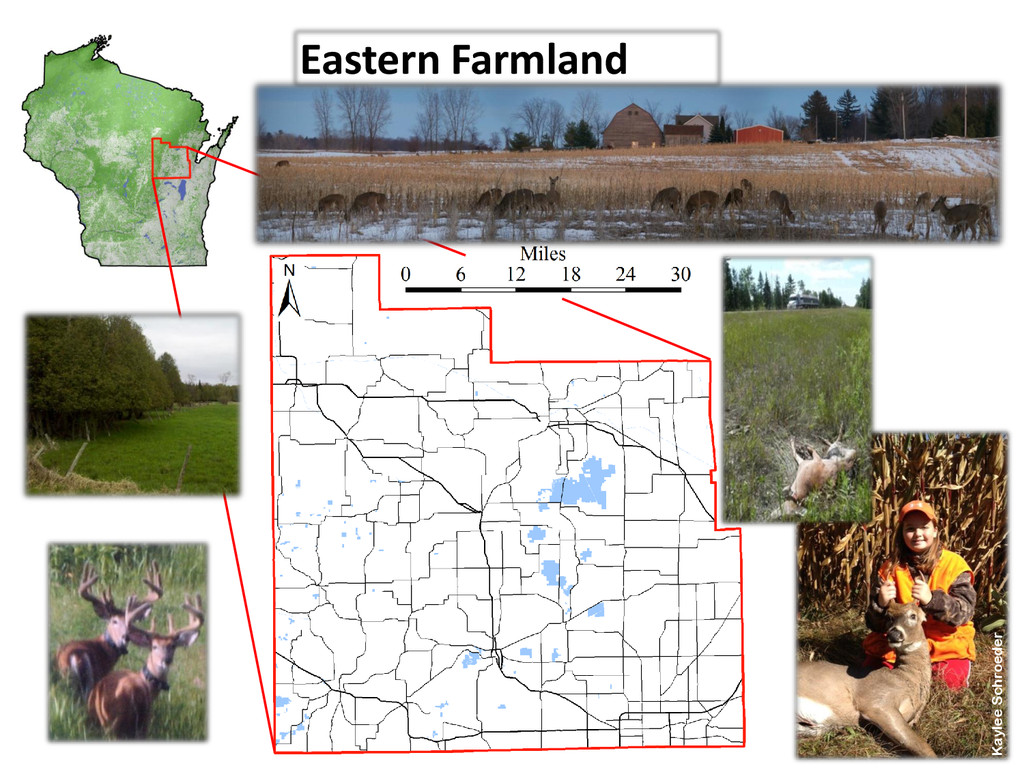
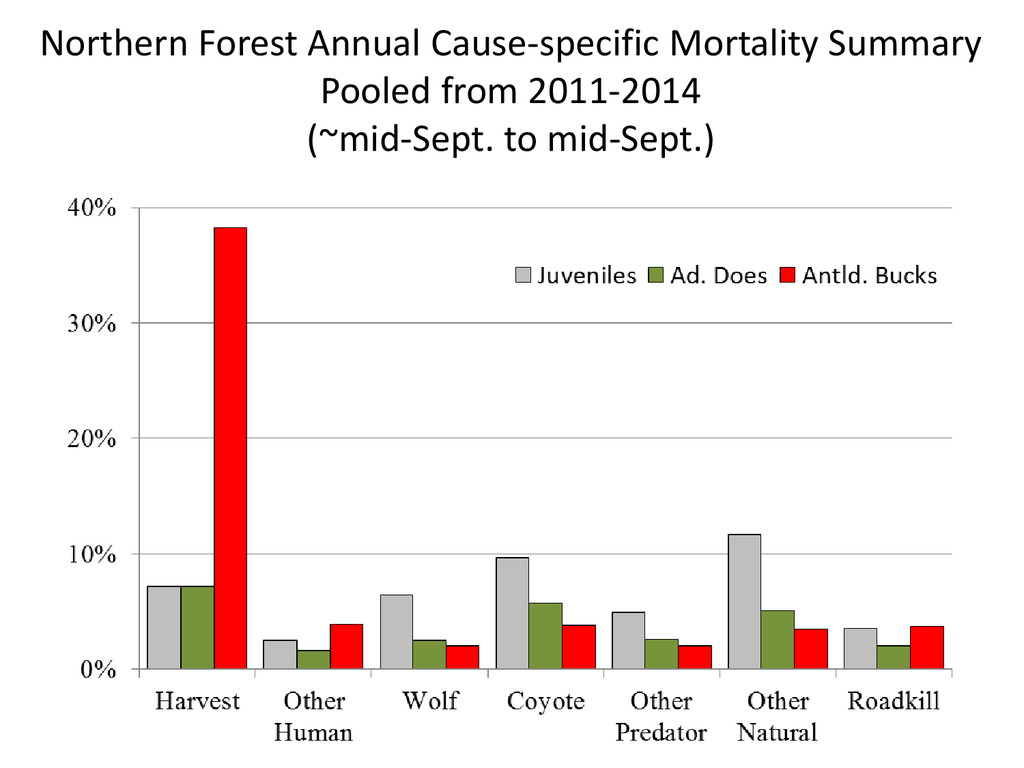
    Annual Fawn (0-4 mo. old) Mortality Summary
    2011-2013
    Radiocollared deer that died from each cause
    Eastern Farmland
    29-33%
    n = 139 radiocollared
    Northern Forest
    48-78%
    n = 89 radiocollared

    View Slide

  14. Modeling: Percent fawns in fall deer
    harvest
    58 wolf-range DMUs, 1979-2005

    View Slide

  15. Northern Forest Annual Cause-specific Mortality Summary
    Pooled from 2011-2014
    (~mid-Sept. to mid-Sept.)

    View Slide

  16. Northern Forest Annual Cause-specific Mortality Summary
    Pooled from 2011-2014
    (~mid-Sept. to mid-Sept.)

    View Slide

  17. 11%
    Northern Forest Annual Cause-specific Mortality Summary
    Pooled from 2011-2014
    (~mid-Sept. to mid-Sept.)

    View Slide

  18. 21%
    Northern Forest Annual Cause-specific Mortality Summary
    Pooled from 2011-2014
    (~mid-Sept. to mid-Sept.)

    View Slide

  19. Annual Non-harvest Mortality Summary
    2011-2014
    21%
    …but this is variable depending
    on the winter. Likely below 5% in
    very mild winter and >30% is
    severe winter…
    Compensatory mortality???

    View Slide

  20. Modeling: mortality of Adult Does
    58 wolf-range DMUs, 1979-2005

    View Slide

  21. Survival Rate
    Jan Feb Mar Apr May Jun Jul Aug Sep
    Annual Non-harvest Mortality Summary

    View Slide

  22. 0%
    10%
    20%
    30%
    40%
    50%
    60%
    2011 2012 2013 2014
    Juvenile North Adult North Juvenile East Adult East
    Overall Hazard Variation
    Model Δ DIC
    Yearint
    + Ageint
    0
    NULL 52.7
    Model Δ DIC
    Yearint
    + Ageadd
    0
    NULL 6.8
    n = 546; events = 54
    Northern Forest Eastern Farmland
    n = 574; events = 125
    Mortality Rate (~Jan. – Sep.)
    Southunt

    View Slide

  23. Overall Mortality Northern Forest
    0%
    10%
    20%
    30%
    40%
    50%
    60%
    2011 2012 2013 2014
    Min. Temp.
    Snow Depth
    Southunt

    View Slide

  24. 2011 2012 2013 2014
    Human
    Predation
    Starvation
    Cause-specific Mortality
    Northern Forest Eastern Farmland
    Juveniles
    Adults
    0%
    10%
    20%
    30%
    40%
    50%
    2011 2012 2013 2014
    0%
    10%
    20%
    30%
    40%
    50%
    Southunt

    View Slide

  25. Modeling: growth rate of DMU deer
    populations
    58 wolf-range DMUs, 1979-2005

    View Slide

  26. In Wisconsin’s wolf range…
    1. Deer survival from birth through 
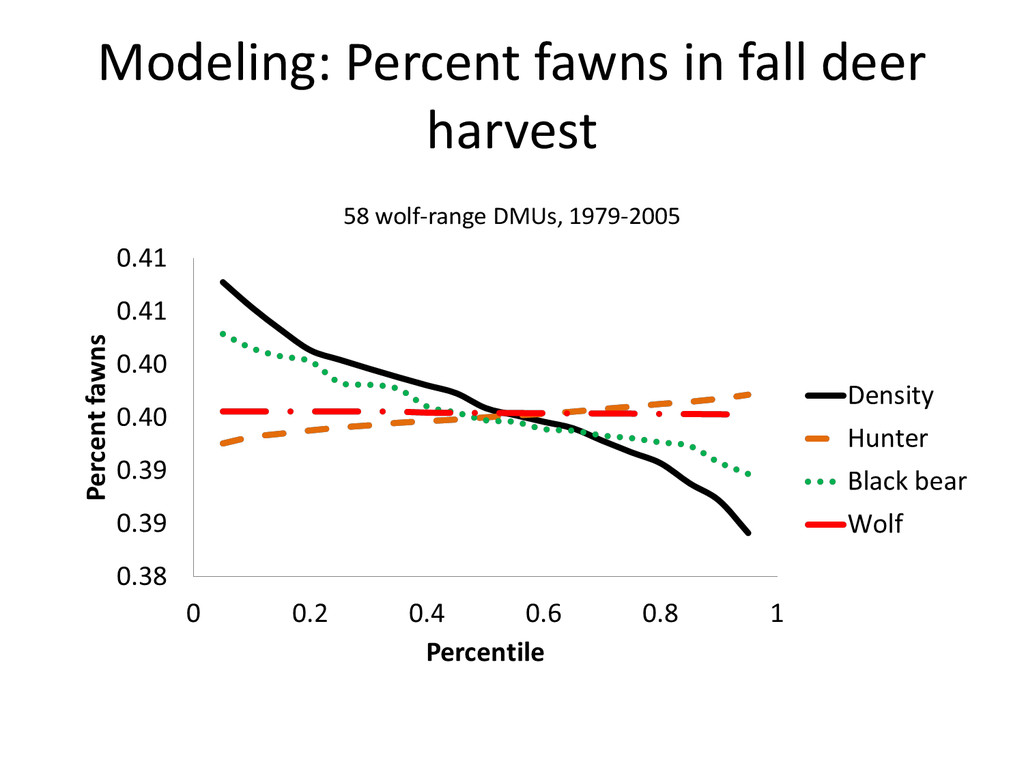
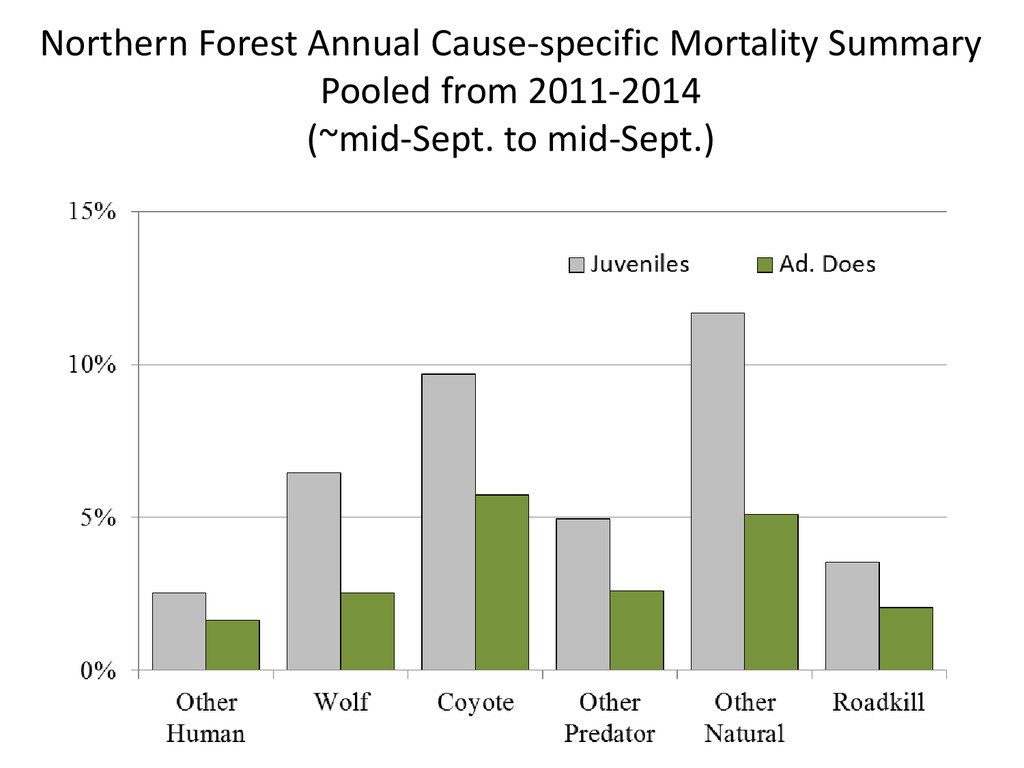
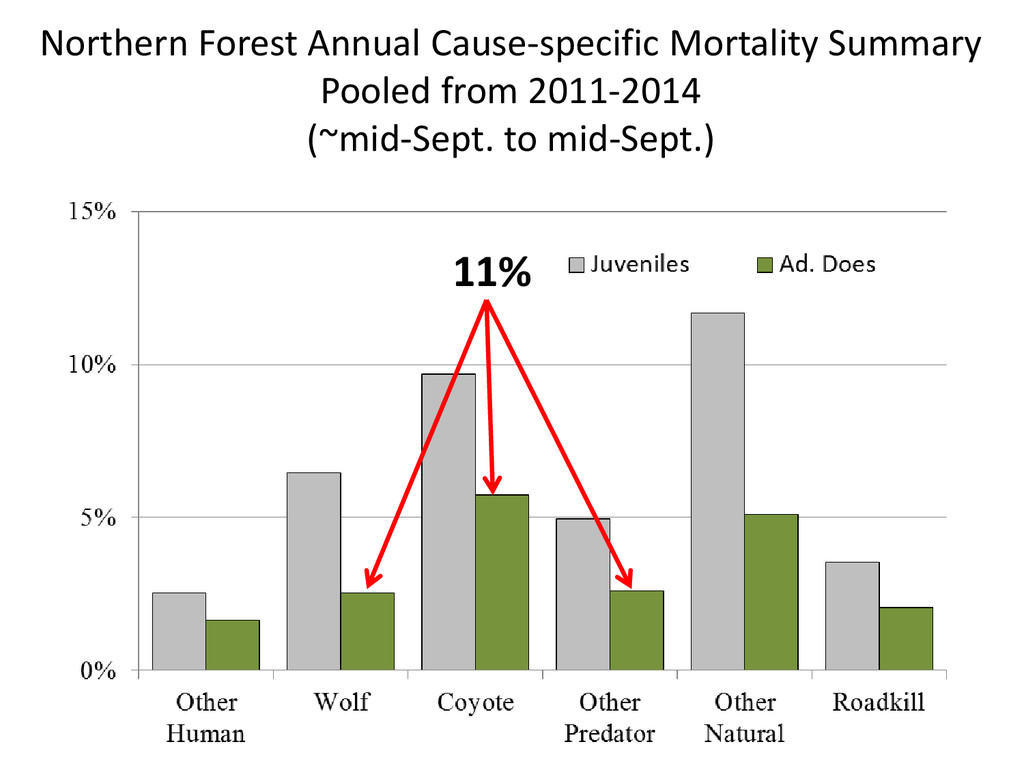
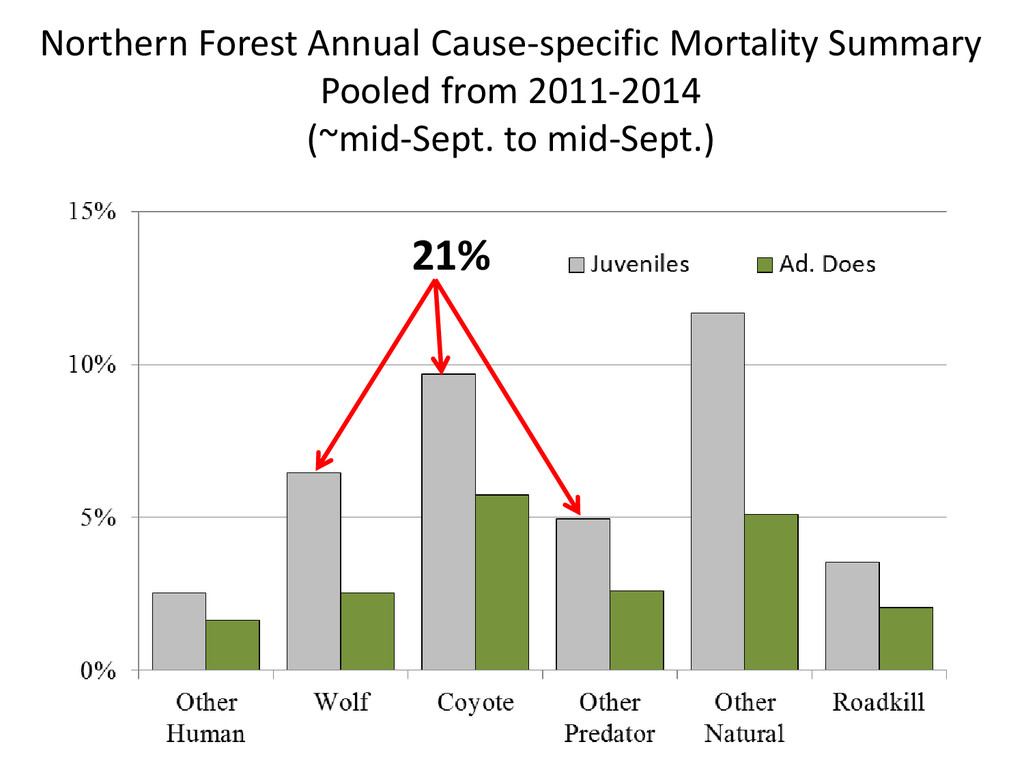
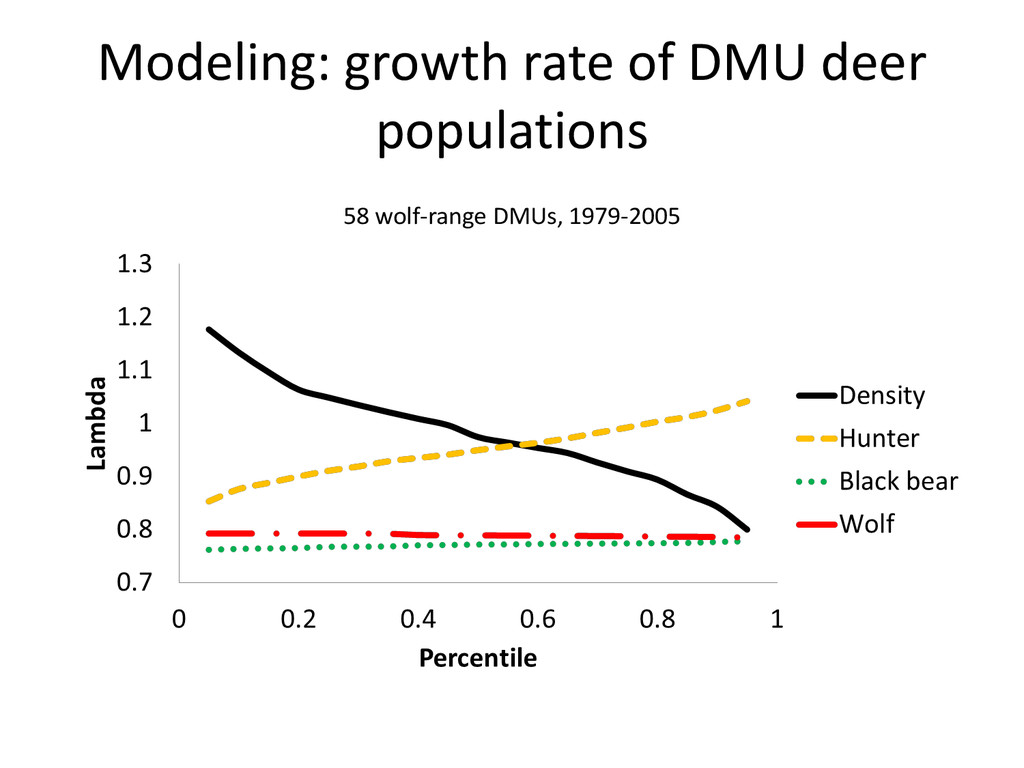
first year of life is variable
    • likely reflects phenology of spring green-up and winter
    severity
    • High bear predation mortality before 4 months of age
    2. Adult (>1 yr old) survival is less variable and primarily depends
    on harvest regulations
    • For antlered deer, hunter harvest is by far the leading cause
    • For does, depends on antlerless tag allocation, but human-
    related mortality plus starvation generally exceed predation
    rates, especially if predation is compensatory
    3. Hunting and overwinter weather probably have the greatest
    impacts on deer population dynamics
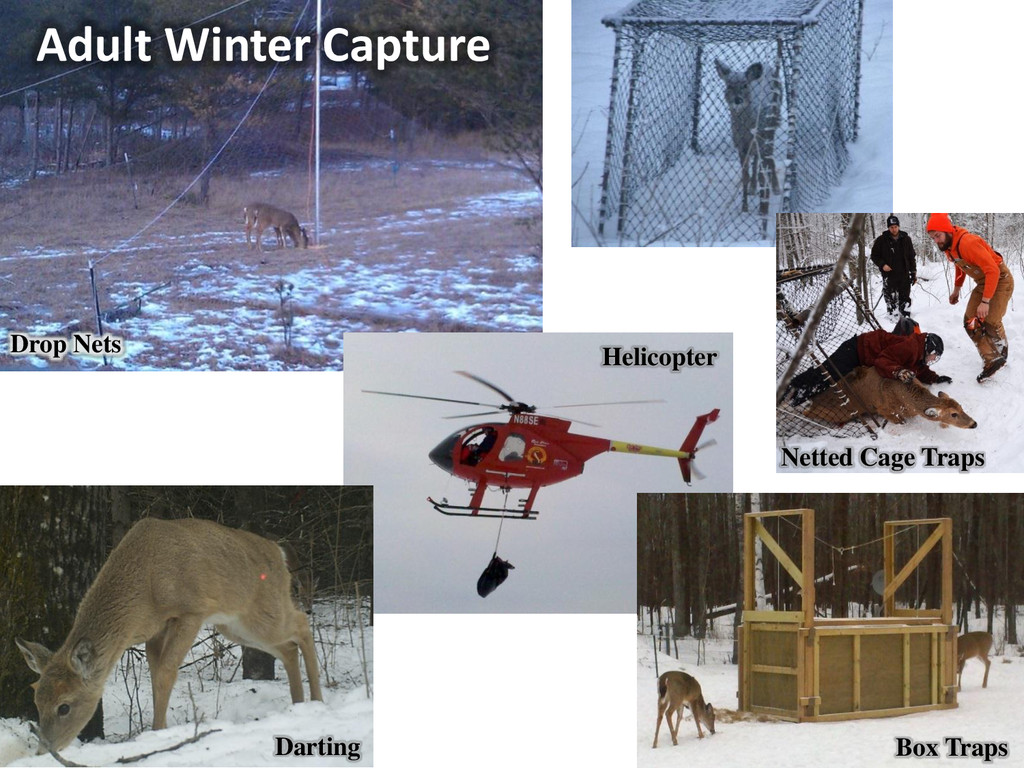
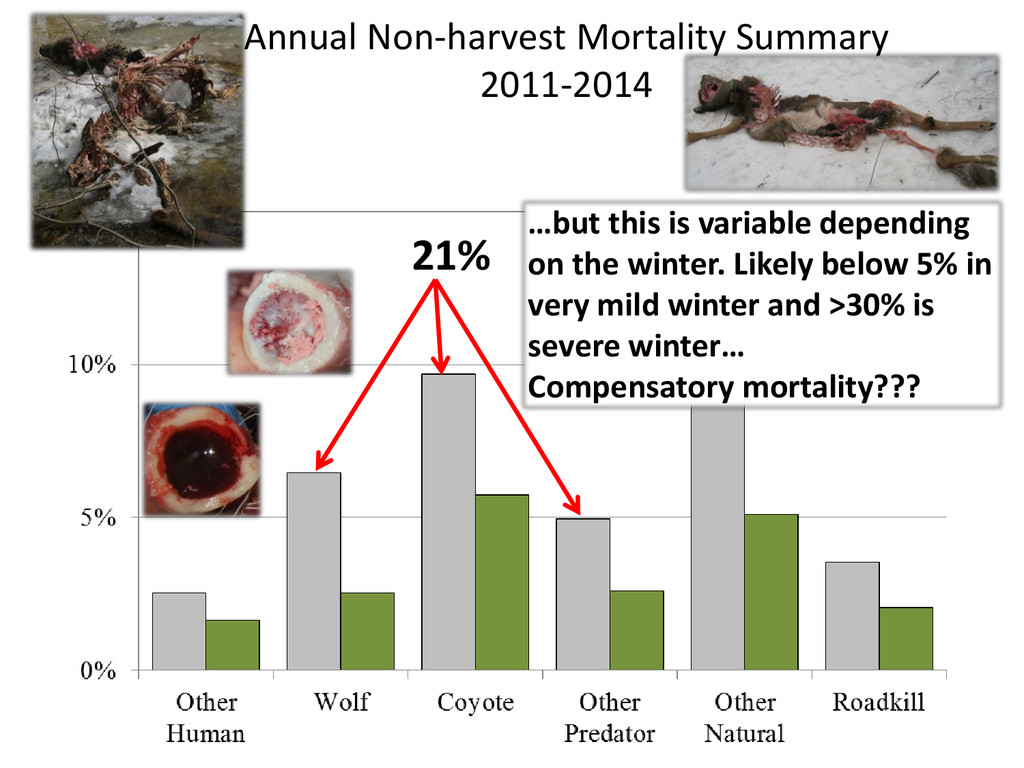
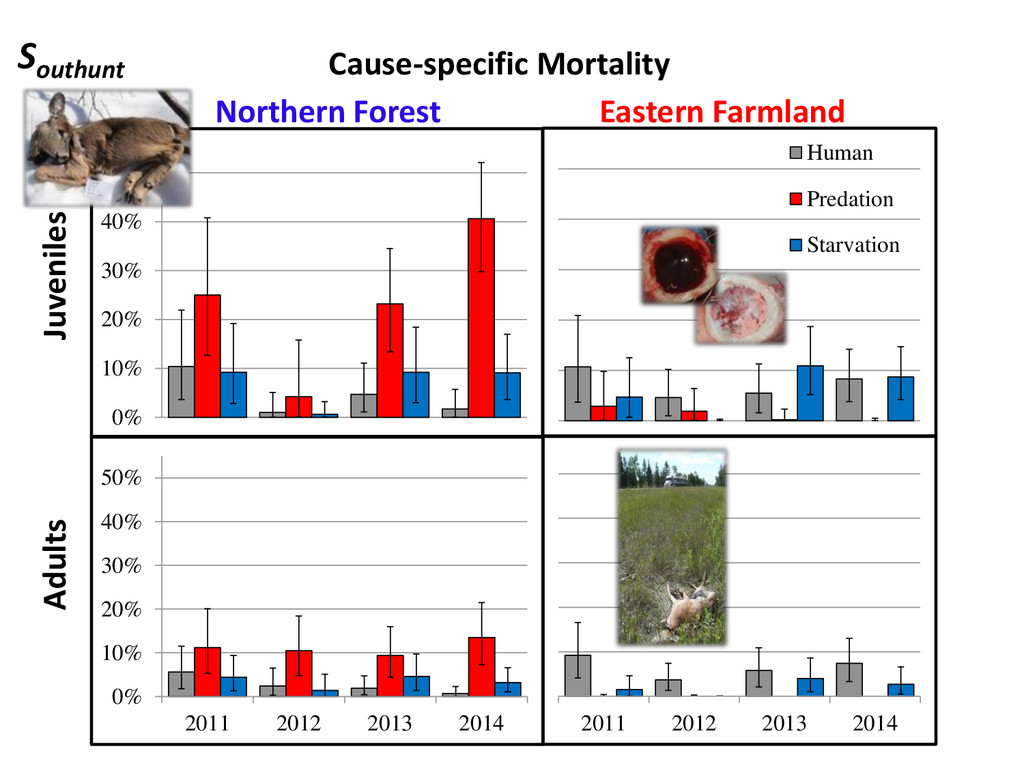
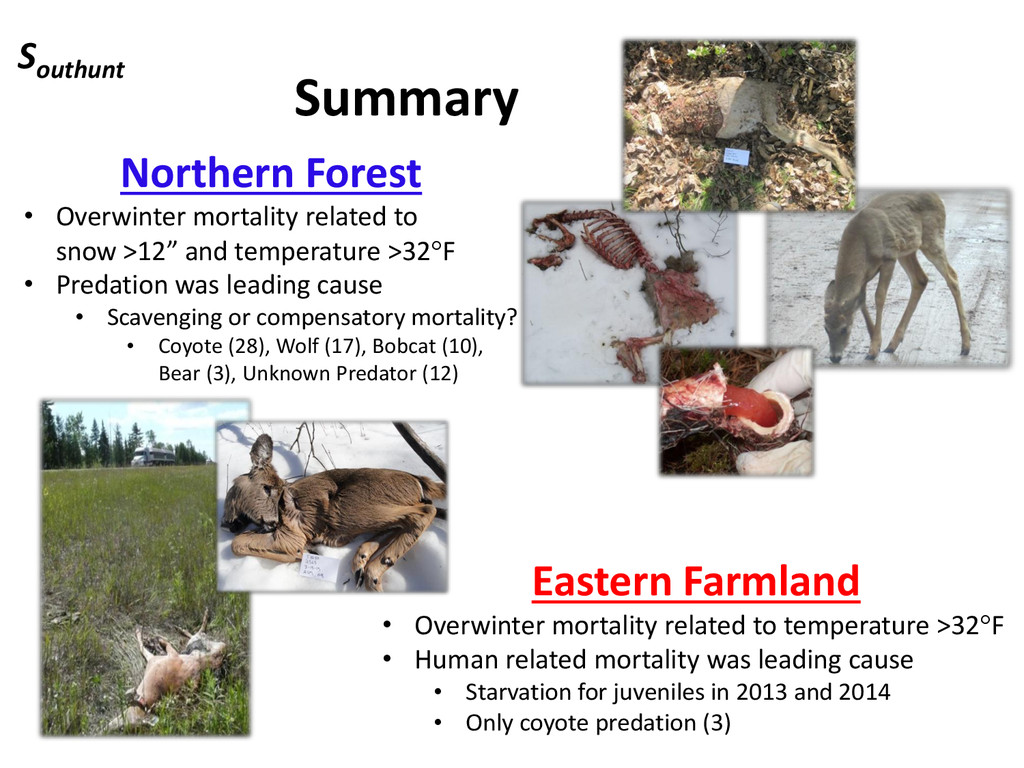
    View Slide

  27. Summary
    Northern Forest
    • Overwinter mortality related to
    snow >12” and temperature >32F
    • Predation was leading cause
    • Scavenging or compensatory mortality?
    • Coyote (28), Wolf (17), Bobcat (10),
    Bear (3), Unknown Predator (12)
    Eastern Farmland
    • Overwinter mortality related to temperature >32F
    • Human related mortality was leading cause
    • Starvation for juveniles in 2013 and 2014
    • Only coyote predation (3)
    Southunt

    View Slide

  28. Integration of Harvest and Time-to-Event Data Used to
    Estimate Demographic Parameters for White-tailed Deer
    Andrew Norton
    April 29 2015

    View Slide

  29. Data collection and analysis would not be possible without
    WIDNR: 
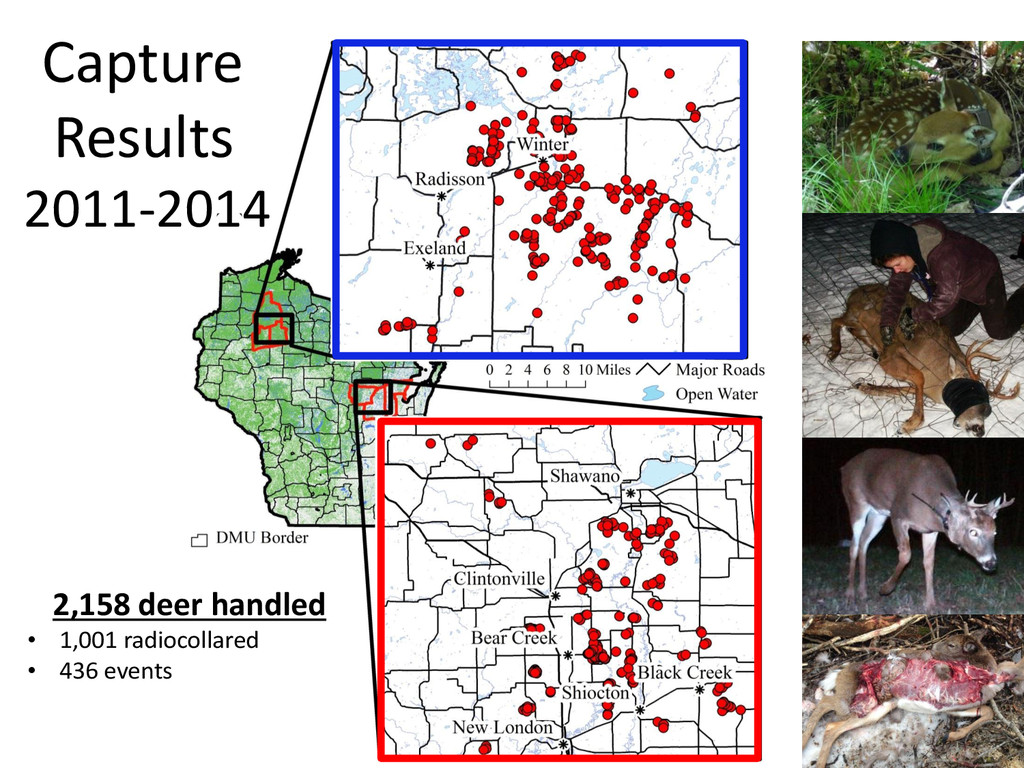
Science Services, Wildlife Management, Law Enforcement, Wildlife Health
    Individuals: Dan Storm, Scott Hull, Robert Rolley, Mike Watt, Ryan Walrath, Brittany
    Peterson, Brian Dhuey, Camille Warbington, Marcus Mueller, Christine Priest, Aaron
    Johnson, Mike Preisler, Chris Jacques, >40 Field Technicians
    >1,000 volunteers and landowners
    Funding and Support
    Dajun Wang

    View Slide