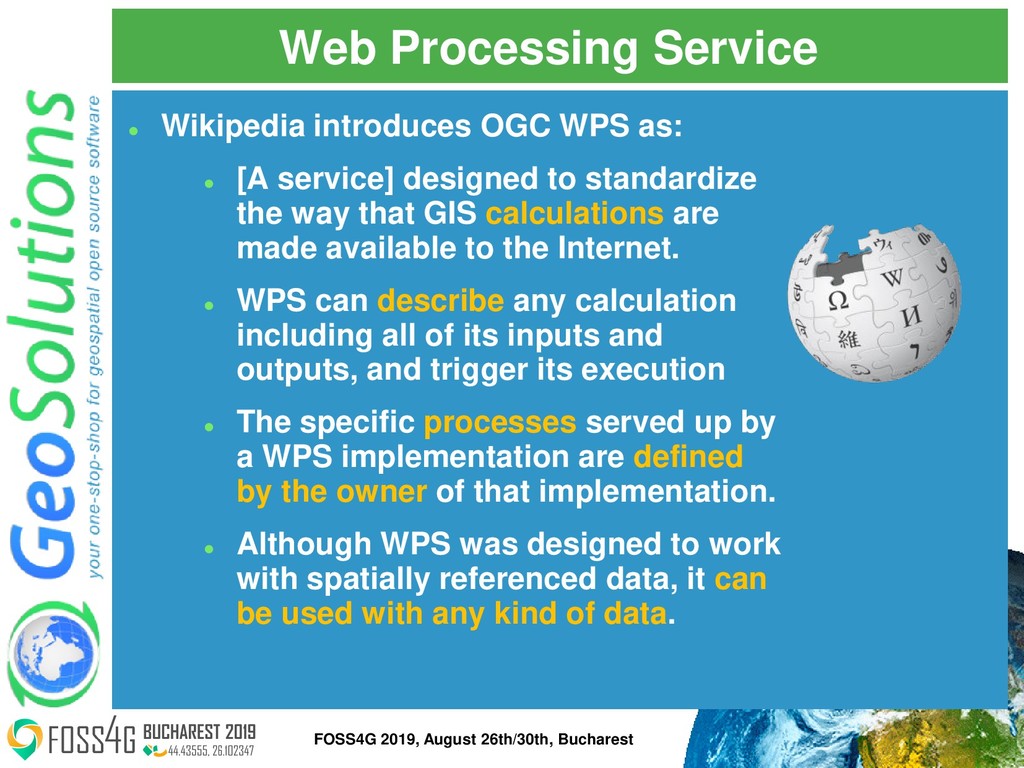
[A service] designed to standardize the way that GIS calculations are made available to the Internet. ⚫ WPS can describe any calculation including all of its inputs and outputs, and trigger its execution ⚫ The specific processes served up by a WPS implementation are defined by the owner of that implementation. ⚫ Although WPS was designed to work with spatially referenced data, it can be used with any kind of data. FOSS4G 2019, August 26th/30th, Bucharest
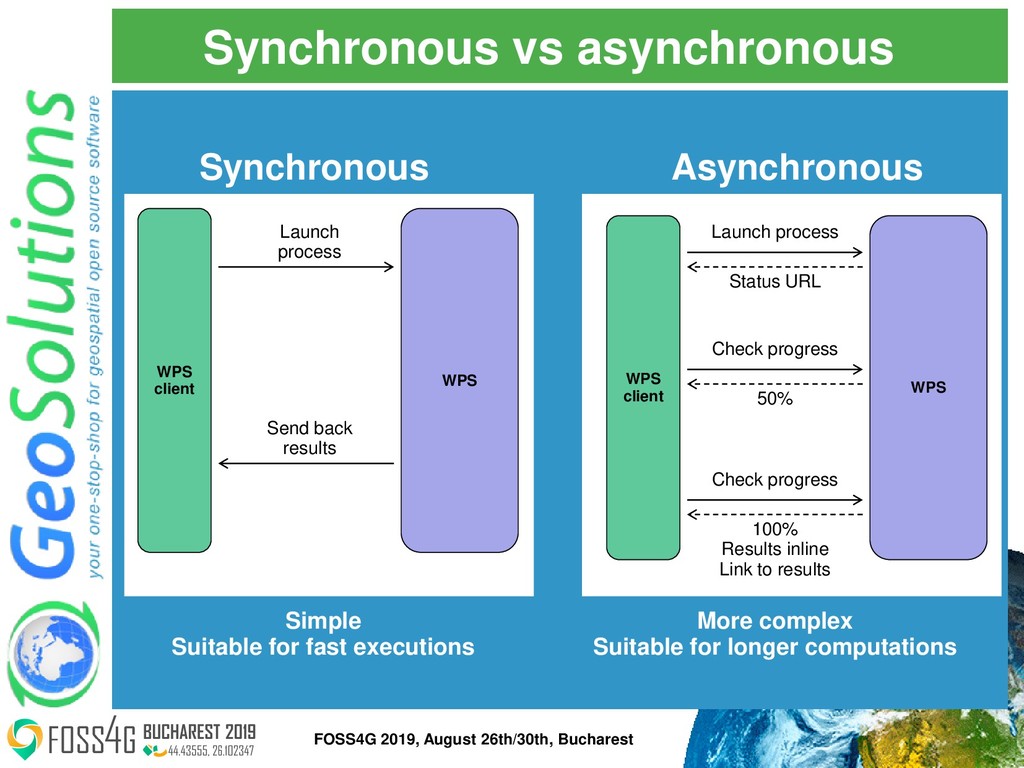
results Simple Suitable for fast executions Synchronous WPS client WPS Launch process Status URL Check progress 50% Check progress 100% Results inline Link to results More complex Suitable for longer computations Asynchronous FOSS4G 2019, August 26th/30th, Bucharest
BDMS: • Designed to efficiently handle large quantities of data • Efficient spatial primitives (at least, in PostGIS) • Doesn’t get more local to your data than this! • Passing params down? • Parametric SQL views! FOSS4G 2019, August 26th/30th, Bucharest
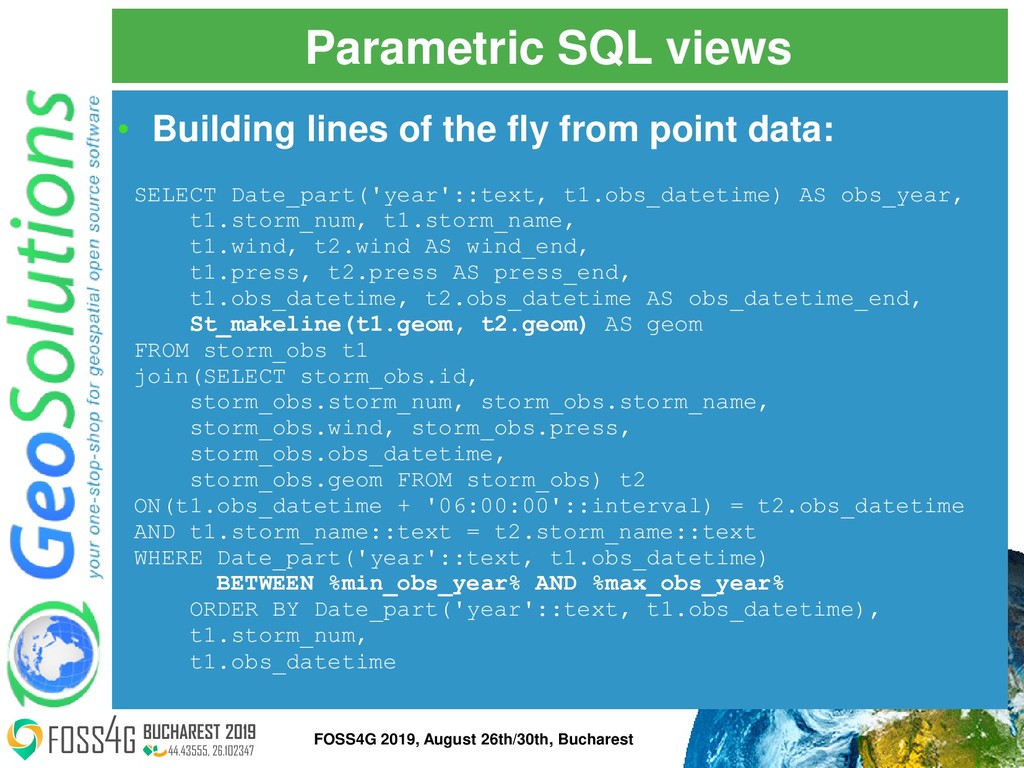
t1.wind, t2.wind AS wind_end, t1.press, t2.press AS press_end, t1.obs_datetime, t2.obs_datetime AS obs_datetime_end, St_makeline(t1.geom, t2.geom) AS geom FROM storm_obs t1 join(SELECT storm_obs.id, storm_obs.storm_num, storm_obs.storm_name, storm_obs.wind, storm_obs.press, storm_obs.obs_datetime, storm_obs.geom FROM storm_obs) t2 ON(t1.obs_datetime + '06:00:00'::interval) = t2.obs_datetime AND t1.storm_name::text = t2.storm_name::text WHERE Date_part('year'::text, t1.obs_datetime) BETWEEN %min_obs_year% AND %max_obs_year% ORDER BY Date_part('year'::text, t1.obs_datetime), t1.storm_num, t1.obs_datetime • Building lines of the fly from point data: FOSS4G 2019, August 26th/30th, Bucharest
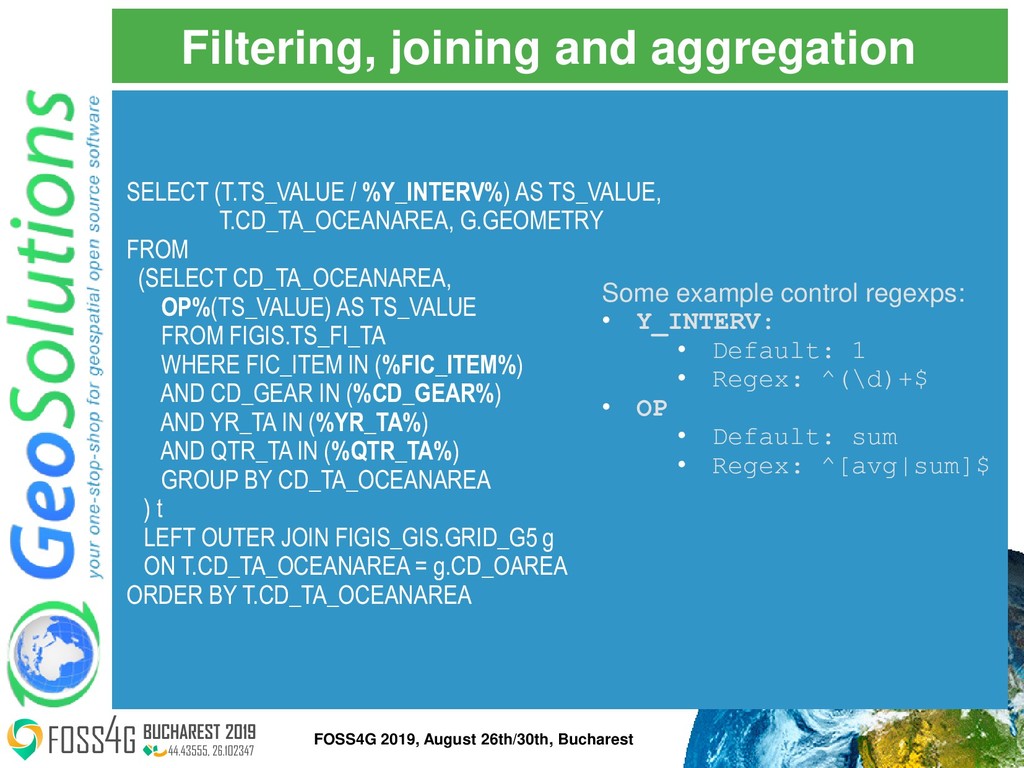
• Default: 1 • Regex: ^(\d)+$ • OP • Default: sum • Regex: ^[avg|sum]$ SELECT (T.TS_VALUE / %Y_INTERV%) AS TS_VALUE, T.CD_TA_OCEANAREA, G.GEOMETRY FROM (SELECT CD_TA_OCEANAREA, OP%(TS_VALUE) AS TS_VALUE FROM FIGIS.TS_FI_TA WHERE FIC_ITEM IN (%FIC_ITEM%) AND CD_GEAR IN (%CD_GEAR%) AND YR_TA IN (%YR_TA%) AND QTR_TA IN (%QTR_TA%) GROUP BY CD_TA_OCEANAREA ) t LEFT OUTER JOIN FIGIS_GIS.GRID_G5 g ON T.CD_TA_OCEANAREA = g.CD_OAREA ORDER BY T.CD_TA_OCEANAREA FOSS4G 2019, August 26th/30th, Bucharest
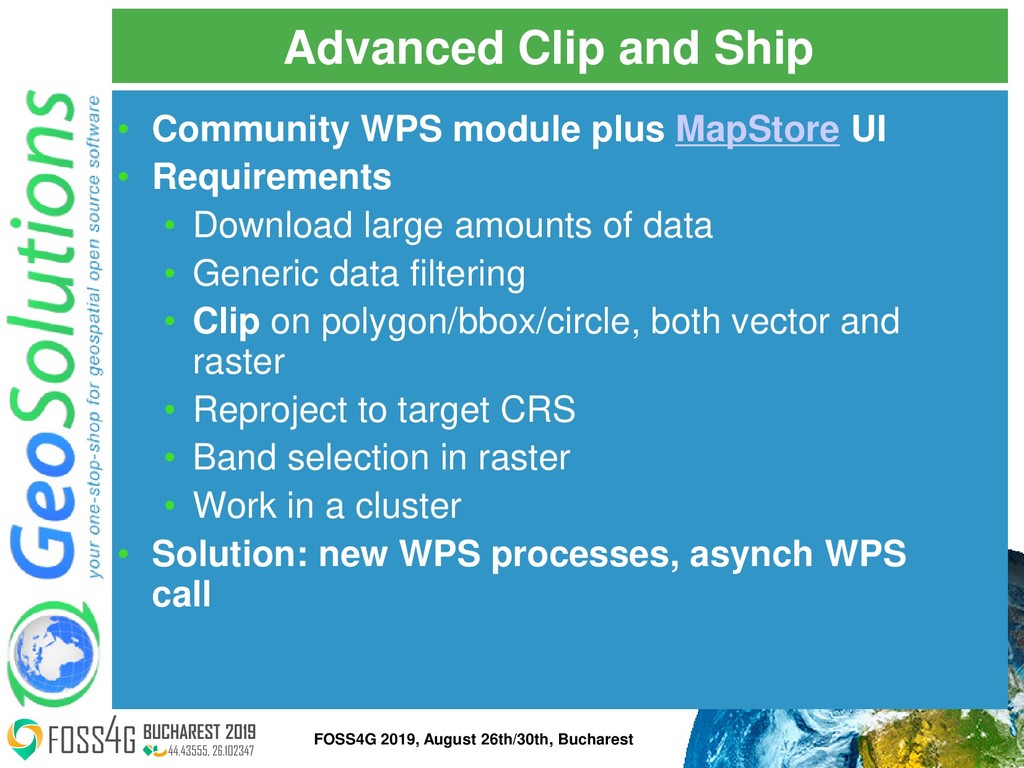
UI • Requirements • Download large amounts of data • Generic data filtering • Clip on polygon/bbox/circle, both vector and raster • Reproject to target CRS • Band selection in raster • Work in a cluster • Solution: new WPS processes, asynch WPS call FOSS4G 2019, August 26th/30th, Bucharest
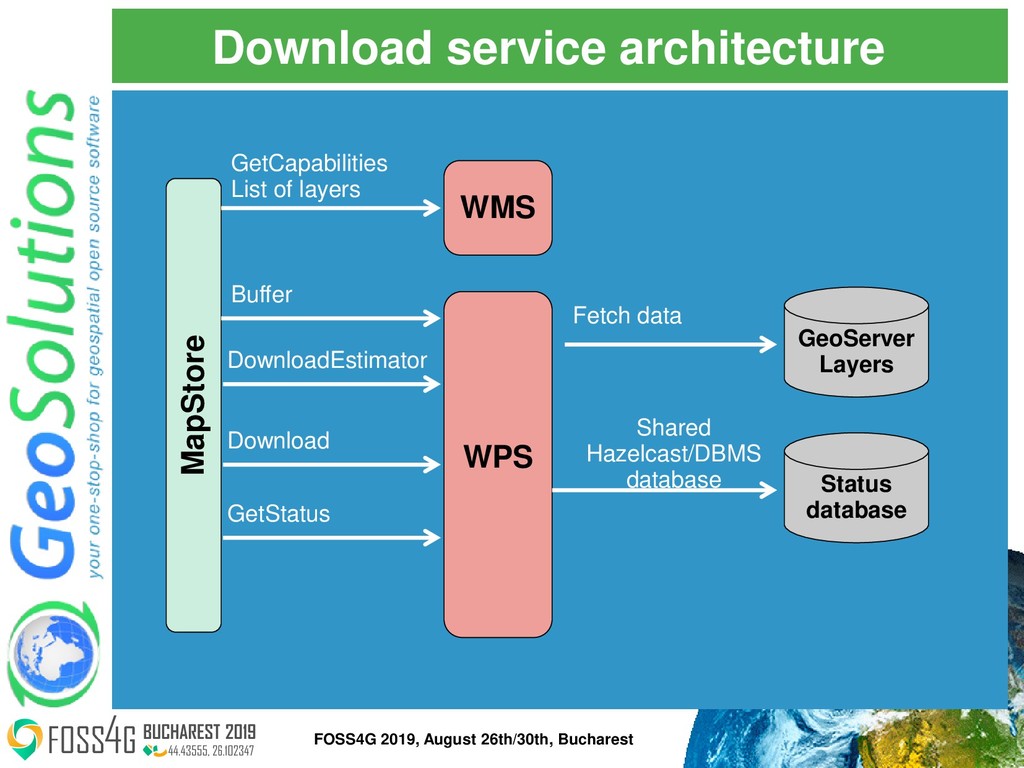
of layers Buffer DownloadEstimator Download GetStatus Fetch data Status database Shared Hazelcast/DBMS database FOSS4G 2019, August 26th/30th, Bucharest
data to show synthetic information from map layers • Widgets are floating on the map • Automatically filtered on current map view FOSS4G 2019, August 26th/30th, Bucharest
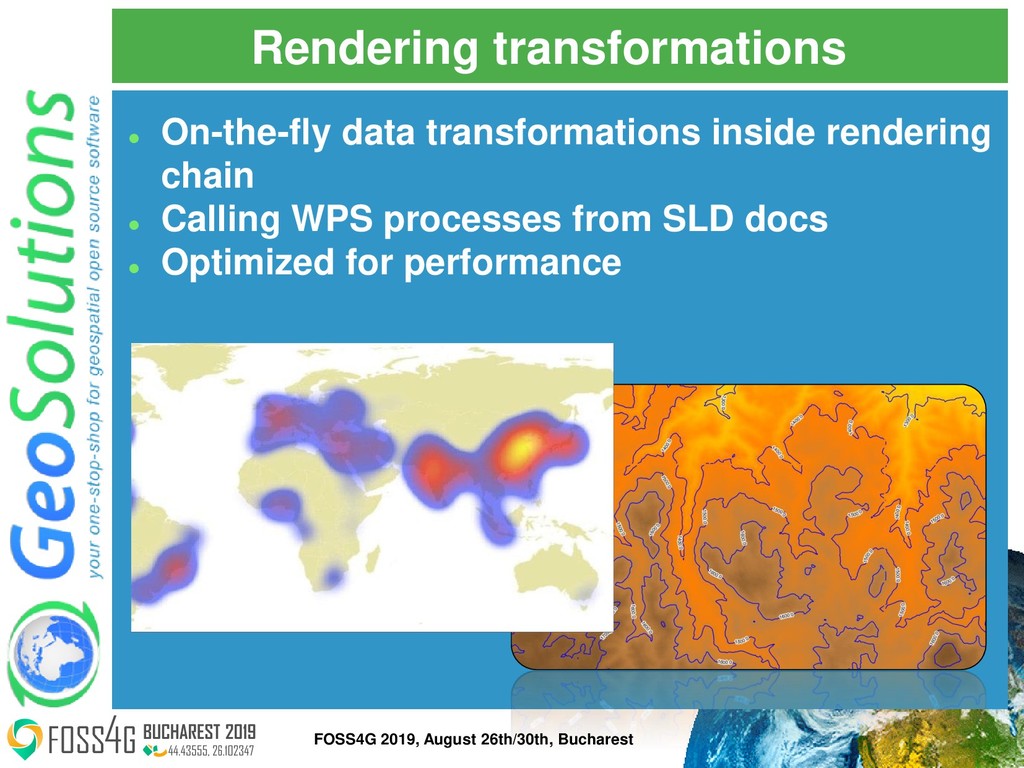
ation_index • Done using Jiffle, allows to run map algebra on the bands of an input raster layer using the Jiffle language. • Called from SLD via «rendering transformation» • GeoServer rendering pipeline will be smart enough to only read the bands it needs ! FOSS4G 2019, August 26th/30th, Bucharest
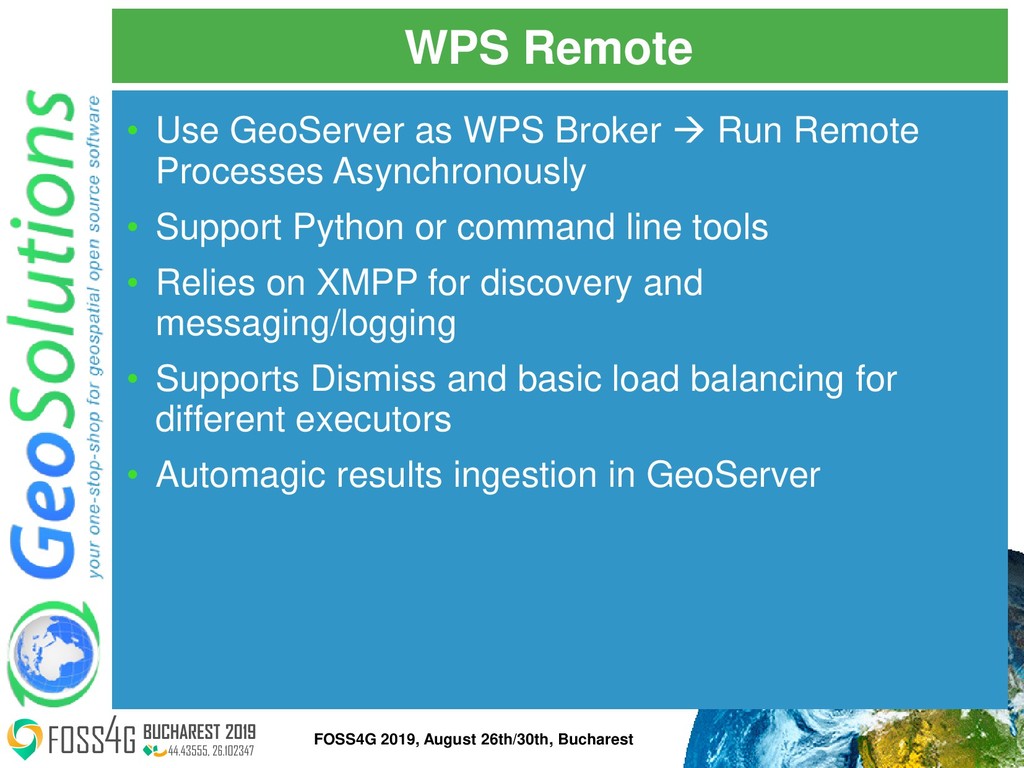
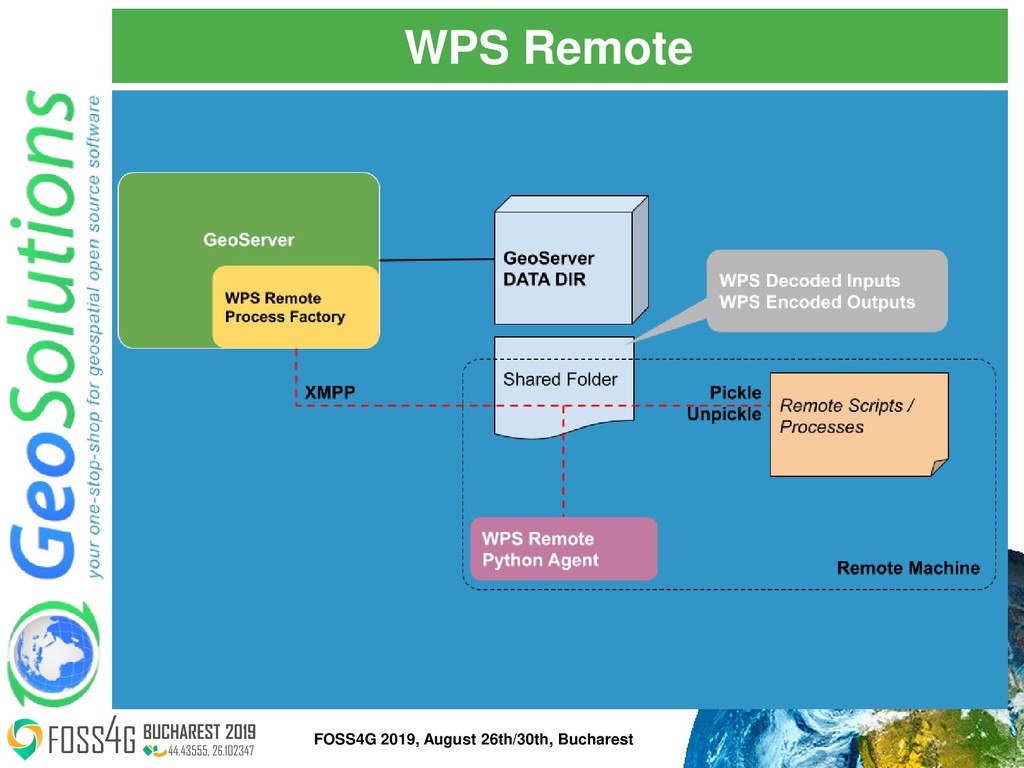
Remote Processes Asynchronously • Support Python or command line tools • Relies on XMPP for discovery and messaging/logging • Supports Dismiss and basic load balancing for different executors • Automagic results ingestion in GeoServer FOSS4G 2019, August 26th/30th, Bucharest
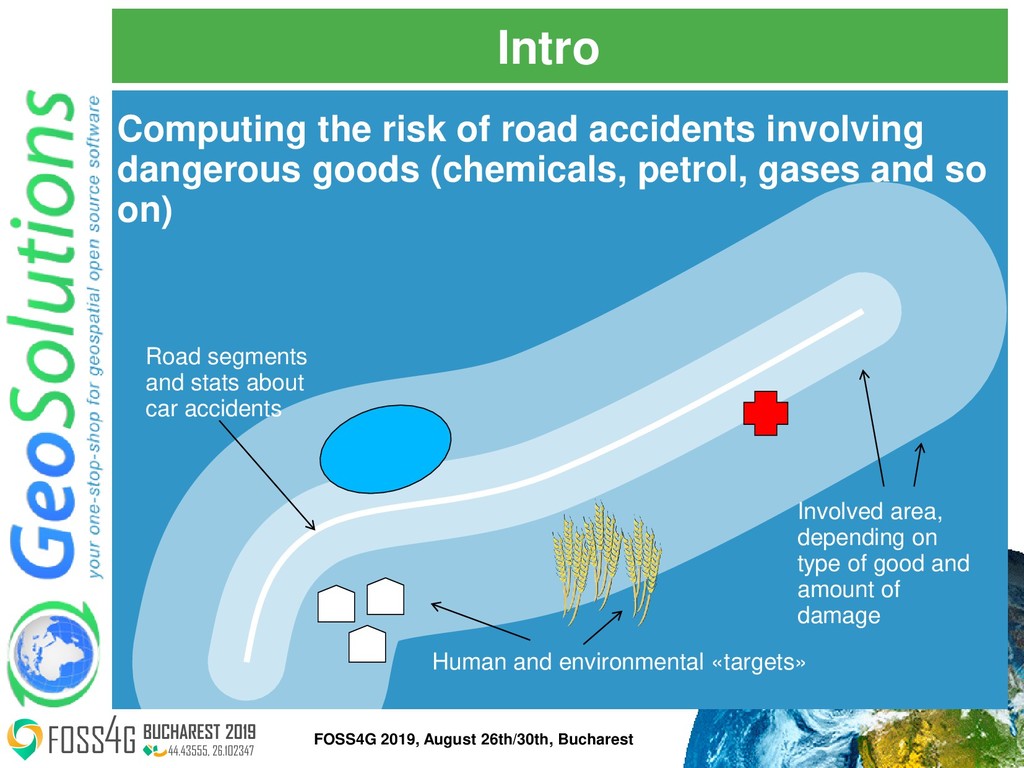
(chemicals, petrol, gases and so on) Road segments and stats about car accidents Human and environmental «targets» Involved area, depending on type of good and amount of damage FOSS4G 2019, August 26th/30th, Bucharest
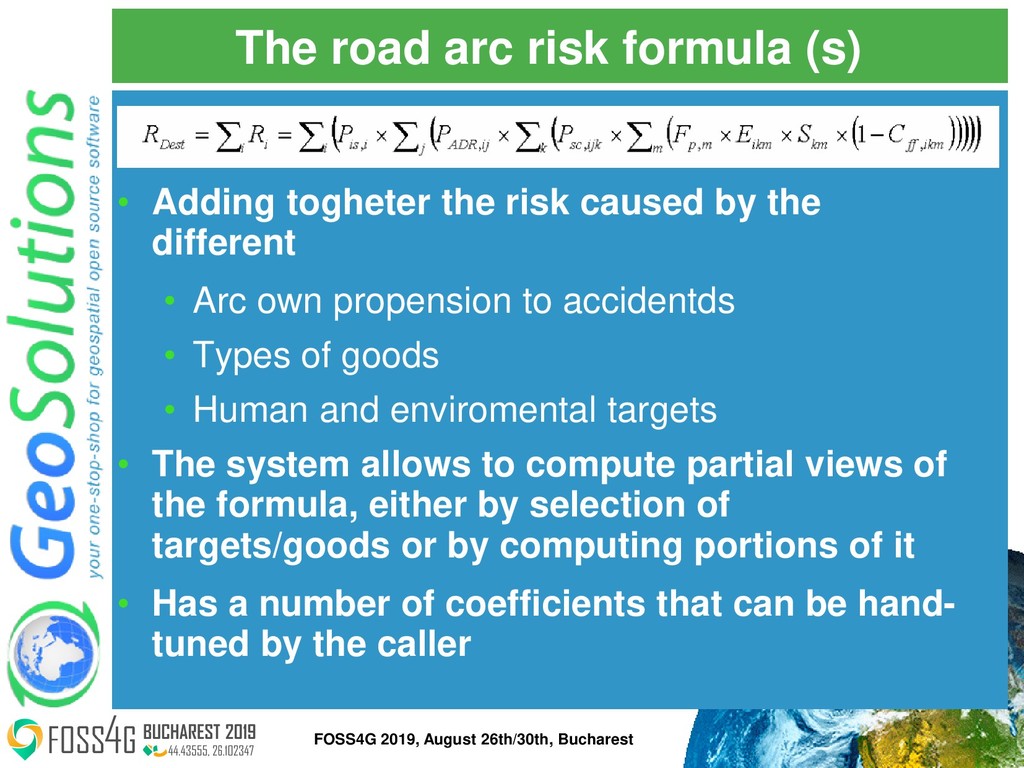
risk caused by the different • Arc own propension to accidentds • Types of goods • Human and enviromental targets • The system allows to compute partial views of the formula, either by selection of targets/goods or by computing portions of it • Has a number of coefficients that can be hand- tuned by the caller FOSS4G 2019, August 26th/30th, Bucharest
the possible aggregations variants are too many • Using a pure Java process? No, too much data to transfer from the DBMS • Fully on the fly? No, too much data involved • ➔ Pre-compute all buffers and locate all involved targets before hand (pre-cooked per buffer risk) • ➔ Use a process that builds a final aggregation query on the fly (dynamic sql views) FOSS4G 2019, August 26th/30th, Bucharest
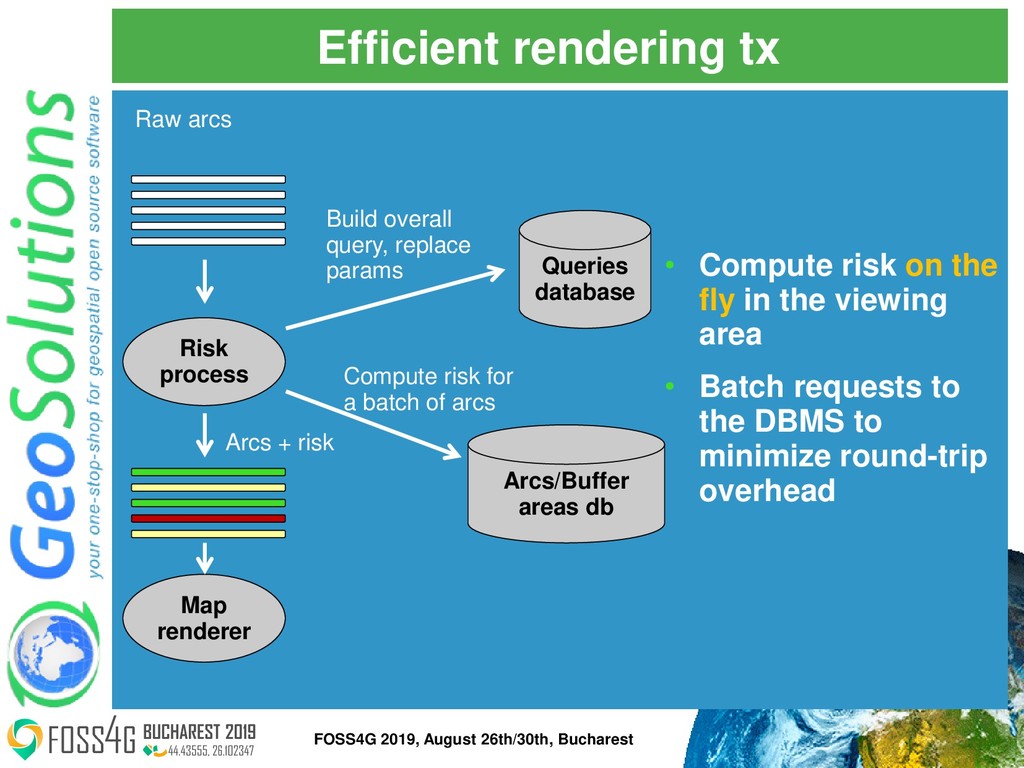
Map renderer Build overall query, replace params Compute risk for a batch of arcs Raw arcs Arcs + risk • Compute risk on the fly in the viewing area • Batch requests to the DBMS to minimize round-trip overhead FOSS4G 2019, August 26th/30th, Bucharest
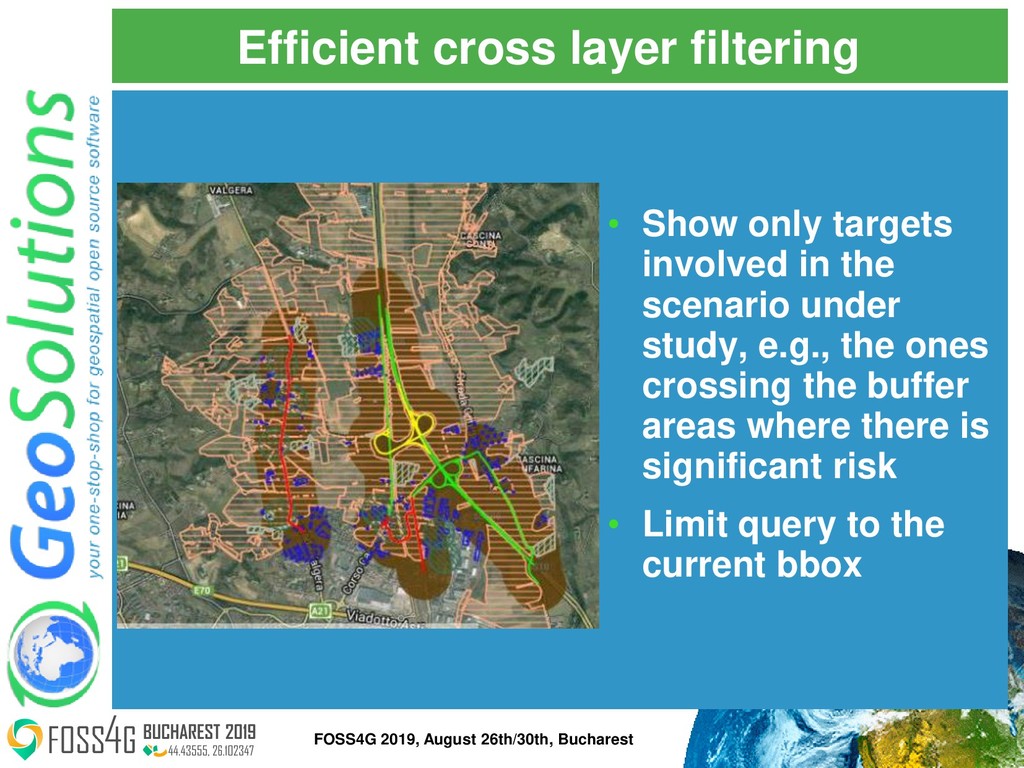
the scenario under study, e.g., the ones crossing the buffer areas where there is significant risk • Limit query to the current bbox FOSS4G 2019, August 26th/30th, Bucharest
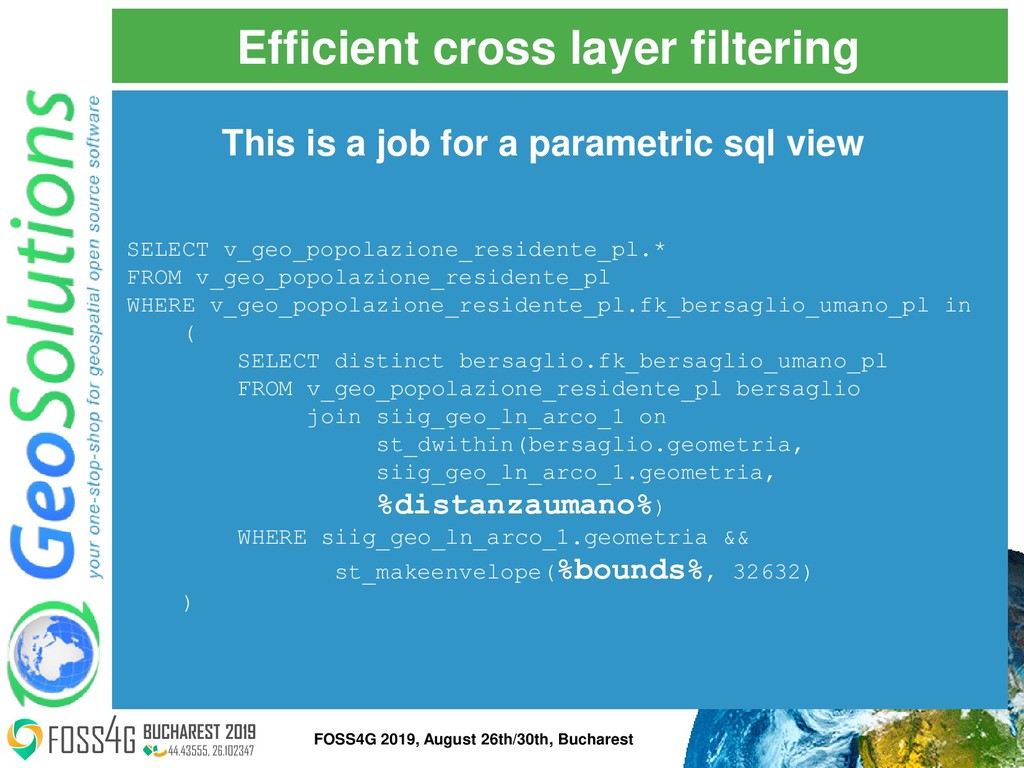
in ( SELECT distinct bersaglio.fk_bersaglio_umano_pl FROM v_geo_popolazione_residente_pl bersaglio join siig_geo_ln_arco_1 on st_dwithin(bersaglio.geometria, siig_geo_ln_arco_1.geometria, %distanzaumano%) WHERE siig_geo_ln_arco_1.geometria && st_makeenvelope(%bounds%, 32632) ) This is a job for a parametric sql view FOSS4G 2019, August 26th/30th, Bucharest
![The End Questions? [email protected] [email protected] [email protected] FOSS4G 2019, August 26th/30th,](https://files.speakerdeck.com/presentations/5e99e2ee8dd843859530b0956ac6869c/slide_46.jpg)