Upgrade to Pro — share decks privately, control downloads, hide ads and more …

Marketplace Analytics: Customer Segmentation, M...

Marketplace Analytics: Customer Segmentation, Market Basket Analysis, and Inventory Forecasting

A consulting-style analytics case study demonstrating how marketplace transaction data can be transformed into actionable business insights. This project applies Market Basket Analysis, RFM customer segmentation, and demand forecasting to identify cross-selling opportunities, improve customer retention, and optimize inventory planning. Built using Python, Pandas, Plotly, and Jupyter Notebook.

Avatar for Sonetto Eruditio

Sonetto Eruditio

June 25, 2026

Other Decks in Business

Transcript

  1. Marketplace Analytics Unlock revenue growth, stronger retention, and smarter inventory

    decisions Turn marketplace data into clearer business decisions that improve performance and profitability.
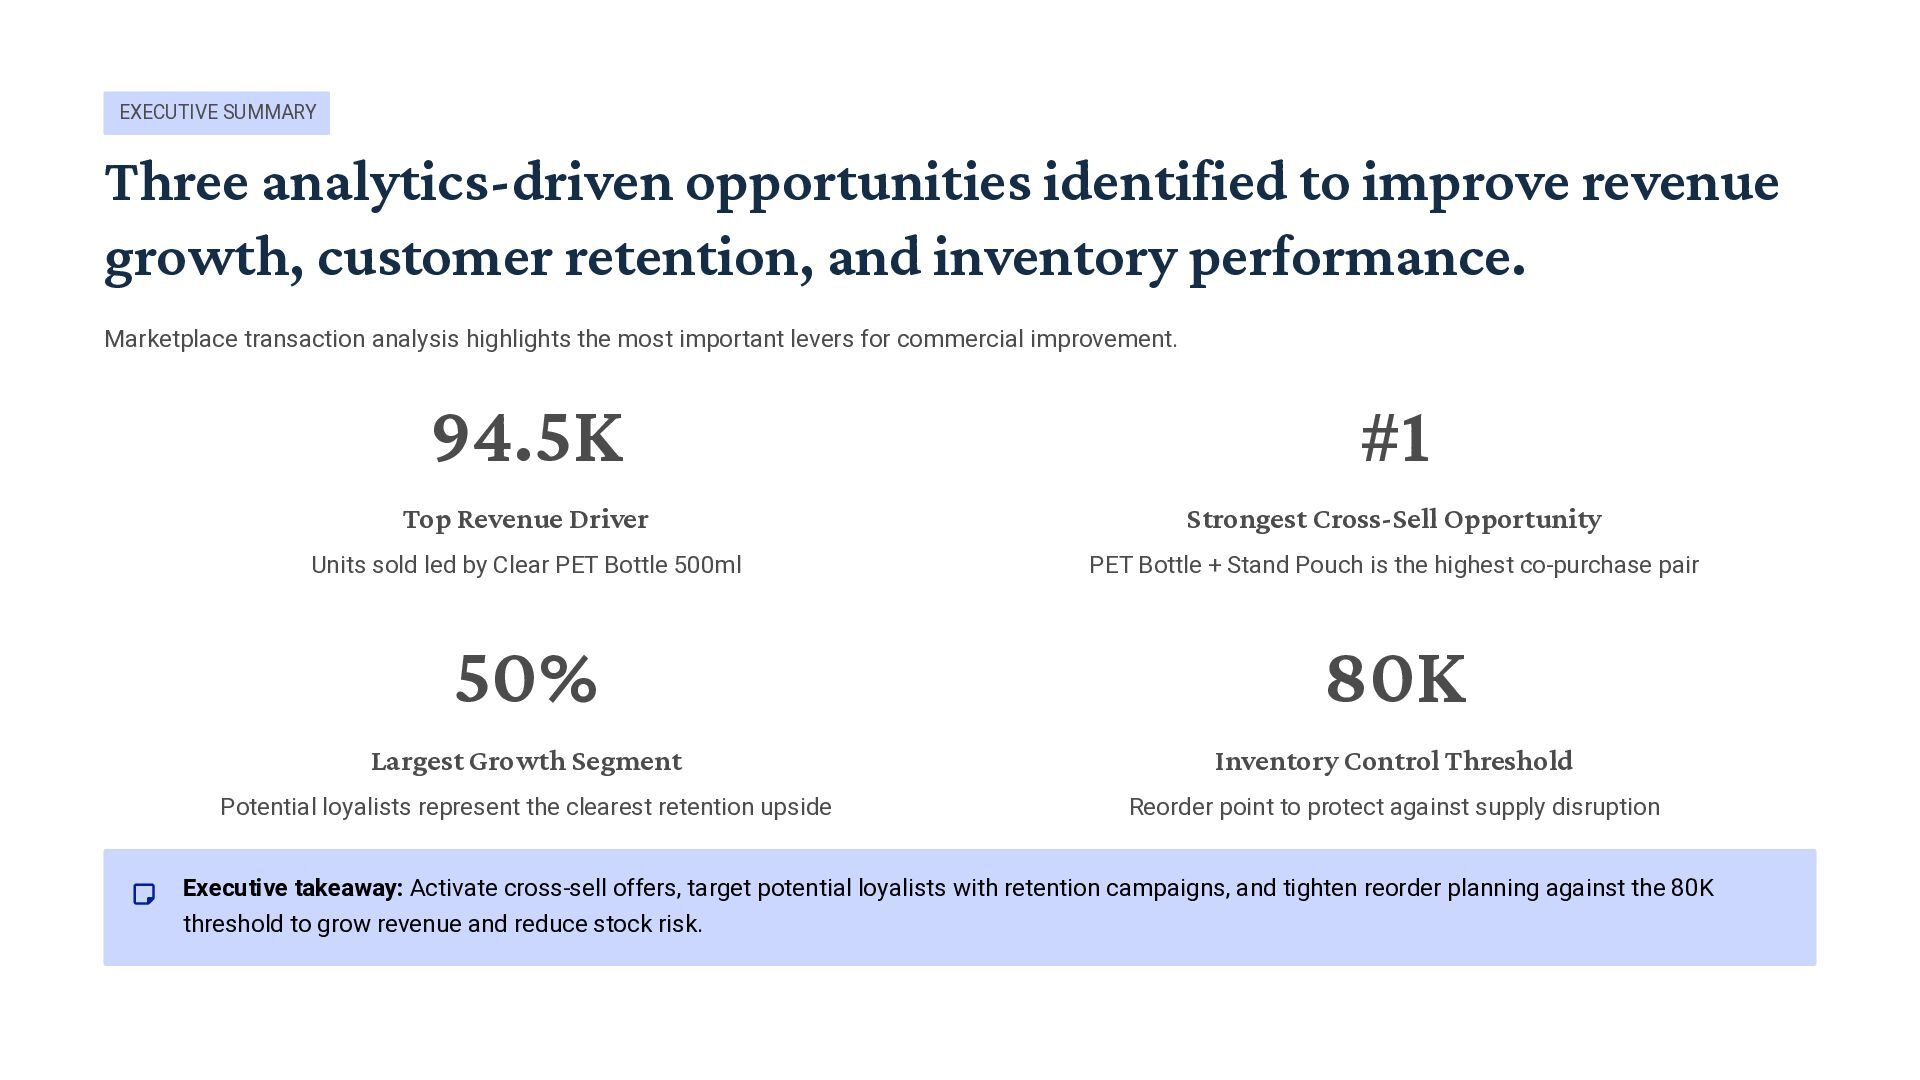
  2. EXECUTIVE SUMMARY Three analytics-driven opportunities identified to improve revenue growth,

    customer retention, and inventory performance. Marketplace transaction analysis highlights the most important levers for commercial improvement. 94.5K Top Revenue Driver Units sold led by Clear PET Bottle 500ml #1 Strongest Cross-Sell Opportunity PET Bottle + Stand Pouch is the highest co-purchase pair 50% Largest Growth Segment Potential loyalists represent the clearest retention upside 80K Inventory Control Threshold Reorder point to protect against supply disruption Executive takeaway: Activate cross-sell offers, target potential loyalists with retention campaigns, and tighten reorder planning against the 80K threshold to grow revenue and reduce stock risk.
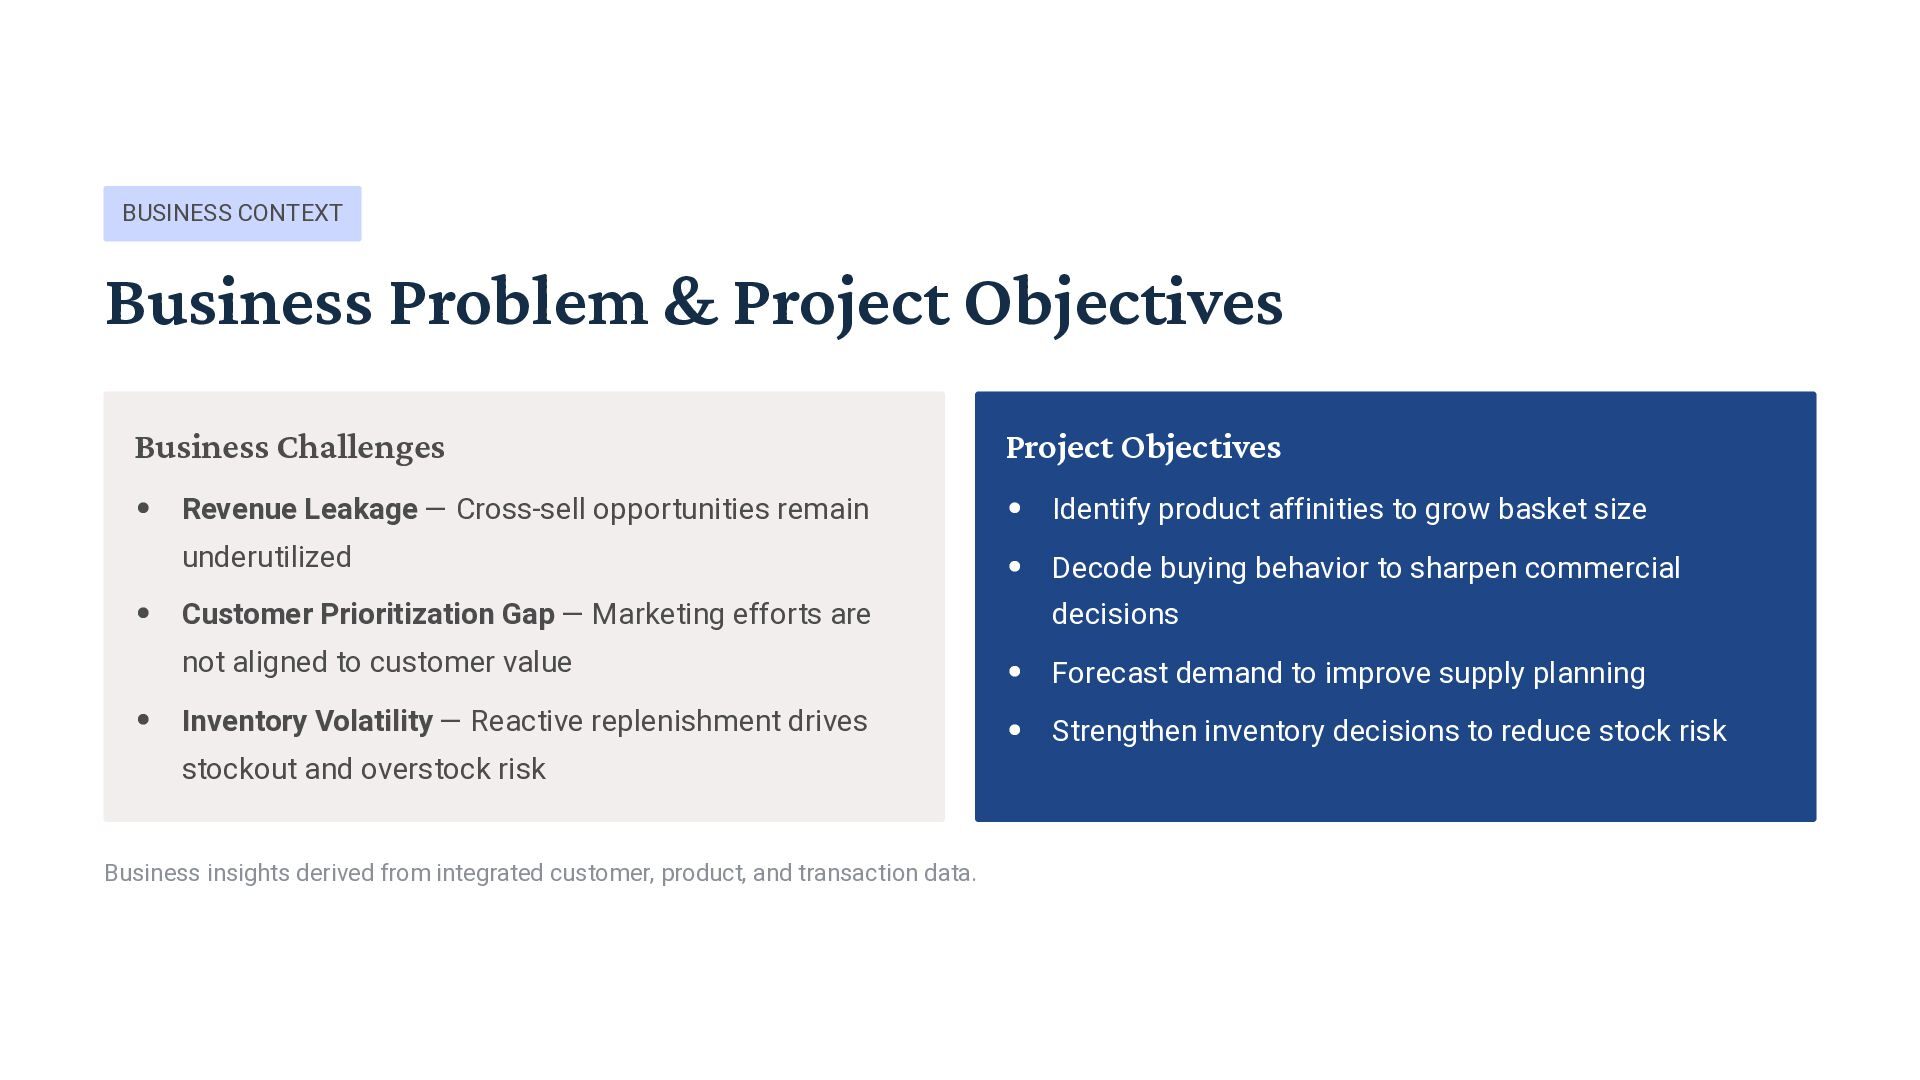
  3. BUSINESS CONTEXT Business Problem & Project Objectives Business Challenges Revenue

    Leakage — Cross-sell opportunities remain underutilized Customer Prioritization Gap — Marketing efforts are not aligned to customer value Inventory Volatility — Reactive replenishment drives stockout and overstock risk Project Objectives Identify product affinities to grow basket size Decode buying behavior to sharpen commercial decisions Forecast demand to improve supply planning Strengthen inventory decisions to reduce stock risk Business insights derived from integrated customer, product, and transaction data.
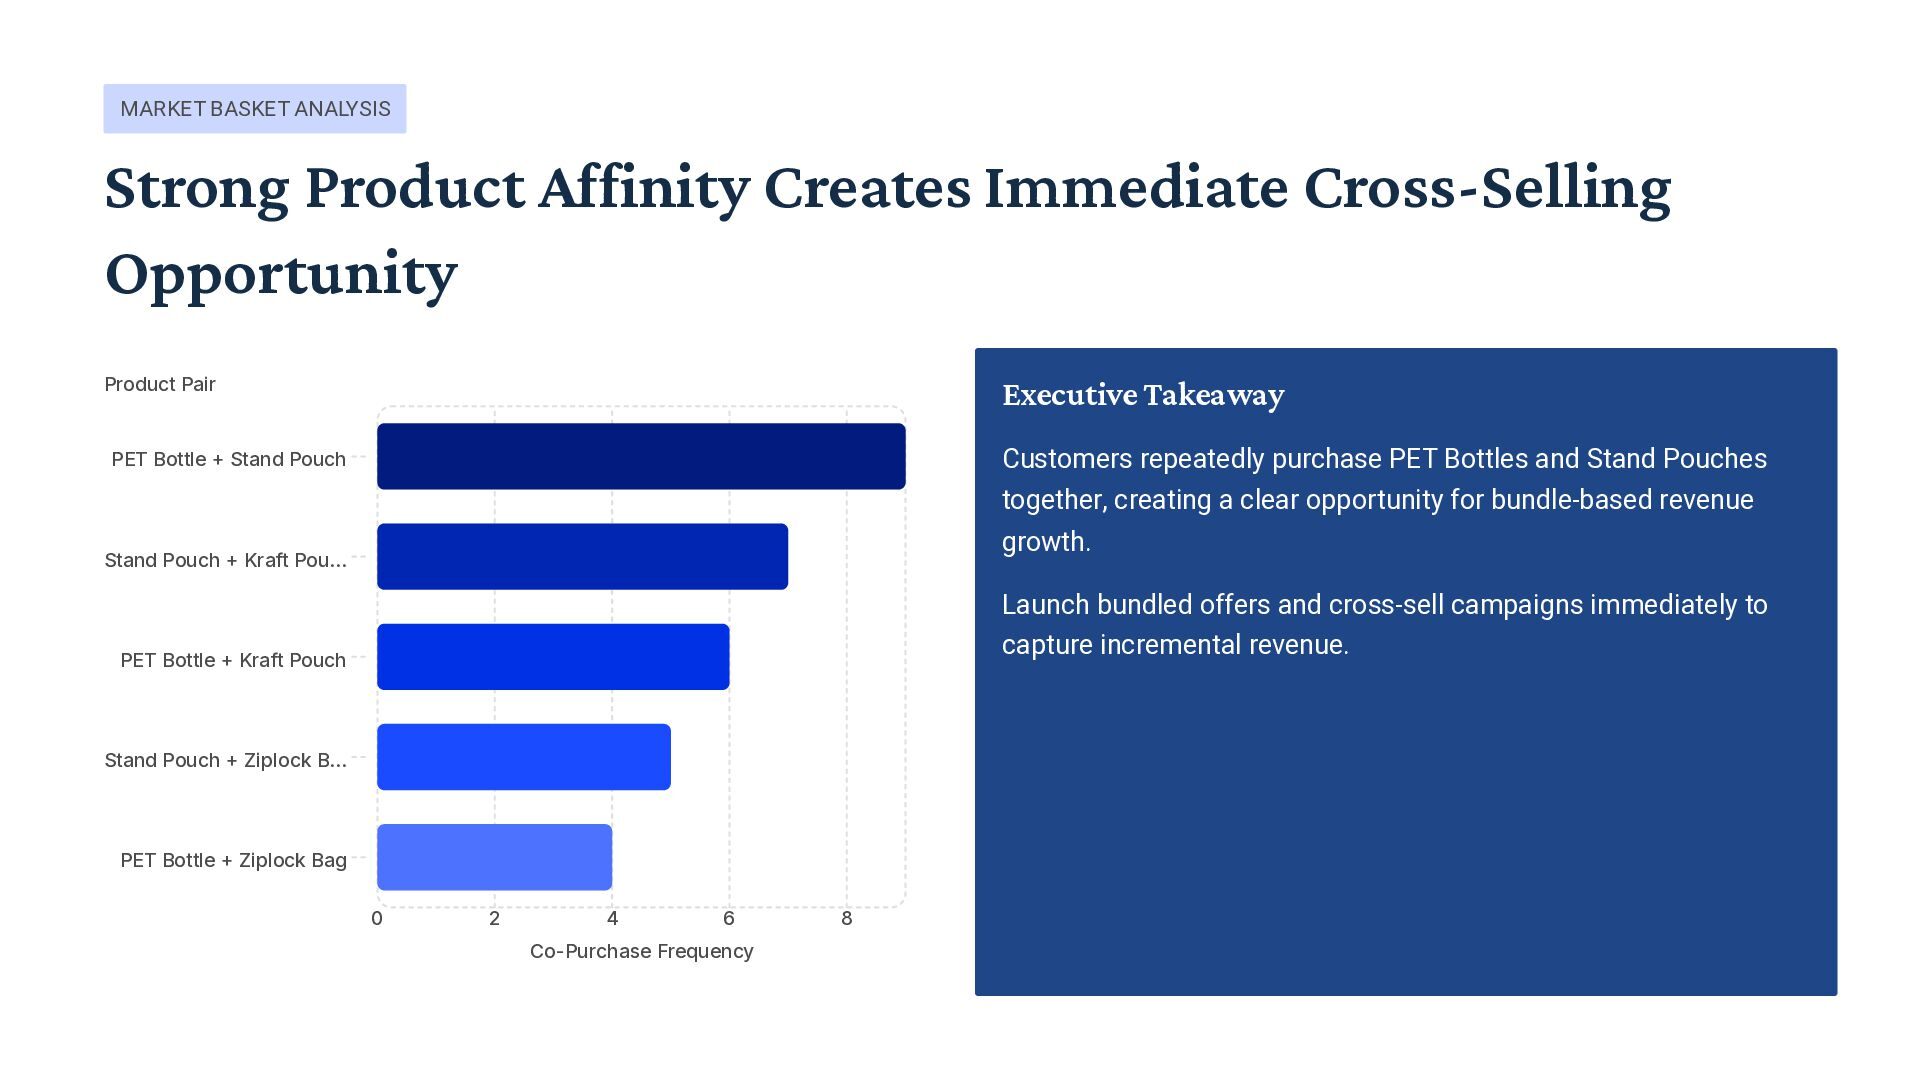
  4. MARKET BASKET ANALYSIS Strong Product Affinity Creates Immediate Cross-Selling Opportunity

    0 2 4 6 8 Co-Purchase Frequency PET Bottle + Stand Pouch Stand Pouch + Kraft Pou… PET Bottle + Kraft Pouch Stand Pouch + Ziplock B… PET Bottle + Ziplock Bag Product Pair Executive Takeaway Customers repeatedly purchase PET Bottles and Stand Pouches together, creating a clear opportunity for bundle-based revenue growth. Launch bundled offers and cross-sell campaigns immediately to capture incremental revenue.
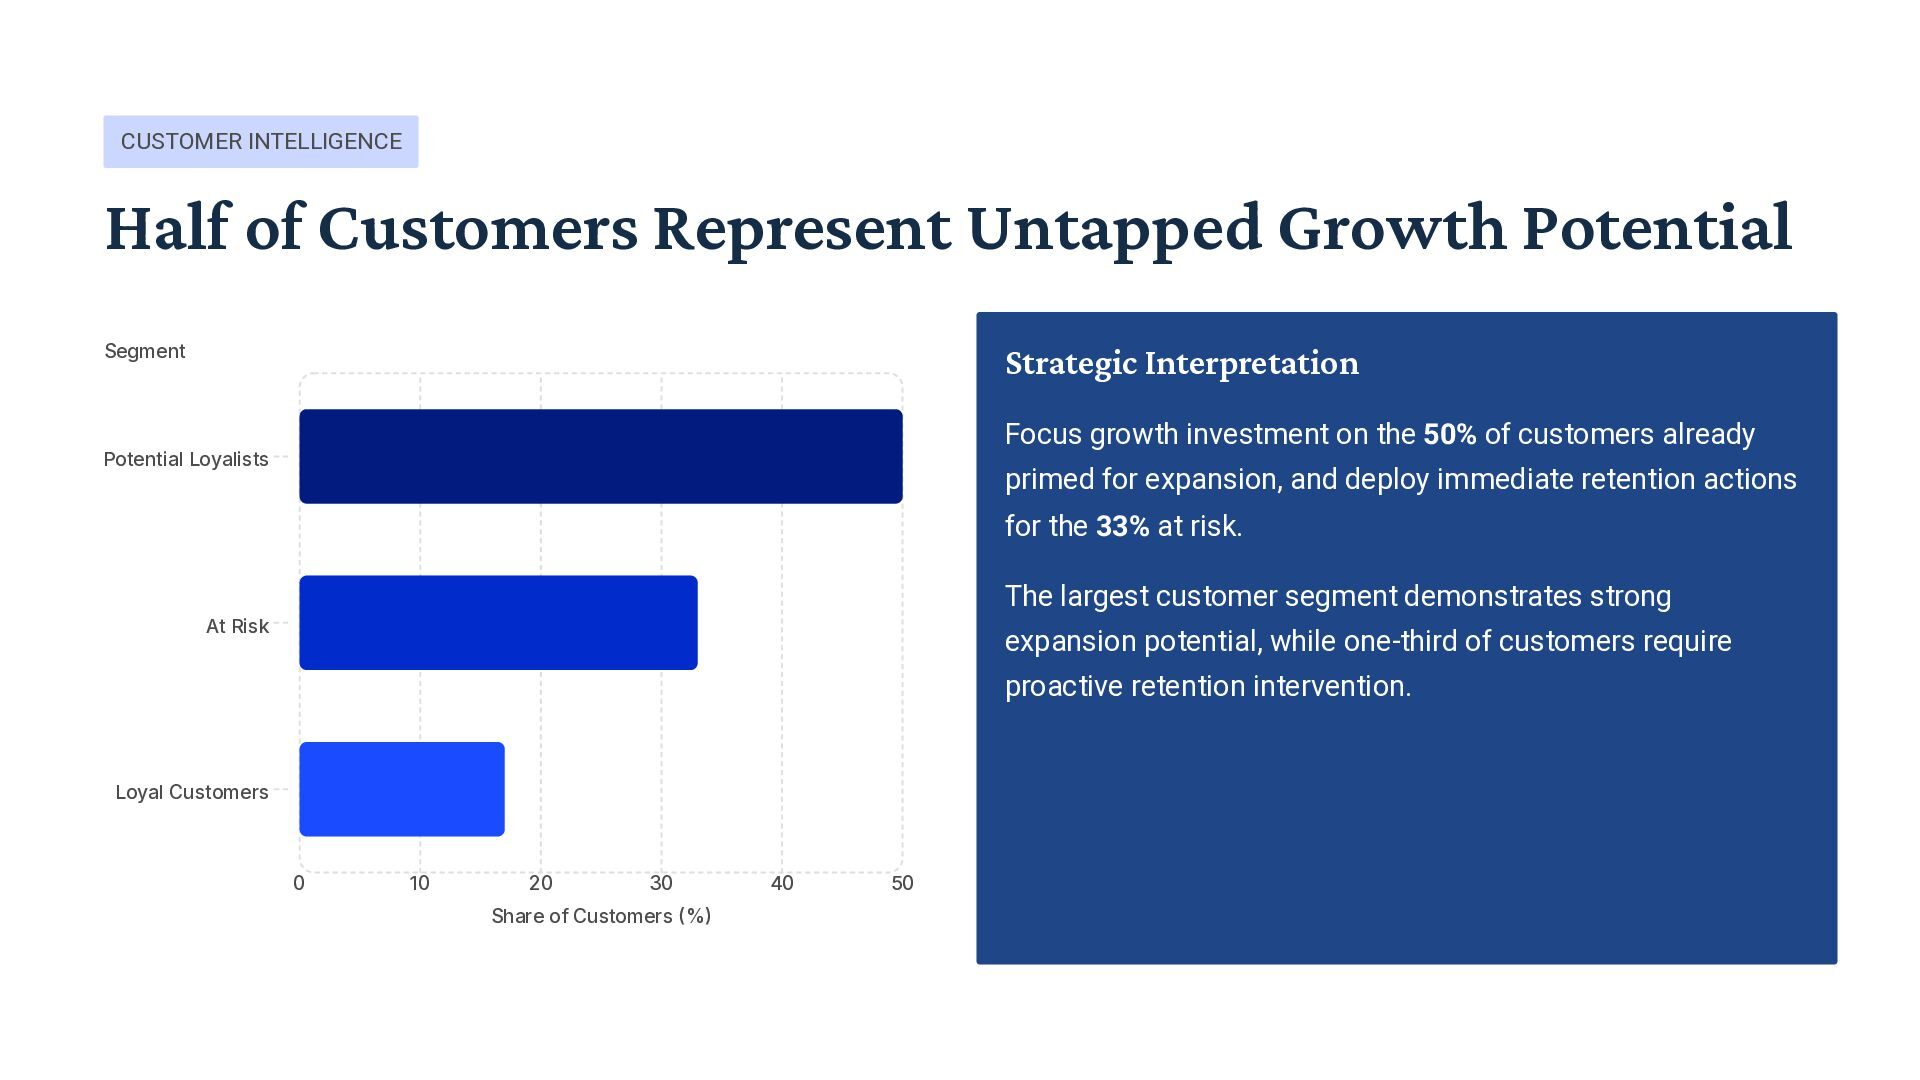
  5. CUSTOMER INTELLIGENCE Half of Customers Represent Untapped Growth Potential 0

    10 20 30 40 50 Share of Customers (%) Potential Loyalists At Risk Loyal Customers Segment Strategic Interpretation Focus growth investment on the 50% of customers already primed for expansion, and deploy immediate retention actions for the 33% at risk. The largest customer segment demonstrates strong expansion potential, while one-third of customers require proactive retention intervention.
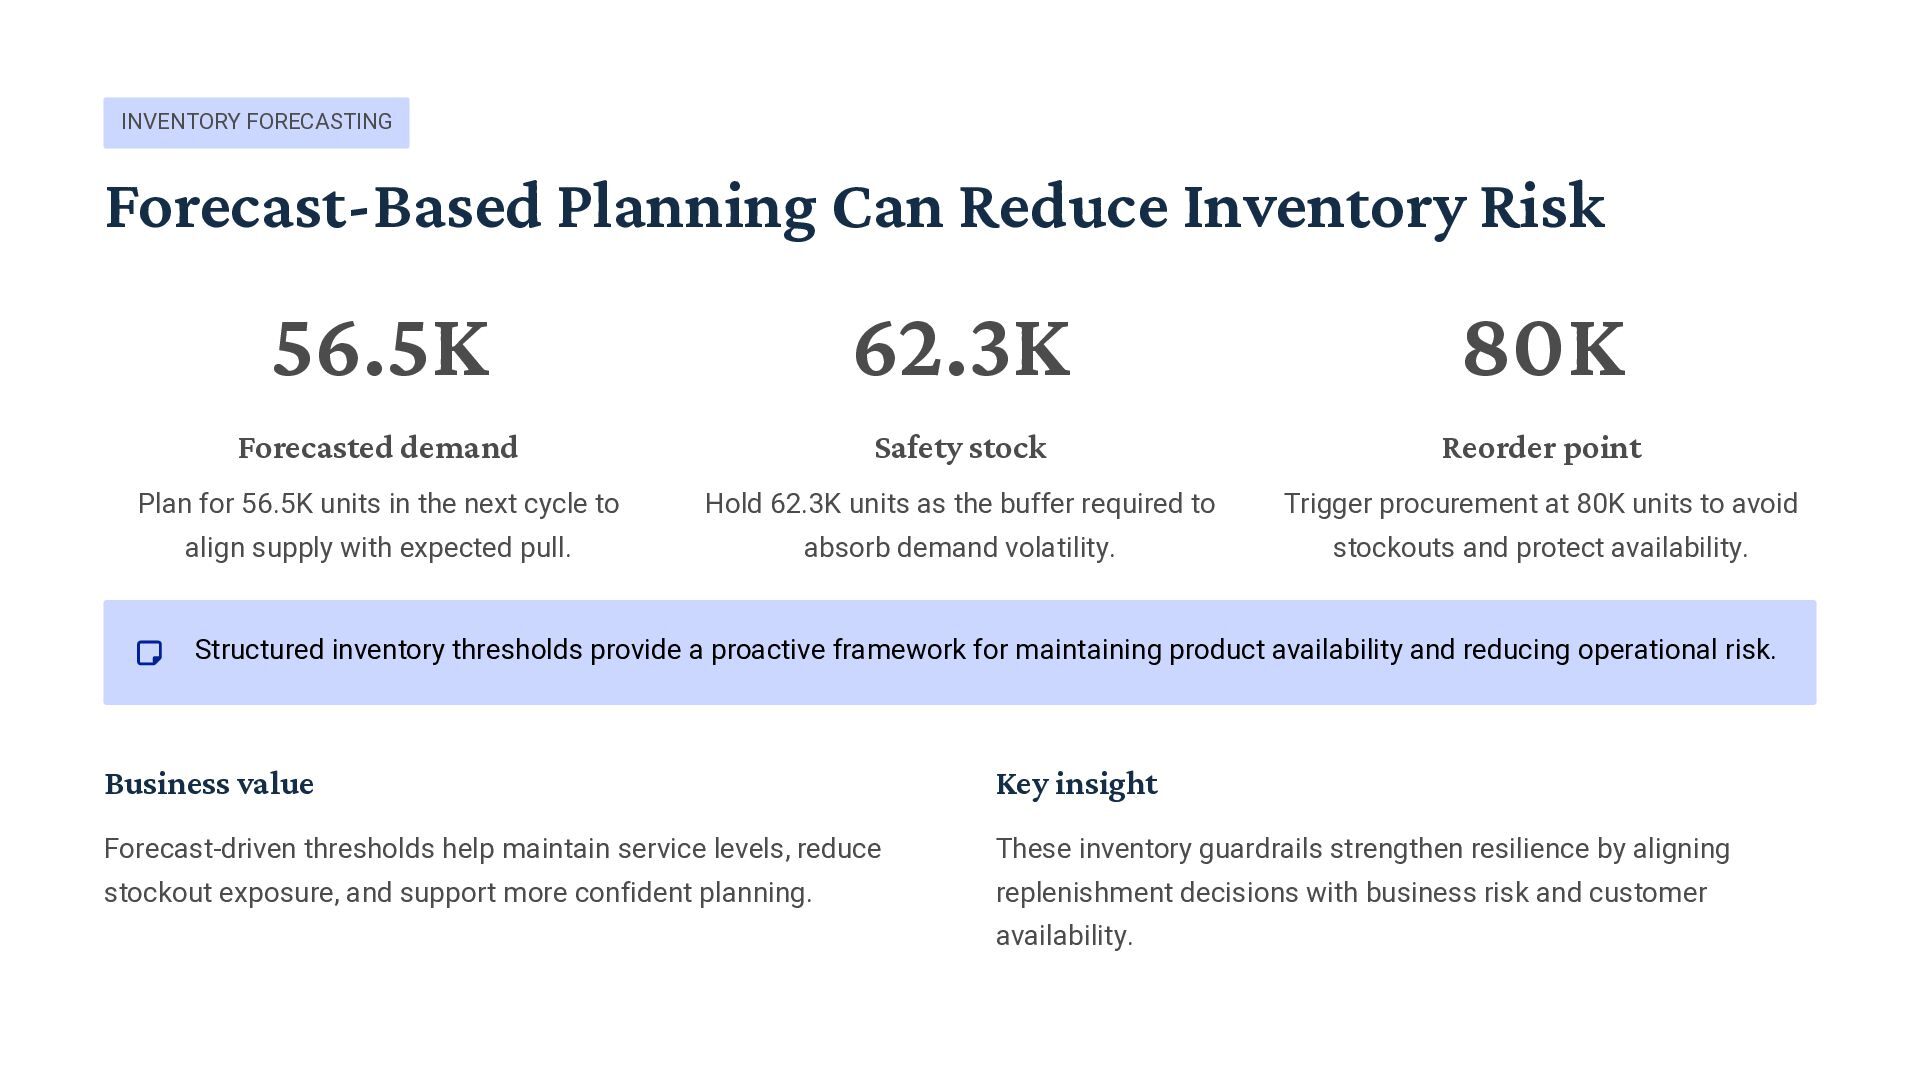
  6. INVENTORY FORECASTING Forecast-Based Planning Can Reduce Inventory Risk 56.5K Forecasted

    demand Plan for 56.5K units in the next cycle to align supply with expected pull. 62.3K Safety stock Hold 62.3K units as the buffer required to absorb demand volatility. 80K Reorder point Trigger procurement at 80K units to avoid stockouts and protect availability. Structured inventory thresholds provide a proactive framework for maintaining product availability and reducing operational risk. Business value Forecast-driven thresholds help maintain service levels, reduce stockout exposure, and support more confident planning. Key insight These inventory guardrails strengthen resilience by aligning replenishment decisions with business risk and customer availability.
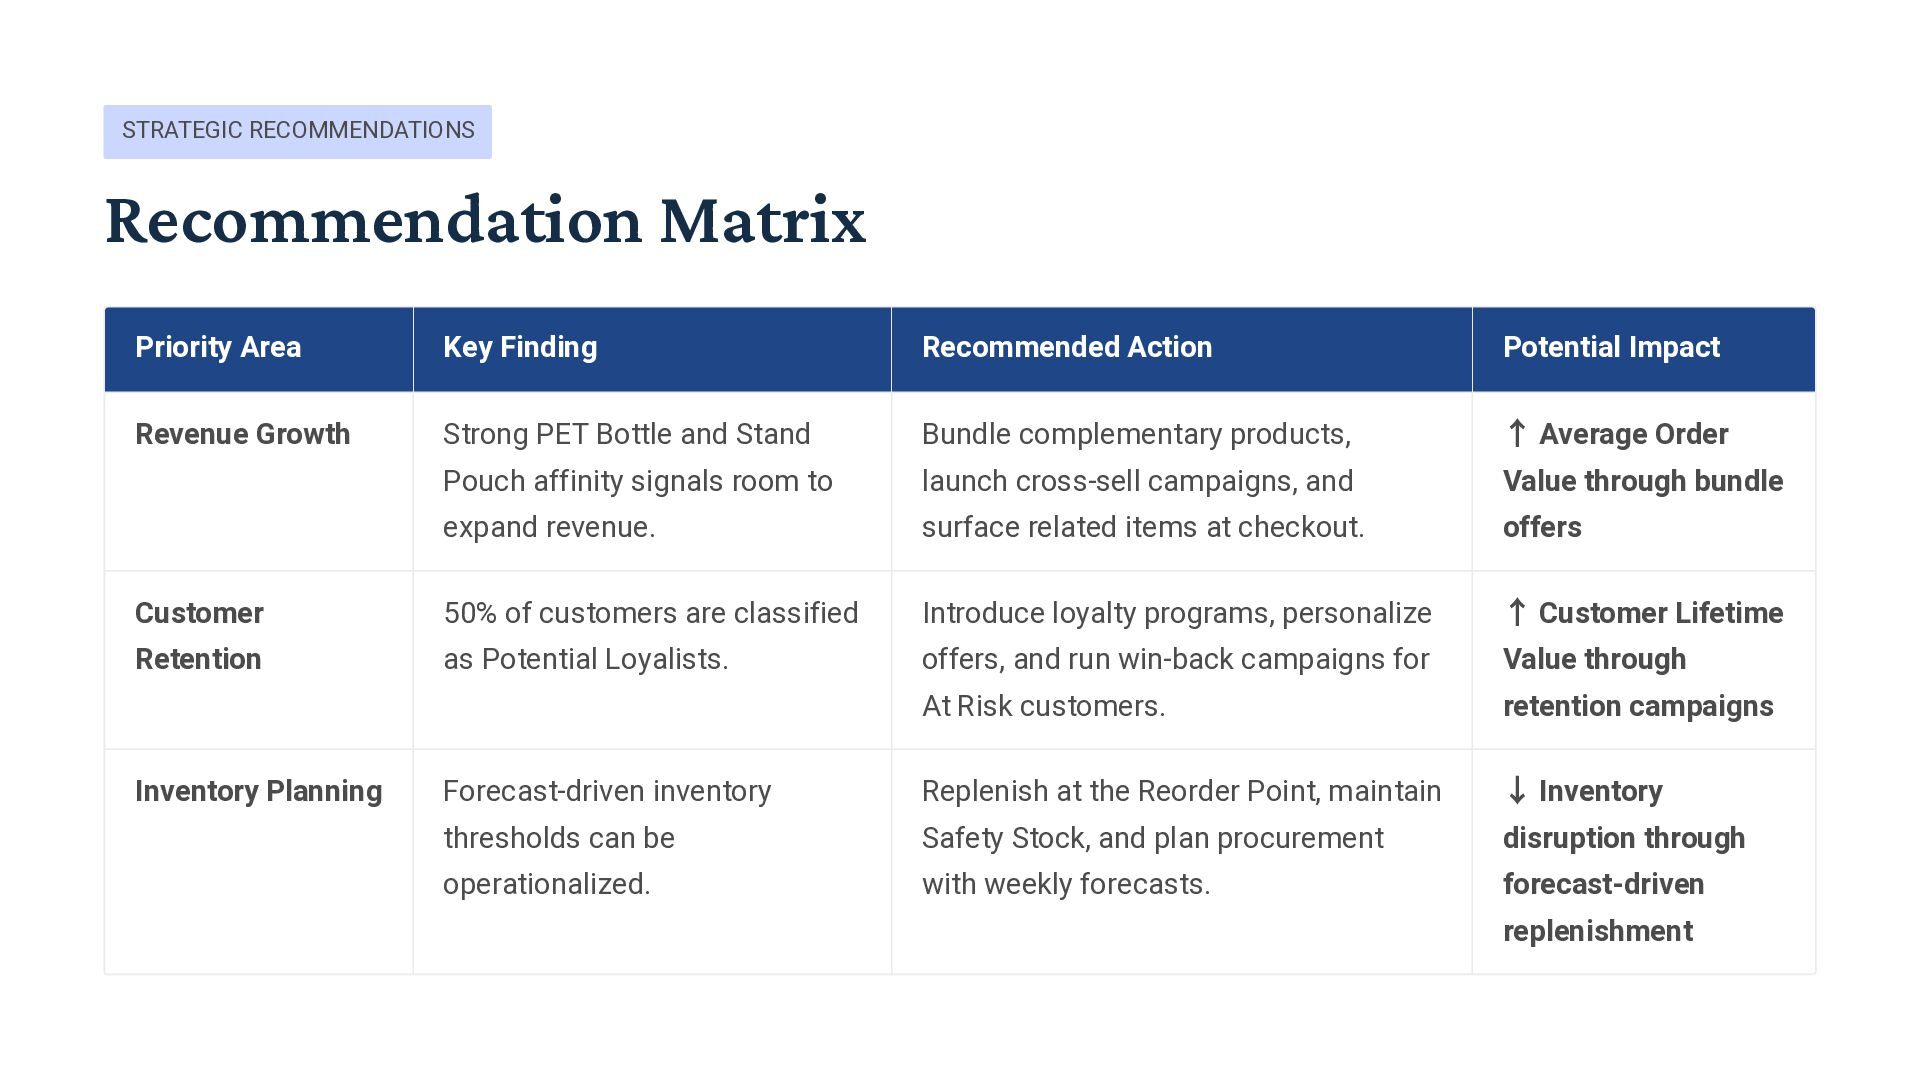
  7. STRATEGIC RECOMMENDATIONS Recommendation Matrix Priority Area Key Finding Recommended Action

    Potential Impact Revenue Growth Strong PET Bottle and Stand Pouch affinity signals room to expand revenue. Bundle complementary products, launch cross-sell campaigns, and surface related items at checkout. ↑ Average Order Value through bundle offers Customer Retention 50% of customers are classified as Potential Loyalists. Introduce loyalty programs, personalize offers, and run win-back campaigns for At Risk customers. ↑ Customer Lifetime Value through retention campaigns Inventory Planning Forecast-driven inventory thresholds can be operationalized. Replenish at the Reorder Point, maintain Safety Stock, and plan procurement with weekly forecasts. ↓ Inventory disruption through forecast-driven replenishment
  8. BUSINESS IMPACT Key Business Outcomes Revenue Growth Cross-selling opportunities identified

    through product affinity analysis High-affinity product pairs reveal clear expansion paths to increase basket size and capture incremental revenue. Customer Retention 50% of customers classified as a high-potential growth segment A significant share of the base is ready for targeted activation, creating a strong runway for lifetime value expansion. Operational Efficiency Forecast-driven inventory thresholds established for proactive replenishment planning Demand signals now support earlier replenishment decisions, reducing stockout exposure and improving service reliability. By integrating customer analytics, product affinity analysis, and inventory forecasting, marketplace resellers can make more informed commercial and operational decisions that support sustainable growth.