Upgrade to Pro — share decks privately, control downloads, hide ads and more …

Find Slow PL/SQL with Profilers

Find Slow PL/SQL with Profilers

Shashank Barki shares his experience using PL/SQL profilers (DBMS_PROFILER and DBMS_HPROF) to identify bottlenecks in PL/SQL code. Shashank is a Senior Principal Data Engineer at Manhattan Associates. He has 13 years experience as a developer, cloud architect and data analyst. In each of his jobs, he has promoted the use of PL/SQL to improve the performance, security and maintainability of their applications.

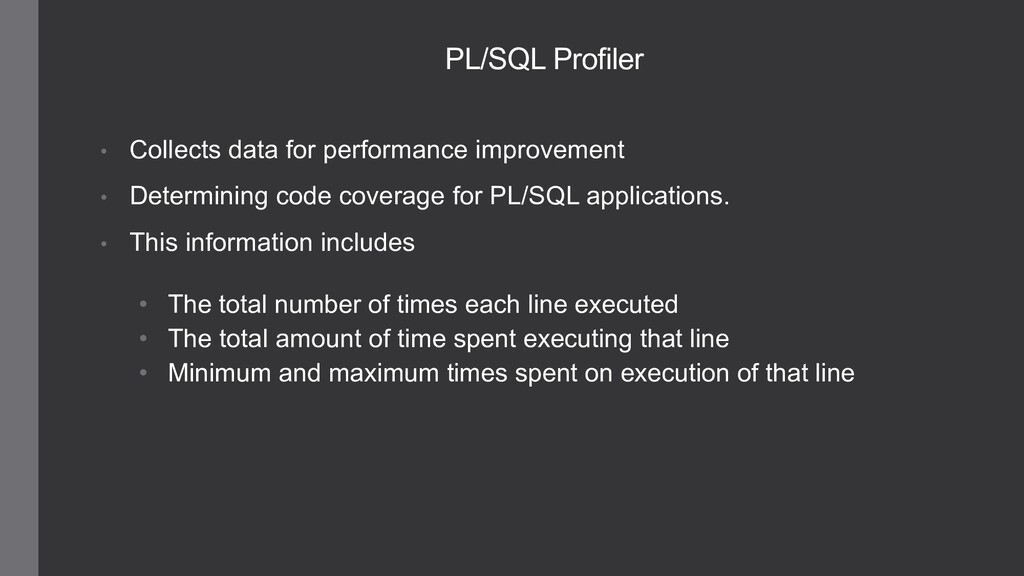
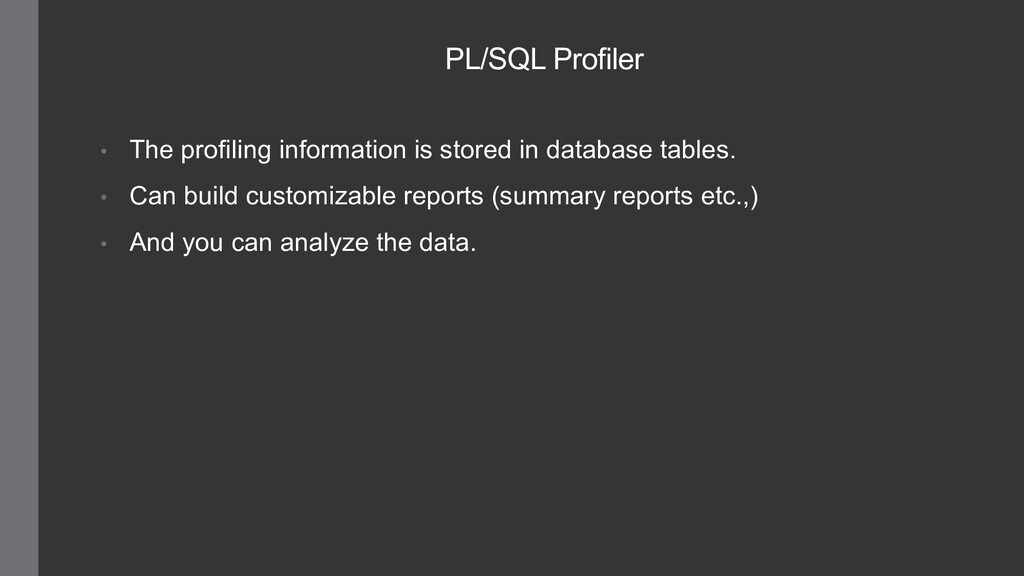
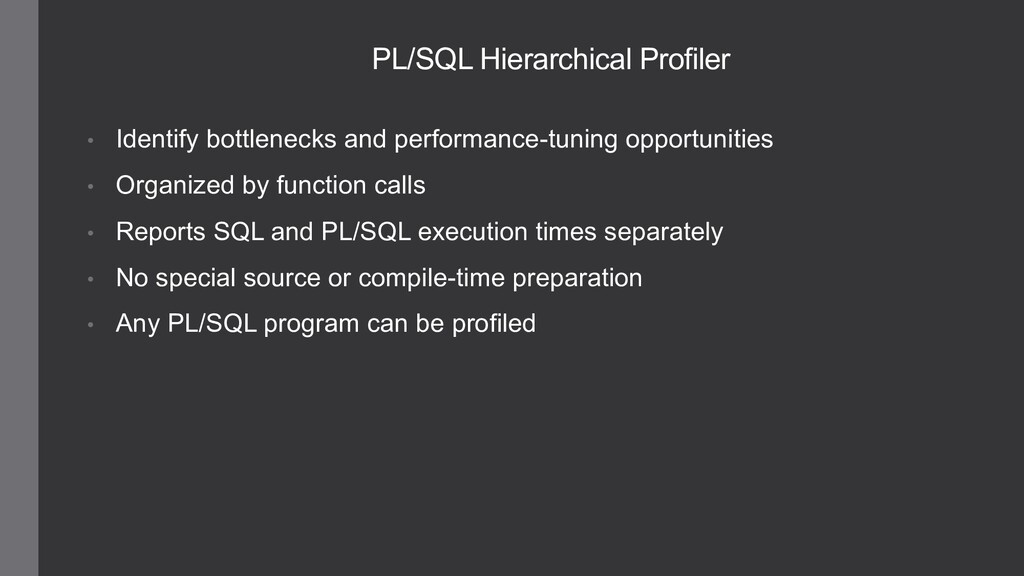
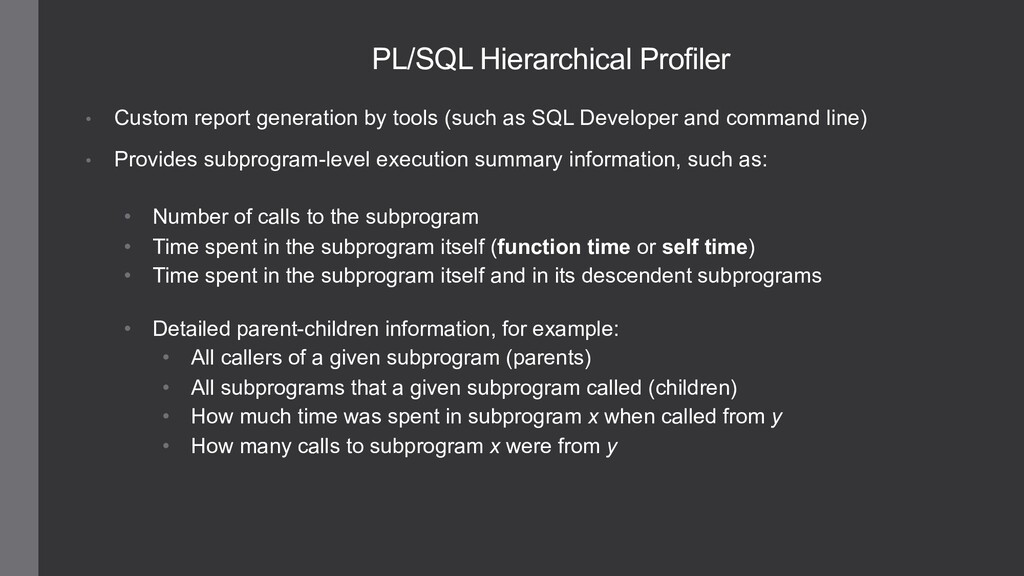
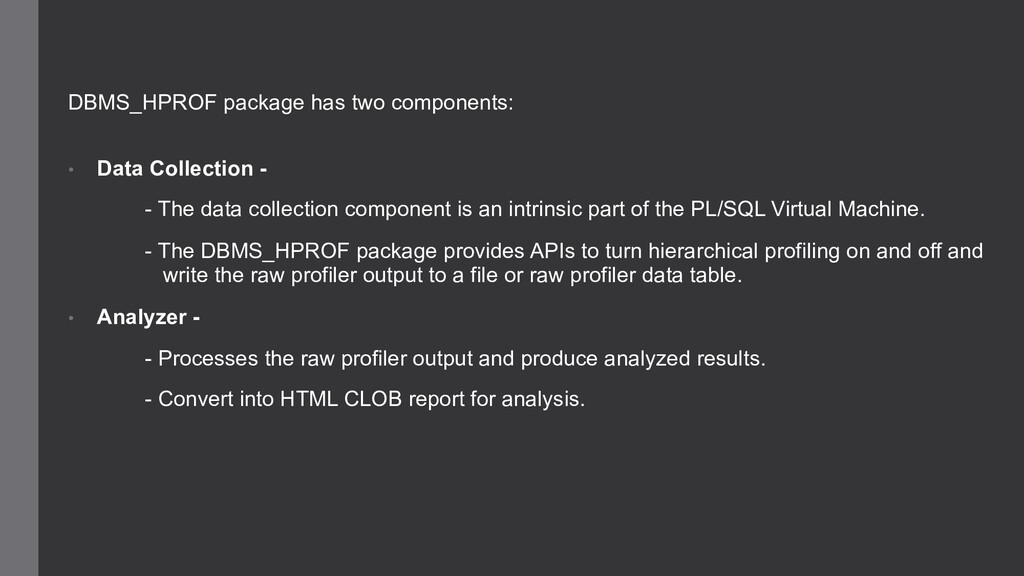
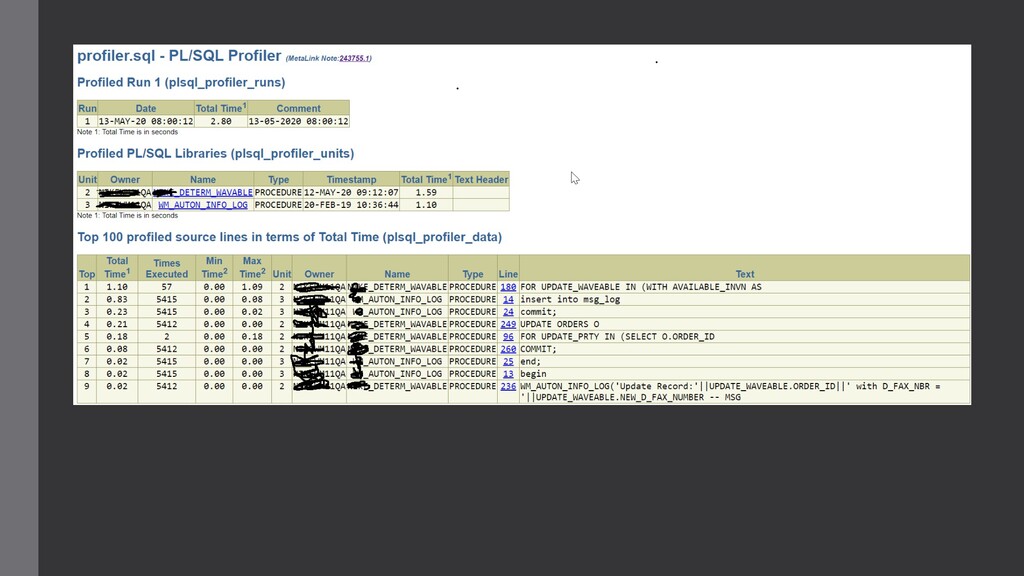
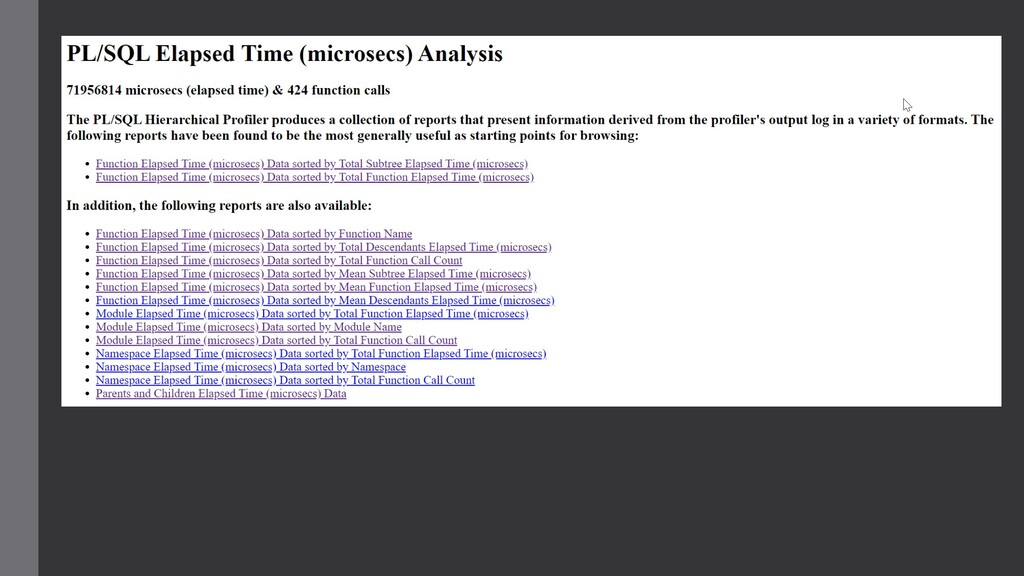
DBMS_PROFILER is the name of the package that provides an API to the profiler that computes the time that your PL/SQL program spends at each line, in each subprogram. Saves runtime statistics in database tables, which you can then query.

Steven Feuerstein

June 02, 2020
Tweet

More Decks by Steven Feuerstein

Other Decks in Technology

Transcript

  1. • Senior principal data engineer in Manhattan associates. • 13

    years of industry experience as developer, cloud architect and data analyst. • PL/SQL evangelist. • Life is easy (or tough) when you support Arsenal FC, read PG Wodehouse and eat Mangoes (!). Shashank Barki / @shankbarki
  2. • Code flow • Iterations • Number of executions •

    Sub program calls • Bulk operations ? • Nested calls PL/SQL Performance
  3. • Collects data for performance improvement • Determining code coverage

    for PL/SQL applications. • This information includes • The total number of times each line executed • The total amount of time spent executing that line • Minimum and maximum times spent on execution of that line PL/SQL Profiler
  4. • The profiling information is stored in database tables. •

    Can build customizable reports (summary reports etc.,) • And you can analyze the data. PL/SQL Profiler
  5. PL/SQL Hierarchical Profiler • Identify bottlenecks and performance-tuning opportunities •

    Organized by function calls • Reports SQL and PL/SQL execution times separately • No special source or compile-time preparation • Any PL/SQL program can be profiled
  6. PL/SQL Hierarchical Profiler • Custom report generation by tools (such

    as SQL Developer and command line) • Provides subprogram-level execution summary information, such as: • Number of calls to the subprogram • Time spent in the subprogram itself (function time or self time) • Time spent in the subprogram itself and in its descendent subprograms • Detailed parent-children information, for example: • All callers of a given subprogram (parents) • All subprograms that a given subprogram called (children) • How much time was spent in subprogram x when called from y • How many calls to subprogram x were from y
  7. DBMS_HPROF package has two components: • Data Collection - -

    The data collection component is an intrinsic part of the PL/SQL Virtual Machine. - The DBMS_HPROF package provides APIs to turn hierarchical profiling on and off and write the raw profiler output to a file or raw profiler data table. • Analyzer - - Processes the raw profiler output and produce analyzed results. - Convert into HTML CLOB report for analysis.