Upgrade to Pro — share decks privately, control downloads, hide ads and more …

DevOps results - conference season 2014

Steve Pereira
November 07, 2014

DevOps results - conference season 2014

Wrapup from Velocity, DevOpsDays and DevOps Enterprise 2014 at DevOpsTO

Steve Pereira

November 07, 2014
Tweet

More Decks by Steve Pereira

Other Decks in Technology

Transcript

  1. Puppet 2014 State of DevOps survey results 30x more frequent

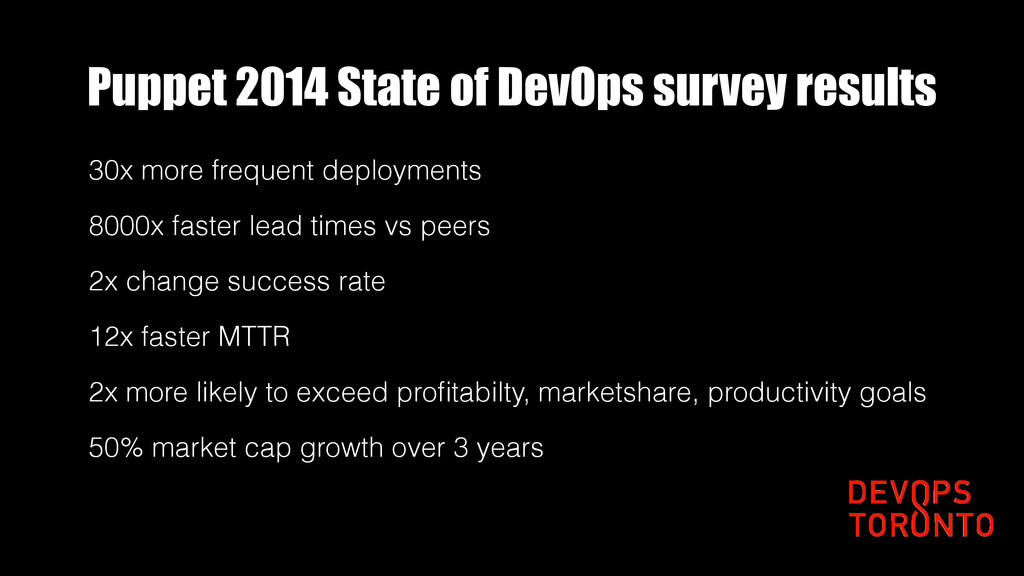
    deployments 8000x faster lead times vs peers 2x change success rate 12x faster MTTR 2x more likely to exceed profitabilty, marketshare, productivity goals 50% market cap growth over 3 years
  2. Ticketmaster 17 disparate ticketing systems > 1 Teams reorged around

    delivery - devs on call 6 week deploy > 6 min 109 deploys /month 30% revenue increase
  3. Target > 30 APIs 80 deploys /week - 1884 jenkins

    jobs 1.5 billion visits /month < 10 incidents /month 270 cookbook repos 134 engineers + 30 teams
  4. Macy's Development cost down to 55M /year from 100M 140%

    increase in products under development Capacity for innovation from ~5% to ~40%
  5. Nordstrom 63k employees 1800 tech Annual planning to sprints Features

    /month up by 50% Bugs /month down by 50% 22 week releases to and semiweekly
  6. IBM Life Insurance client Dev productivity up 1600% 75% of

    teams converted to agile from waterfall 11 months early developing major product
  7. Nationwide 5 year span 80% reduction in critical defects 86%

    reduction in high defects 90% on time delivery vs 60% 70% increase in product availability
  8. Orbitz 10+ year old codebase Unified VCS, JDK versions and

    Frameworks Switched to product teams Dev/Prod parity Reduced overall server count by 25% Reduced search server count by 90%
  9. IDC Global 1000 forecast for 2yrs Avg deployment frequency will

    double 20% faster time to market 50% have DevOps focused task force
  10. Blackboard 6 month lead time to 1-2 weeks 3 month

    testing cycle to < 30min acceptance test time 6 hours value time from 70 hours total = 64 hours of lag
  11. CSG 40 dev teams 50M customers 100k call centre seats

    6B transactions /month 20 tech stacks 50 apps
  12. CSG Batch size down from 28 to 14 weeks 10

    days recovery to 2 days Redeploying reduces recovery to 1 day 70 deployments to Dev/Test prior to Prod
  13. Mitre 15 days to 9 days total cycle time 2

    mins deployment 65% reduction in manual deploys 38% increase in thoroughput Freed up 2.5 deployment staff
  14. Huawei Dev: 20min > 2min test per 10M LOC Prod:

    300min > 10min test per 10M LOC Regression 240min > 60mins Full suite 24h > 6 hours Feature cycle time 30 days > 7 days
  15. Huawei 480K code reviews / day 100K builds per /

    day 100M test cases run / day 10K releases / day
  16. Atlassian Actions Started using Vagrant + Puppet-lint BDD + Continuous

    Integration AWS for branch integration testing ChatOps integration and automation
  17. US DHS Compliance drives testing requirements 1 year release cycle

    for a simple change
 to Running Chaos Monkey
  18. Holistic Results ▲ Increased job satisfaction ▲ Increased visibility +

    estimation ▲ Increased accountability + confidence ▲ IT as a competitive advantage ▲ Increased alignment
  19. Observations • Rock bottom required • Successful starts with business

    objectives • Fear of satisfying reg and compliance • DevOps is the only way to tackle legacy • Agile and Lean foundation • 3-6 year process
  20. Common Resources Books The Goal The Phoenix Project Continuous Delivery

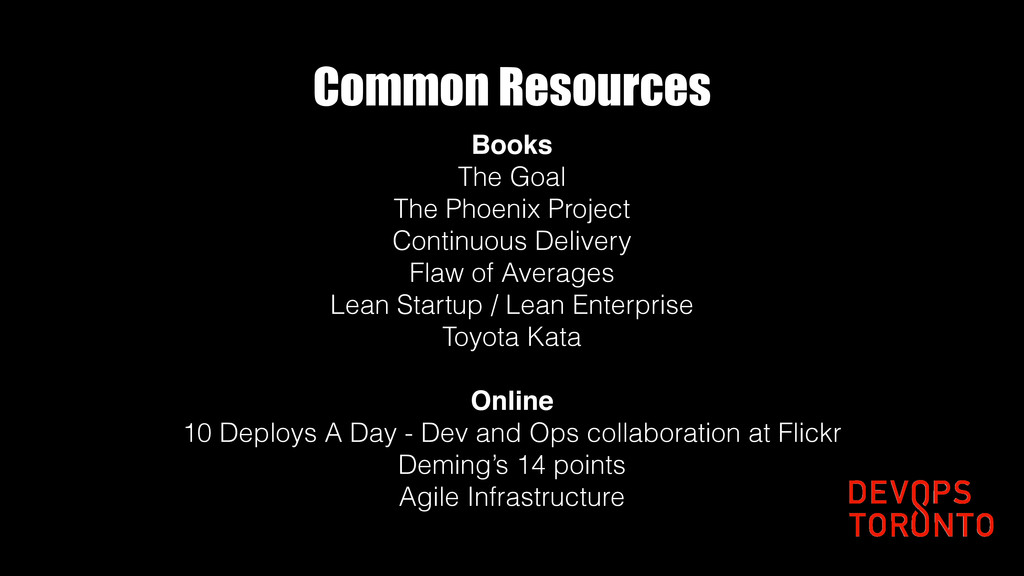
    Flaw of Averages Lean Startup / Lean Enterprise Toyota Kata Online 10 Deploys A Day - Dev and Ops collaboration at Flickr Deming’s 14 points Agile Infrastructure