Upgrade to Pro — share decks privately, control downloads, hide ads and more …

Ways To Measure Your ORM's Cost

Ways To Measure Your ORM's Cost

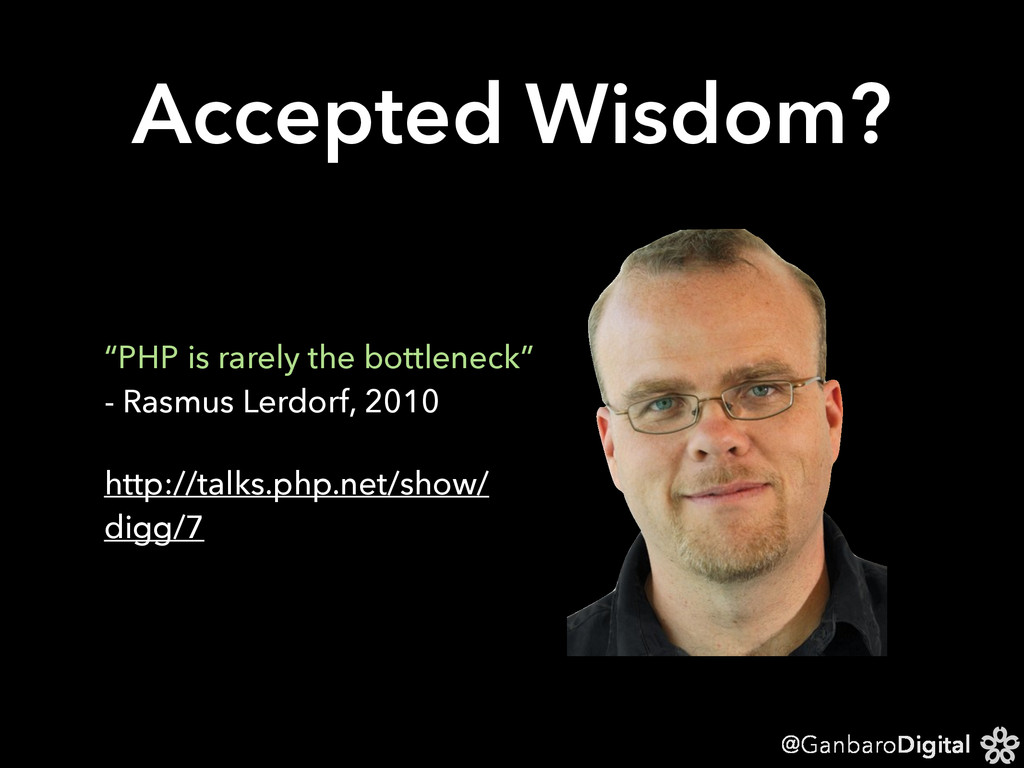
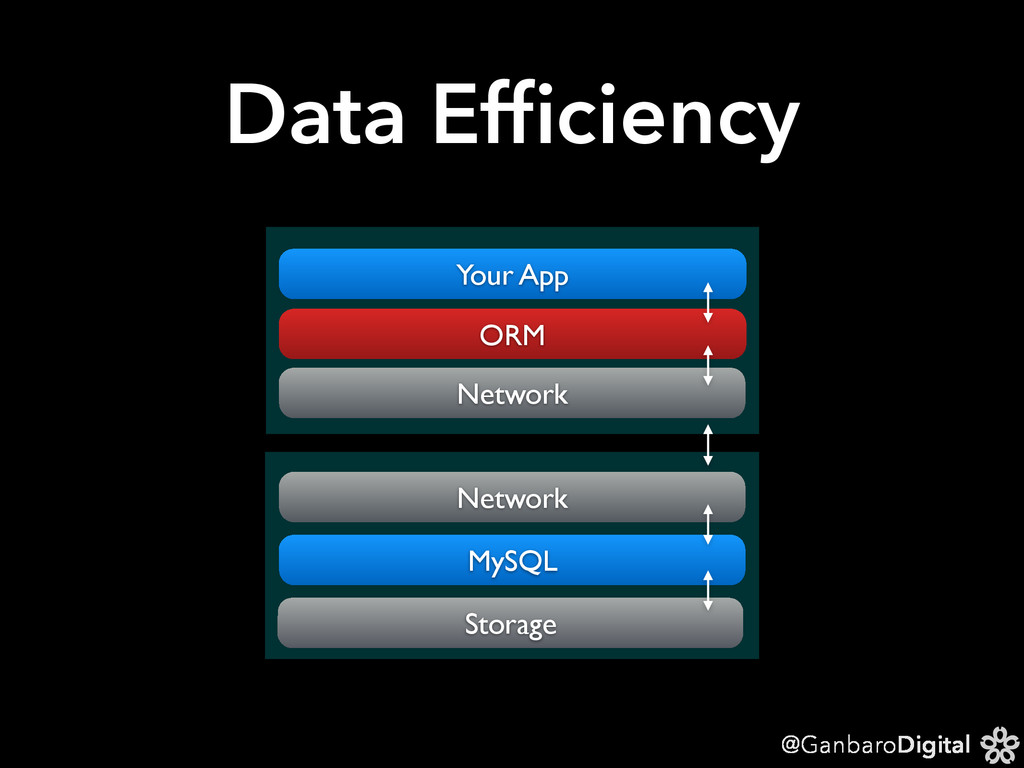
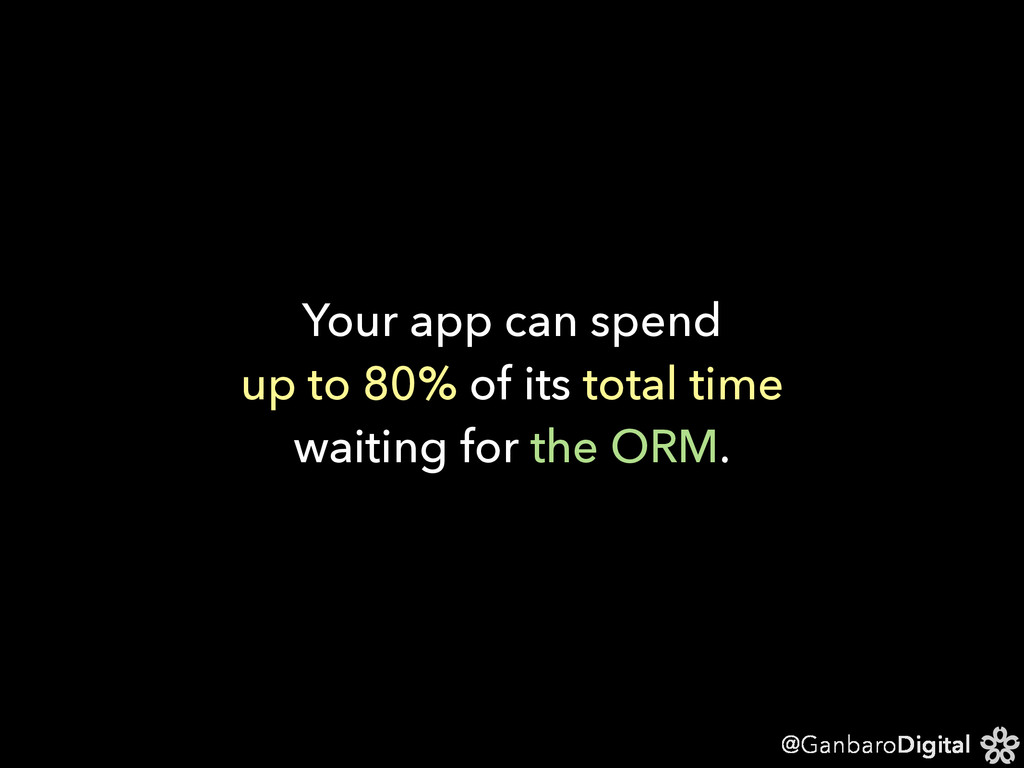
Your project has adopted an ORM such as Doctrine because it's the quickest way to hook your code up to your database. Things are looking up, and your website is about to take off. Aaaand then the first complaints start to come in that your site isn't coping with the new customers. You can't find a problem in your own code. Could it be the ORM that's the problem? How can you tell?

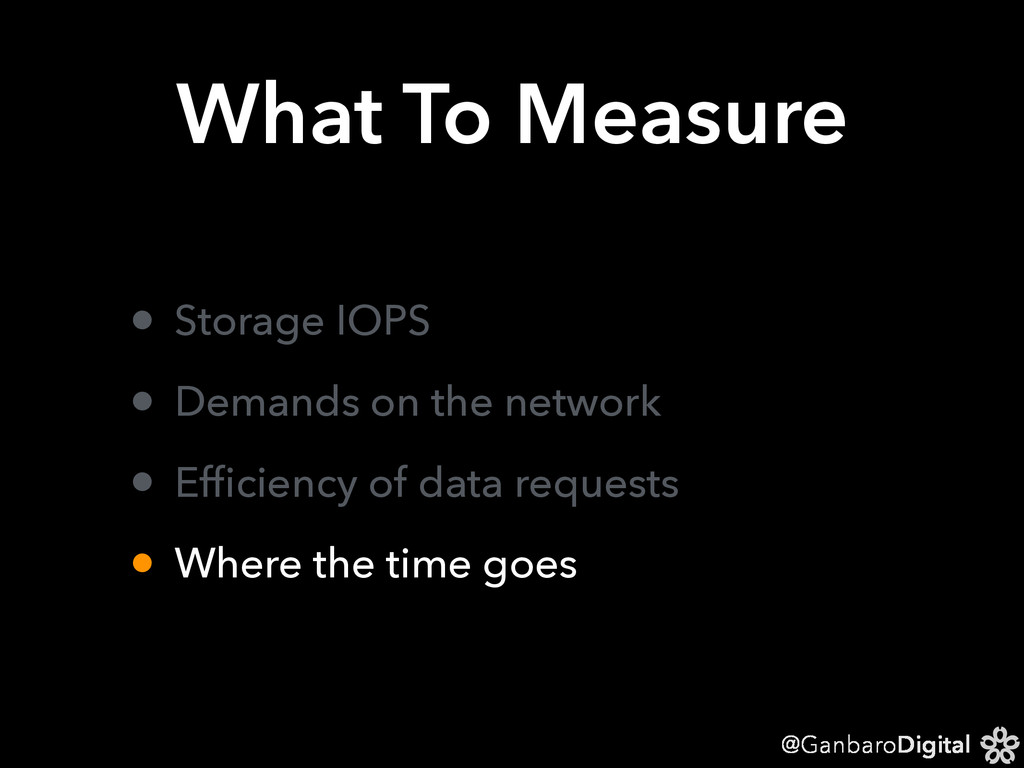
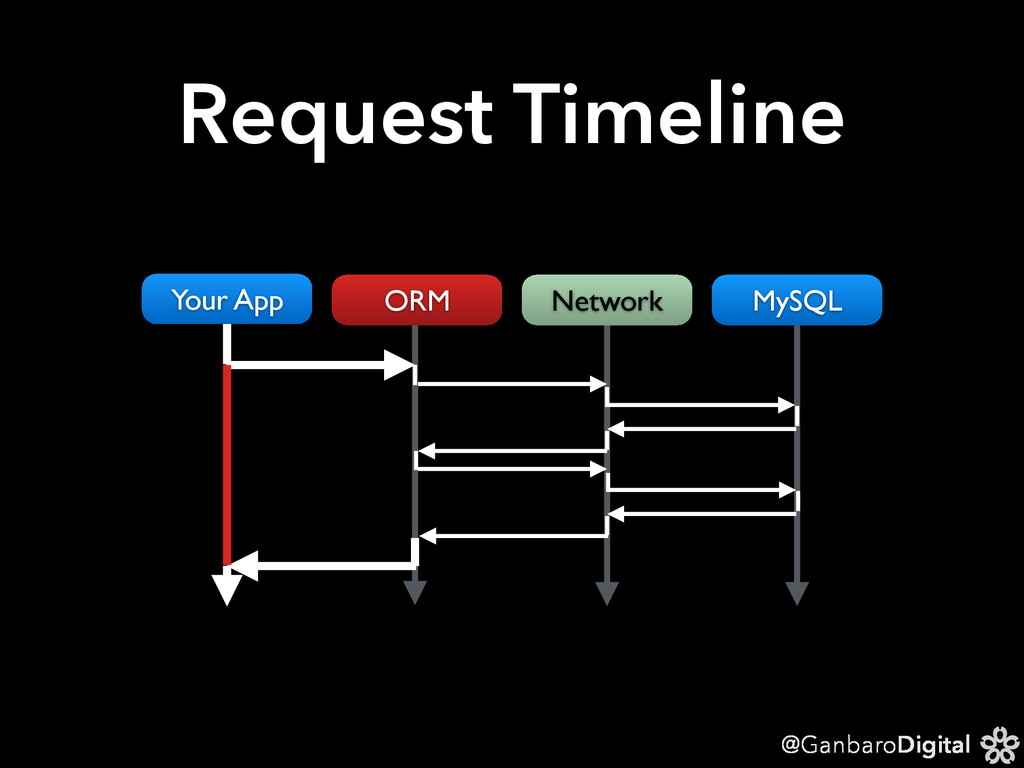
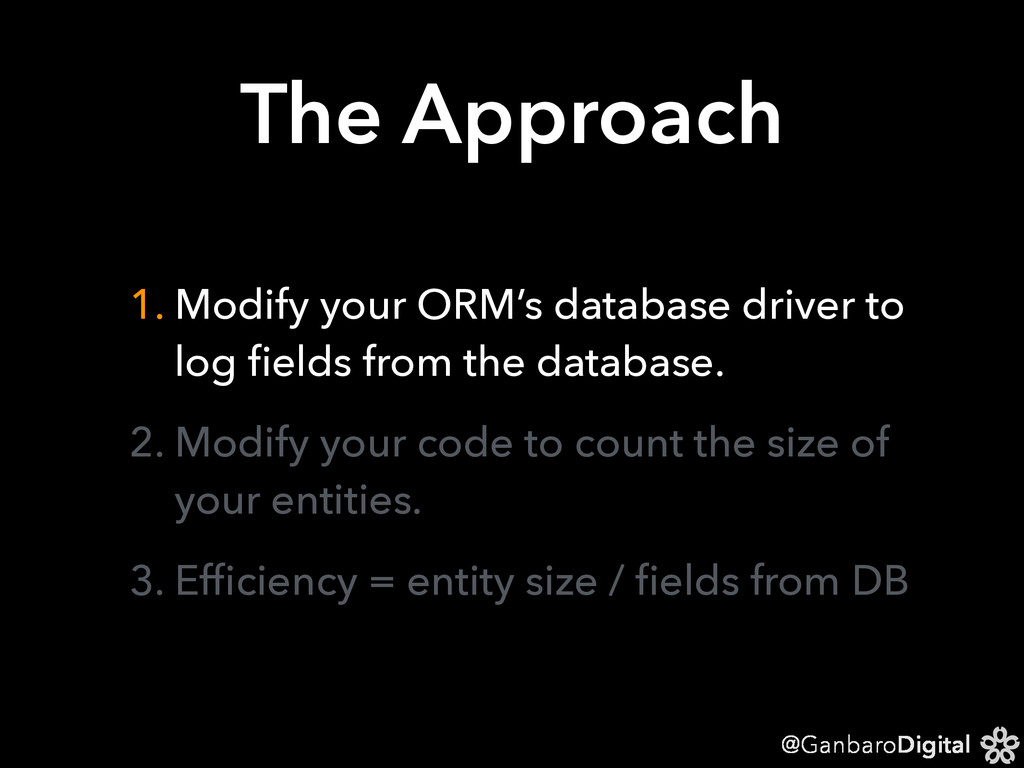
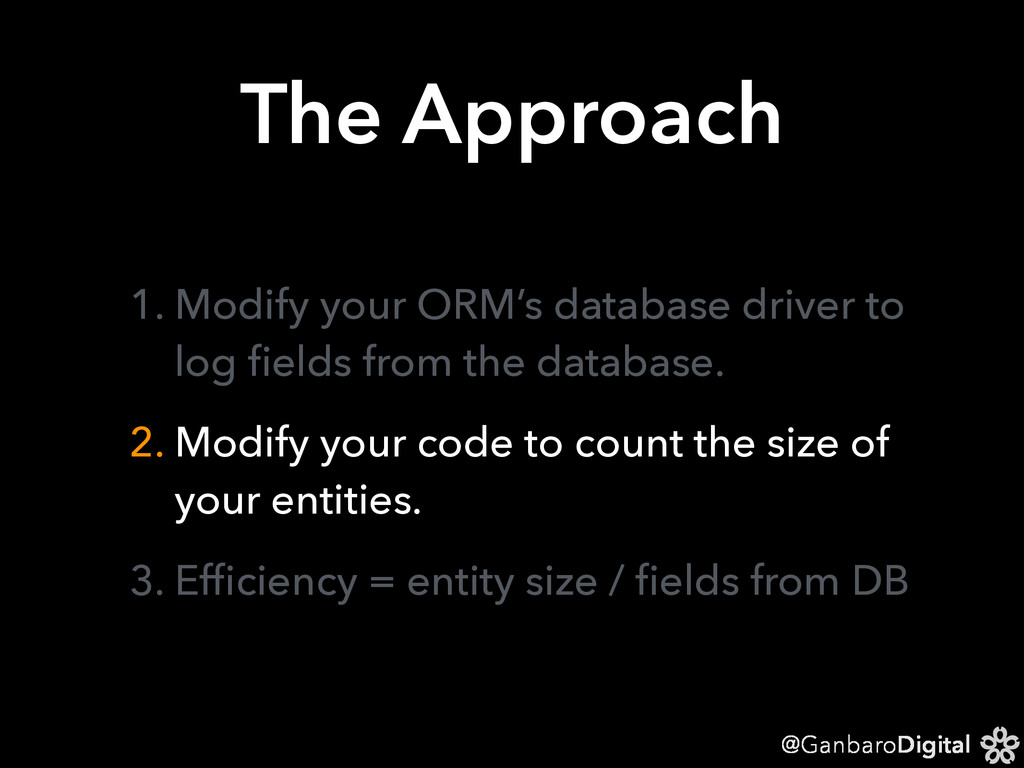
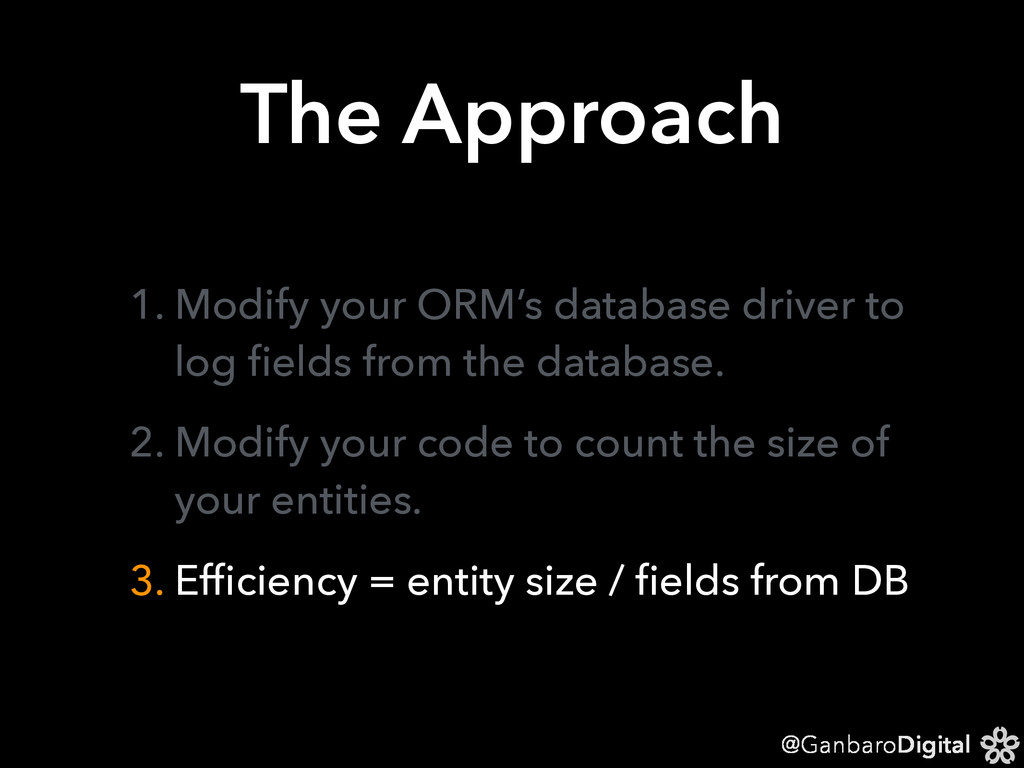
In this talk, Stuart will show you how you can use off-the-shelf open-source tools to work out what your ORM is doing, and whether or not it is the cause of your performance problems. He'll show you how to measure the database itself and the ORM code, as well as providing useful strategies to reduce the cost of your ORM without having to abandon the ORM altogether. Finally, he'll show you how you can extend these techniques to other parts of your application, so that you're never in the dark again.

Presented at #PHPNW15 in October, 2015.

Stuart Herbert

October 04, 2015
Tweet

More Decks by Stuart Herbert

Other Decks in Programming

Transcript

  1. @GanbaroDigital When you use an ORM, you are hiding persistent

    data storage and retrieval behind an abstraction.
  2. @GanbaroDigital The current fashion is to write Java-style code for

    a language that doesn’t have JVM-style performance.
  3. @GanbaroDigital What To Measure • Storage IOPS • Demands on

    the network • Efficiency of data requests • Where the time goes
  4. @GanbaroDigital What To Measure • Storage IOPS • Demands on

    the network • Efficiency of data requests • Where the time goes
  5. @GanbaroDigital What To Measure • Storage IOPS • Demands on

    the network • Efficiency of data requests • Where the time goes
  6. @GanbaroDigital What To Measure • Storage IOPS • Demands on

    the network • Efficiency of data requests • Where the time goes
  7. @GanbaroDigital Dev Environments • Dev laptops use PCIe SSDs •

    Typically perform around 100K IOPS • Cheap SATA SSDs can do 50K+ IOPS
  8. @GanbaroDigital Dev Environments • Dev laptops use PCIe SSDs •

    Typically perform around 100K IOPS • Cheap SATA SSDs can do 50K+ IOPS
  9. @GanbaroDigital Dev Environments • Dev laptops use PCIe SSDs •

    Typically perform around 100K IOPS • Cheap SATA SSDs can do 50K+ IOPS
  10. @GanbaroDigital Servers • Servers typically use SAS RAID arrays •

    Yields 0.4 - 2K IOPS • SATA-equipped servers are even slower!
  11. @GanbaroDigital Servers • Servers typically use SAS RAID arrays •

    Yields 0.4 - 2K IOPS • SATA-equipped servers are even slower!
  12. @GanbaroDigital Servers • Servers typically use SAS RAID arrays •

    Yields 0.4 - 2K IOPS • SATA-equipped servers are even slower!
  13. @GanbaroDigital In The Cloud • Servers typically over-subscribed • Need

    large, slow disks to support all the customers and their VMs • Maybe 1K IOPS shared between many VMs!
  14. @GanbaroDigital In The Cloud • Servers typically over-subscribed • Need

    large, slow disks to support all the customers and their VMs • Maybe 1K IOPS shared between many VMs!
  15. @GanbaroDigital In The Cloud • Servers typically over-subscribed • Need

    large, slow disks to support all the customers and their VMs • Maybe 1K IOPS shared between many VMs!
  16. @GanbaroDigital For the first time in the 
 history of

    web development, your dev machine’s storage is faster than Production’s storage.
  17. @GanbaroDigital Other Tips • Move your database onto its own

    filesystem • Don’t forget to monitor how much IOPS your logging causes
  18. @GanbaroDigital Other Tips • Move your database onto its own

    filesystem • Don’t forget to monitor how much IOPS your logging causes
  19. @GanbaroDigital Scaling out allows you to serve more customers at

    once. It does not help you to serve a single customer faster.
  20. @GanbaroDigital MySQL Proxy • Point your app at mysql-proxy •

    Use the ‘debug-blind.lua’ proxy plugin
  21. @GanbaroDigital MySQL Proxy • Point your app at mysql-proxy •

    Use the ‘debug-blind.lua’ proxy plugin
  22. @GanbaroDigital What It Tells Us • Complete log of all

    SQL requests • How long each request takes • Number of rows returned • Whether or not an index was used
  23. @GanbaroDigital What It Tells Us • Complete log of all

    SQL requests • How long each request takes • Number of rows returned • Whether or not an index was used
  24. @GanbaroDigital What It Tells Us • Complete log of all

    SQL requests • How long each request takes • Number of rows returned • Whether or not an index was used
  25. @GanbaroDigital What It Tells Us • Complete log of all

    SQL requests • How long each request takes • Number of rows returned • Whether or not an index was used
  26. @GanbaroDigital Your app may use less than 10% of the

    data retrieved from the database.
  27. @GanbaroDigital The Approach 1. Modify your ORM’s database driver to

    log fields from the database. 2. Modify your code to count the size of your entities. 3. Efficiency = entity size / fields from DB
  28. @GanbaroDigital The Approach 1. Modify your ORM’s database driver to

    log fields from the database. 2. Modify your code to count the size of your entities. 3. Efficiency = entity size / fields from DB
  29. @GanbaroDigital The Approach 1. Modify your ORM’s database driver to

    log fields from the database. 2. Modify your code to count the size of your entities. 3. Efficiency = entity size / fields from DB
  30. @GanbaroDigital Your app can spend up to 80% of its

    total time waiting for the ORM.
  31. @GanbaroDigital • Xdebug • XHProf • Blackfire.IO • Zend Z-Ray

    • AppDynamics • or build your own instrumentation using Graphite Profilers For PHP