This talk is about a unique way in which debuggers can be written in language which are lisp like.
With CIDER debug as an example, this talk takes you through how this approach works under the hood.
This talk was presented at Functional Conf 2019.
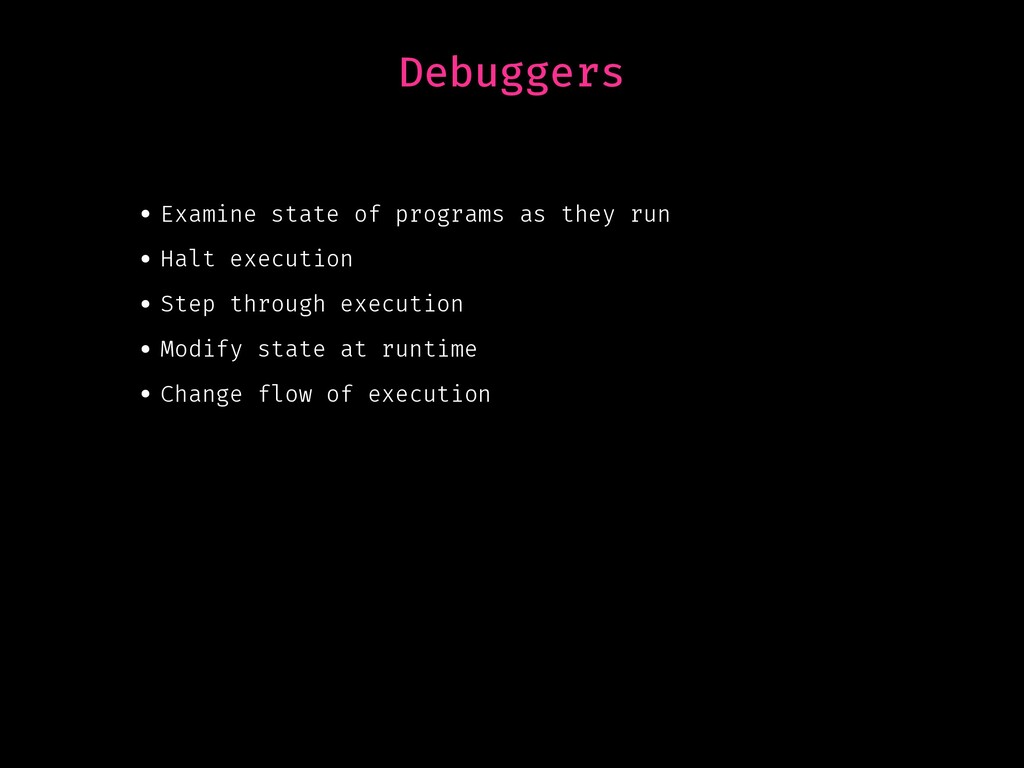
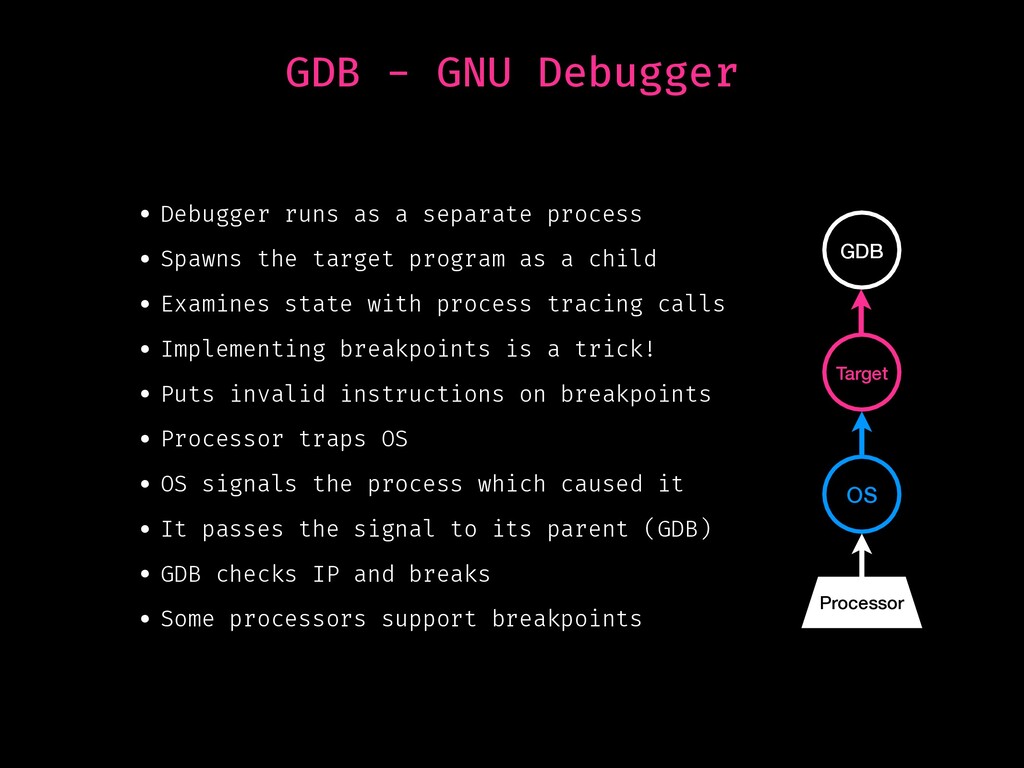
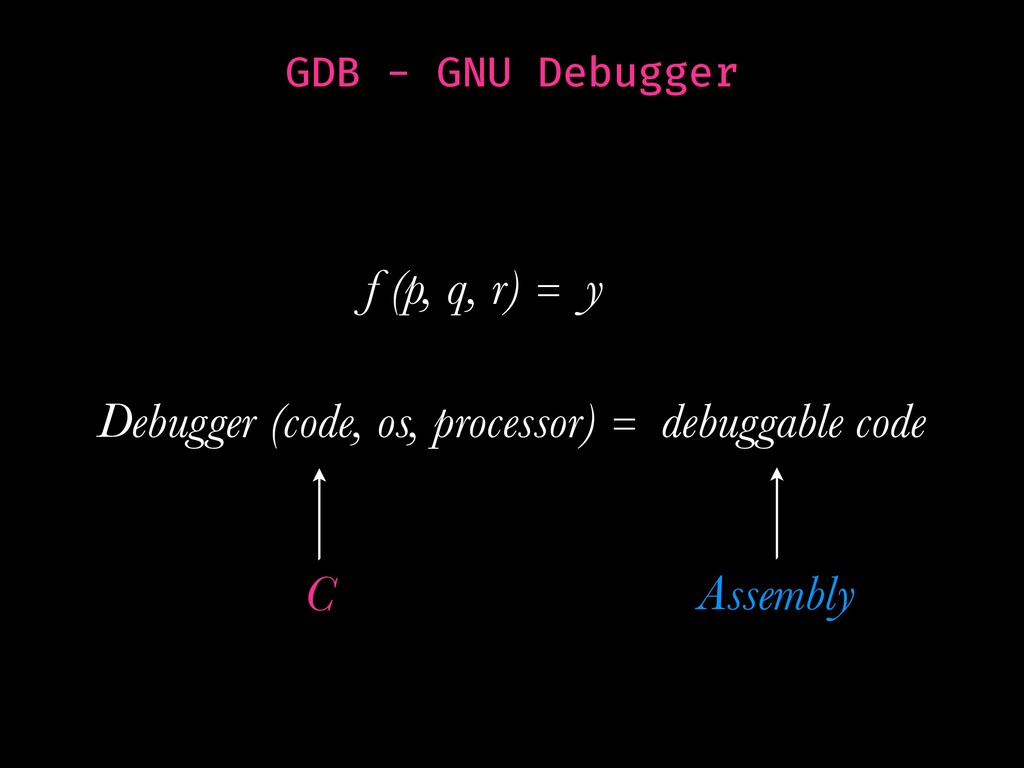
process • Spawns the target program as a child • Examines state with process tracing calls • Implementing breakpoints is a trick! • Puts invalid instructions on breakpoints • Processor traps OS • OS signals the process which caused it • It passes the signal to its parent (GDB) • GDB checks IP and breaks • Some processors support breakpoints GDB Target OS Processor
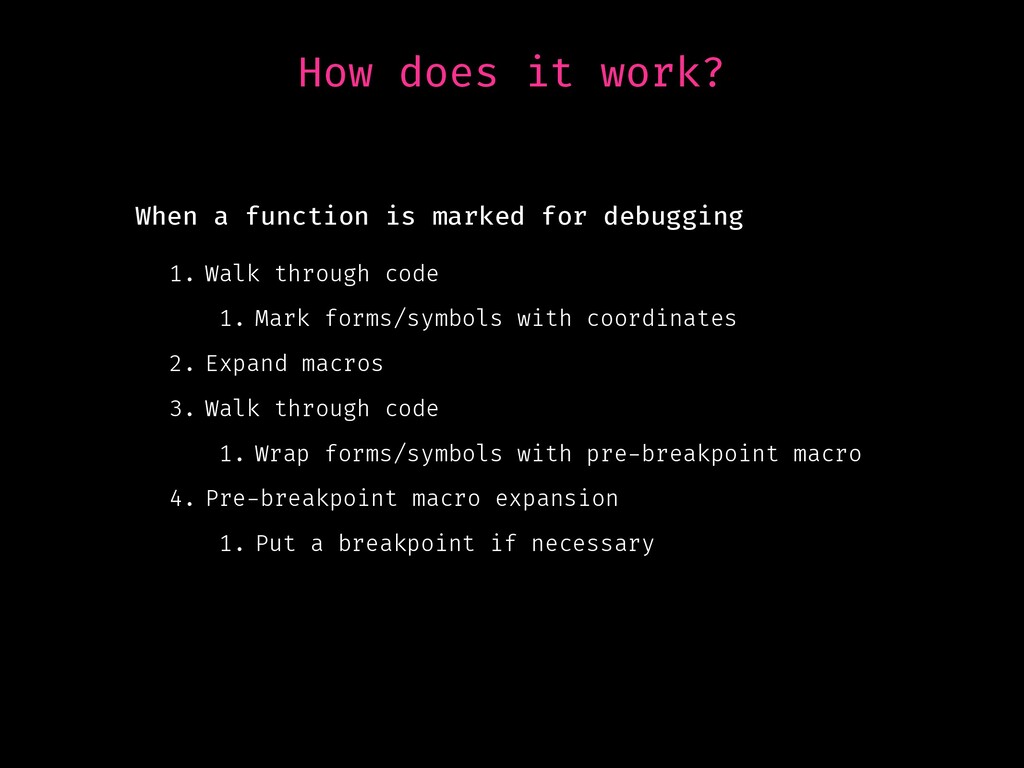
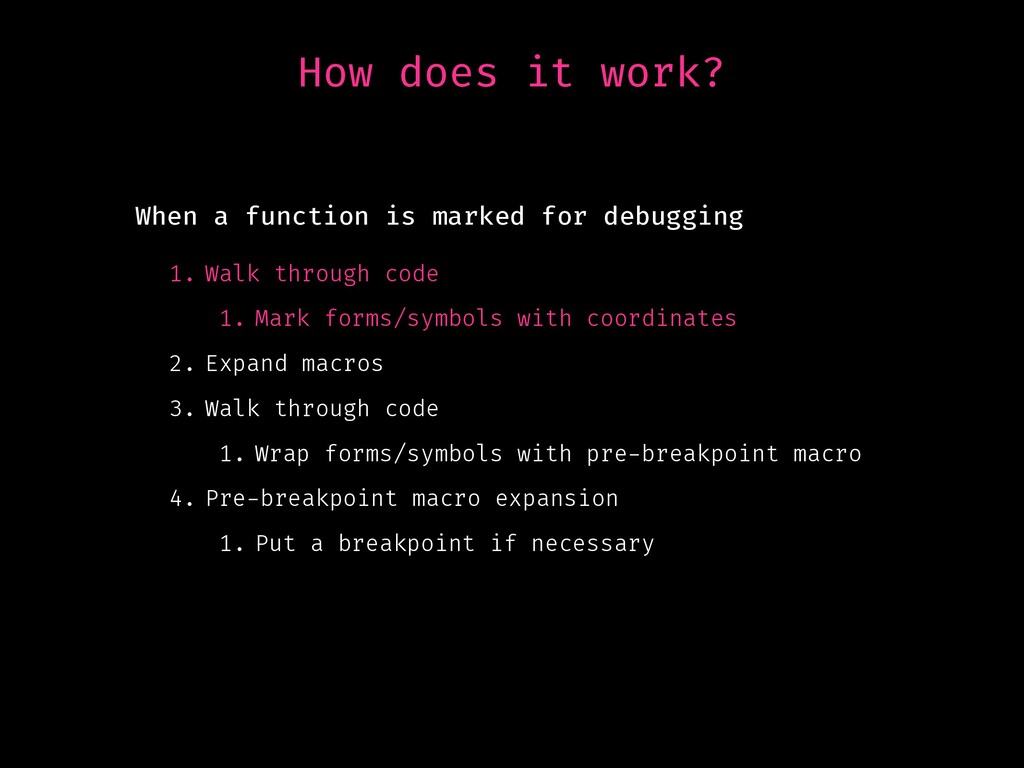
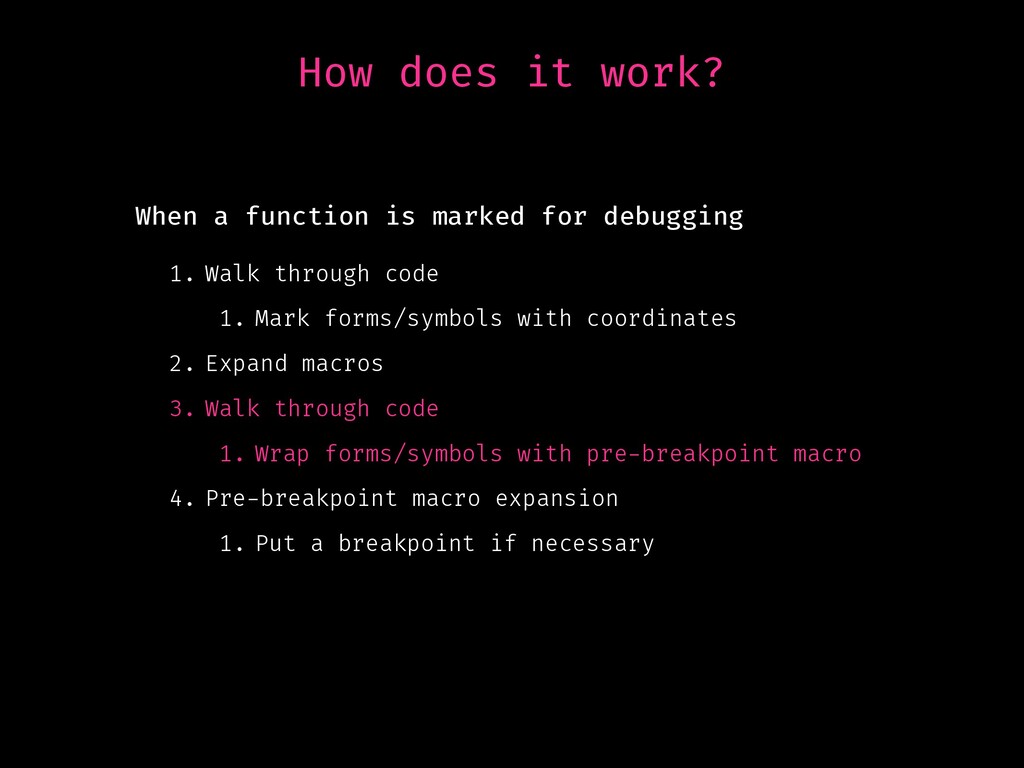
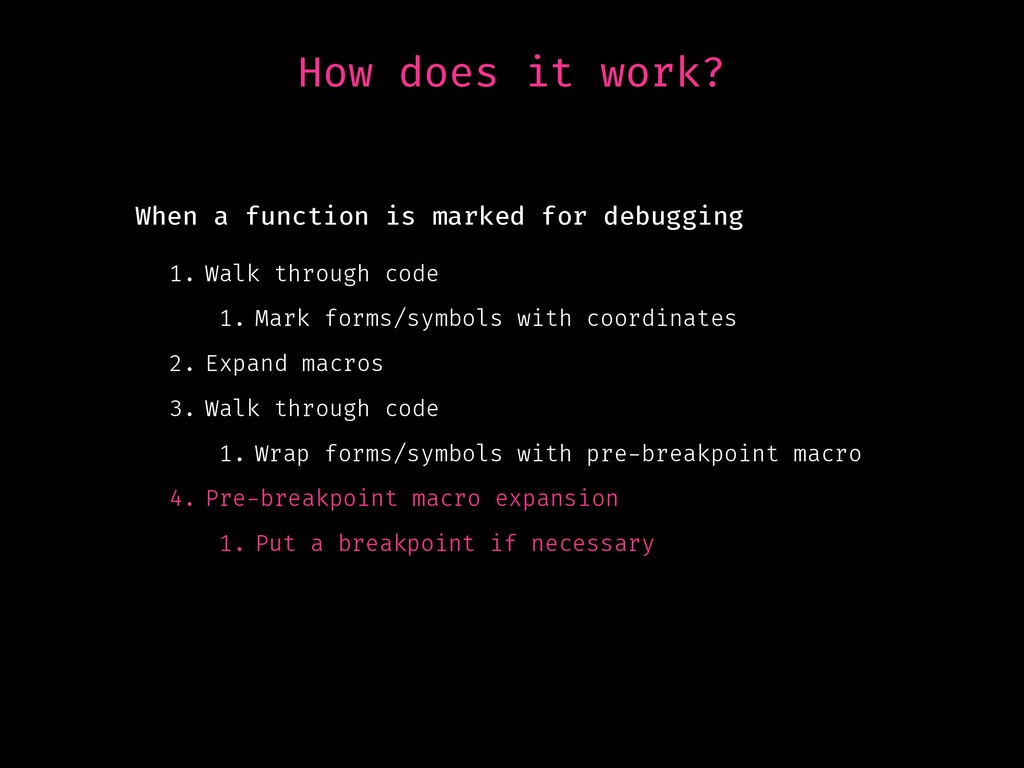
forms/symbols with coordinates 2. Expand macros 3. Walk through code 1. Wrap forms/symbols with pre-breakpoint macro 4. Pre-breakpoint macro expansion 1. Put a breakpoint if necessary When a function is marked for debugging
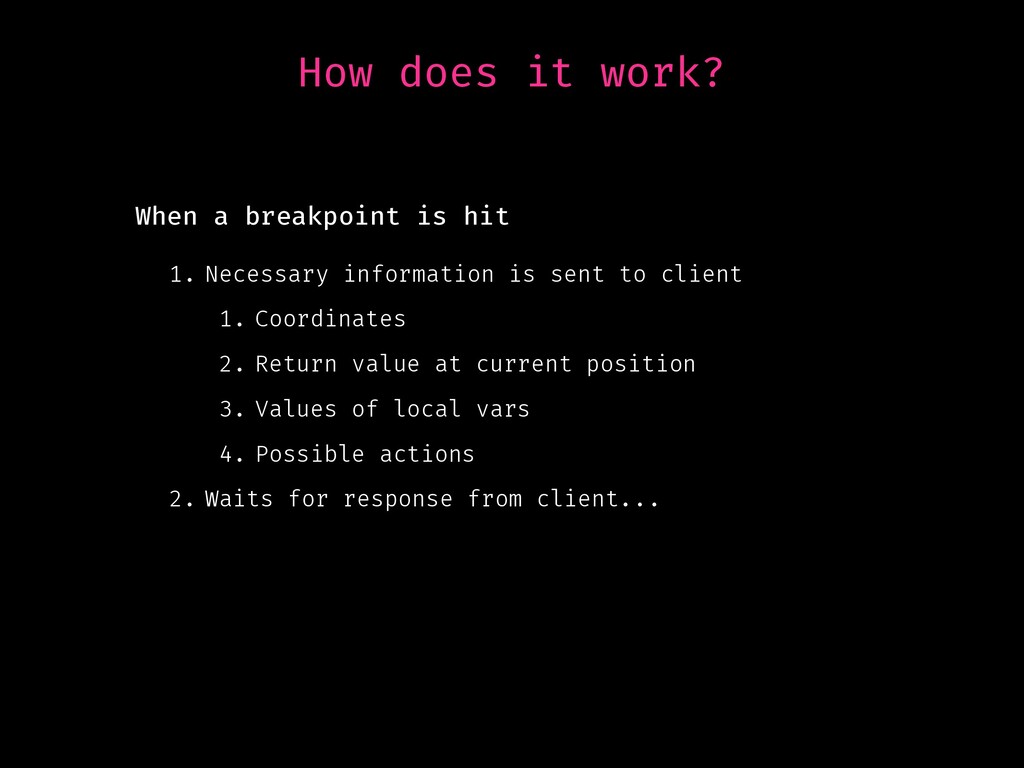
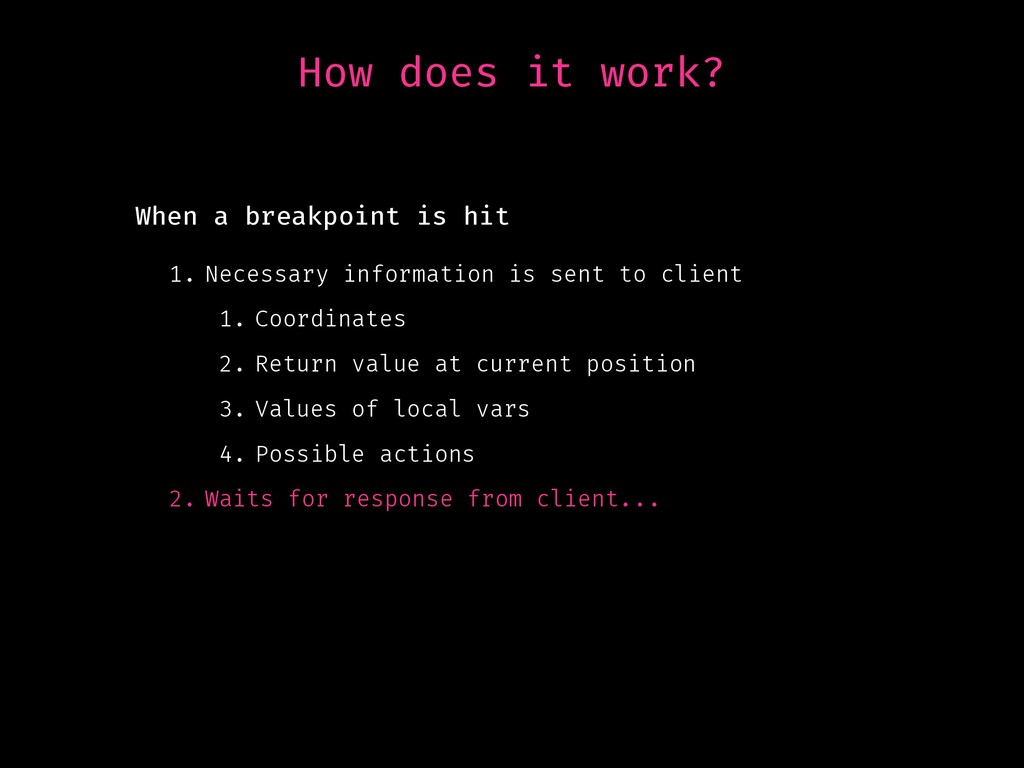
client 1. Coordinates 2. Return value at current position 3. Values of local vars 4. Possible actions 2. Waits for response from client. . . When a breakpoint is hit
forms/symbols with coordinates 2. Expand macros 3. Walk through code 1. Wrap forms/symbols with pre-breakpoint macro 4. Pre-breakpoint macro expansion 1. Put a breakpoint if necessary When a function is marked for debugging
forms/symbols with coordinates 2. Expand macros 3. Walk through code 1. Wrap forms/symbols with pre-breakpoint macro 4. Pre-breakpoint macro expansion 1. Put a breakpoint if necessary When a function is marked for debugging
forms/symbols with coordinates 2. Expand macros 3. Walk through code 1. Wrap forms/symbols with pre-breakpoint macro 4. Pre-breakpoint macro expansion 1. Put a breakpoint if necessary When a function is marked for debugging
forms/symbols with coordinates 2. Expand macros 3. Walk through code 1. Wrap forms/symbols with pre-breakpoint macro 4. Pre-breakpoint macro expansion 1. Put a breakpoint if necessary When a function is marked for debugging
client 1. Coordinates 2. Return value at current position 3. Values of local vars 4. Possible actions 2. Waits for response from client. . . When a breakpoint is hit
client 1. Coordinates 2. Return value at current position 3. Values of local vars 4. Possible actions 2. Waits for response from client. . . When a breakpoint is hit
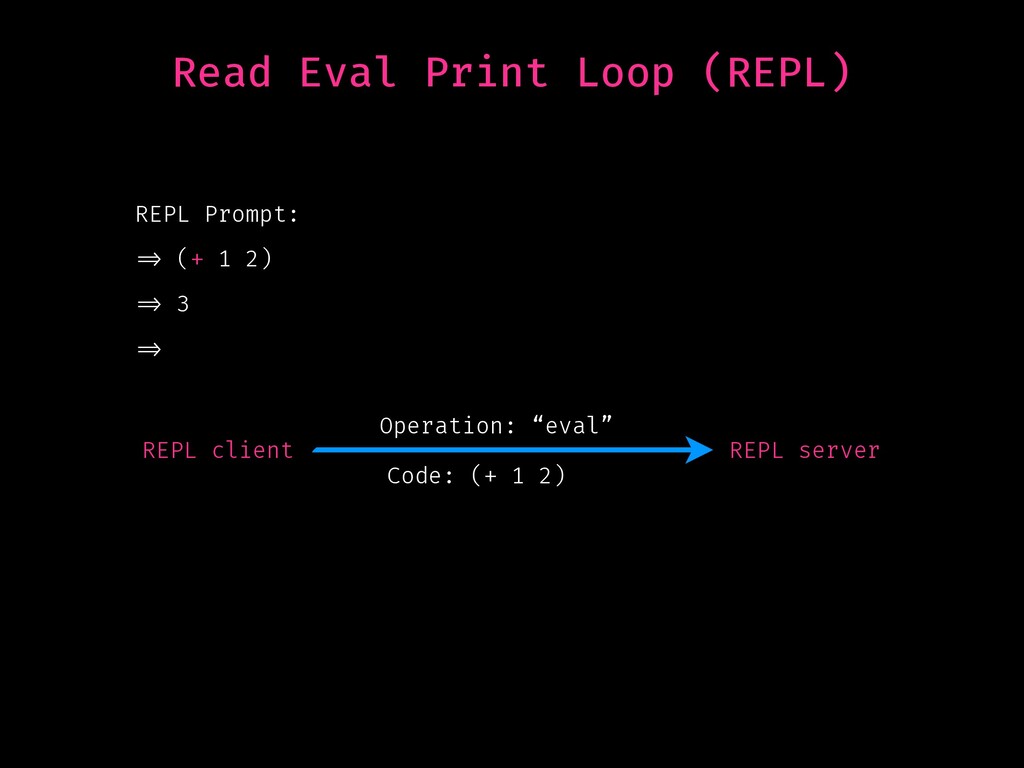
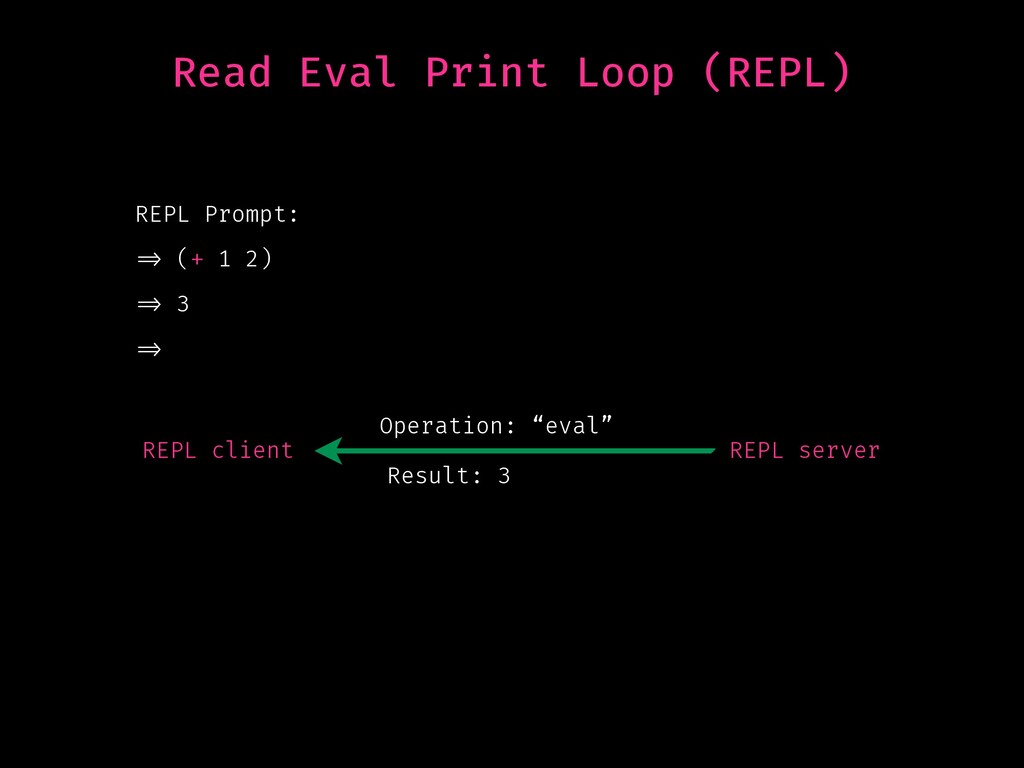
![What is a REPL? Read-Eval-Print-Loop (defn repl [] (let [input](https://files.speakerdeck.com/presentations/1812ddfdb2914e66ba2d4eb109950571/slide_8.jpg)
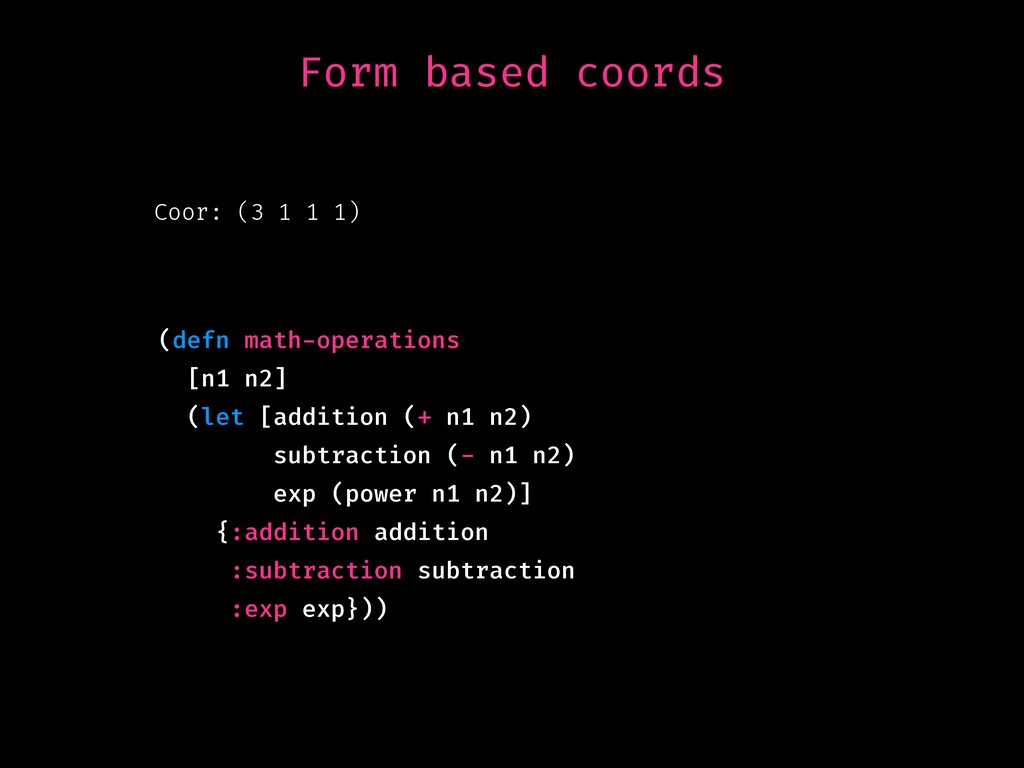
![Coor: (3 1 1 1) (defn math-operations [n1 n2] (let](https://files.speakerdeck.com/presentations/1812ddfdb2914e66ba2d4eb109950571/slide_15.jpg)
![Coor: (3 1 1 1) (defn math-operations [n1 n2] (let](https://files.speakerdeck.com/presentations/1812ddfdb2914e66ba2d4eb109950571/slide_16.jpg)
![Coor: (3 1 1 1) (defn math-operations [n1 n2] (let](https://files.speakerdeck.com/presentations/1812ddfdb2914e66ba2d4eb109950571/slide_17.jpg)
![Coor: (3 1 1 1) (defn math-operations [n1 n2] (let](https://files.speakerdeck.com/presentations/1812ddfdb2914e66ba2d4eb109950571/slide_18.jpg)