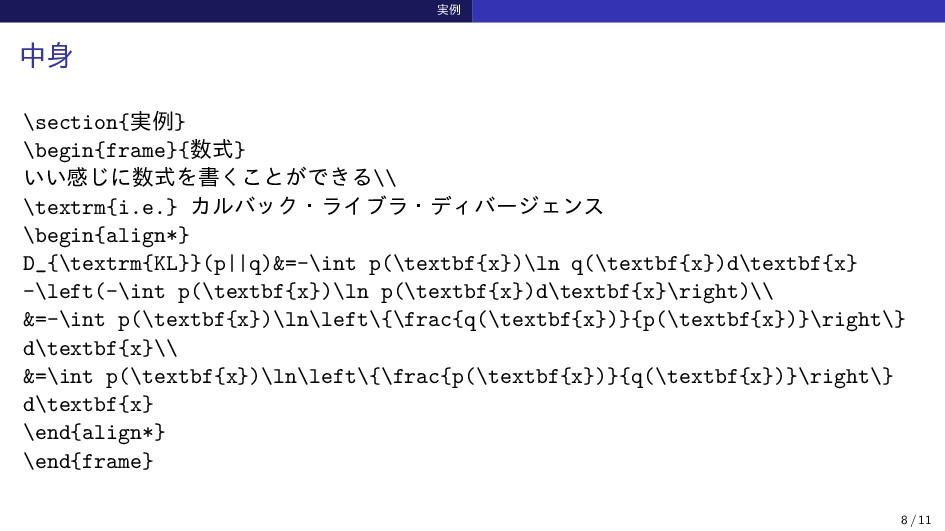
(-5, 0) -- (5, 0) node[above]{$x$}; \draw[->, >=stealth, very thick] (0, -1.5) -- (0, 2.5) node[right]{$y$}; \draw (0,0)node[below right]{$O$}; \draw[samples=100,domain=-5:5,thick,red] plot(\x, {1/(1+exp(-(\x)))}) node[below]{$\varsigma(x)$}; \draw[samples=100,domain=-5:5,thick,green] plot(\x,{(exp(\x)-exp(-\x))/(exp(\x)+exp(-\x))})node[above]{$\tanh x$}; \draw[samples=100,domain=-5:2.5,thick,blue] plot(\x, {\x>0 ? \x : 0}) node[right]{$\textrm{ReLU}$}; \end{tikzpicture} \caption{ओͳ׆ੑԽؔ}\end{figure}\end{frame} 10 / 11
![࣮ྫ த \begin{frame}{άϥϑ} ࣜͱಉ༷ʹάϥϑΛॻ͘͜ͱͰ͖Δ \begin{figure}[htbp]\centering \begin{tikzpicture} \draw[->, >=stealth, very thick]](https://files.speakerdeck.com/presentations/d5c4f6369a764b25b15817dd9850eb3f/slide_9.jpg)