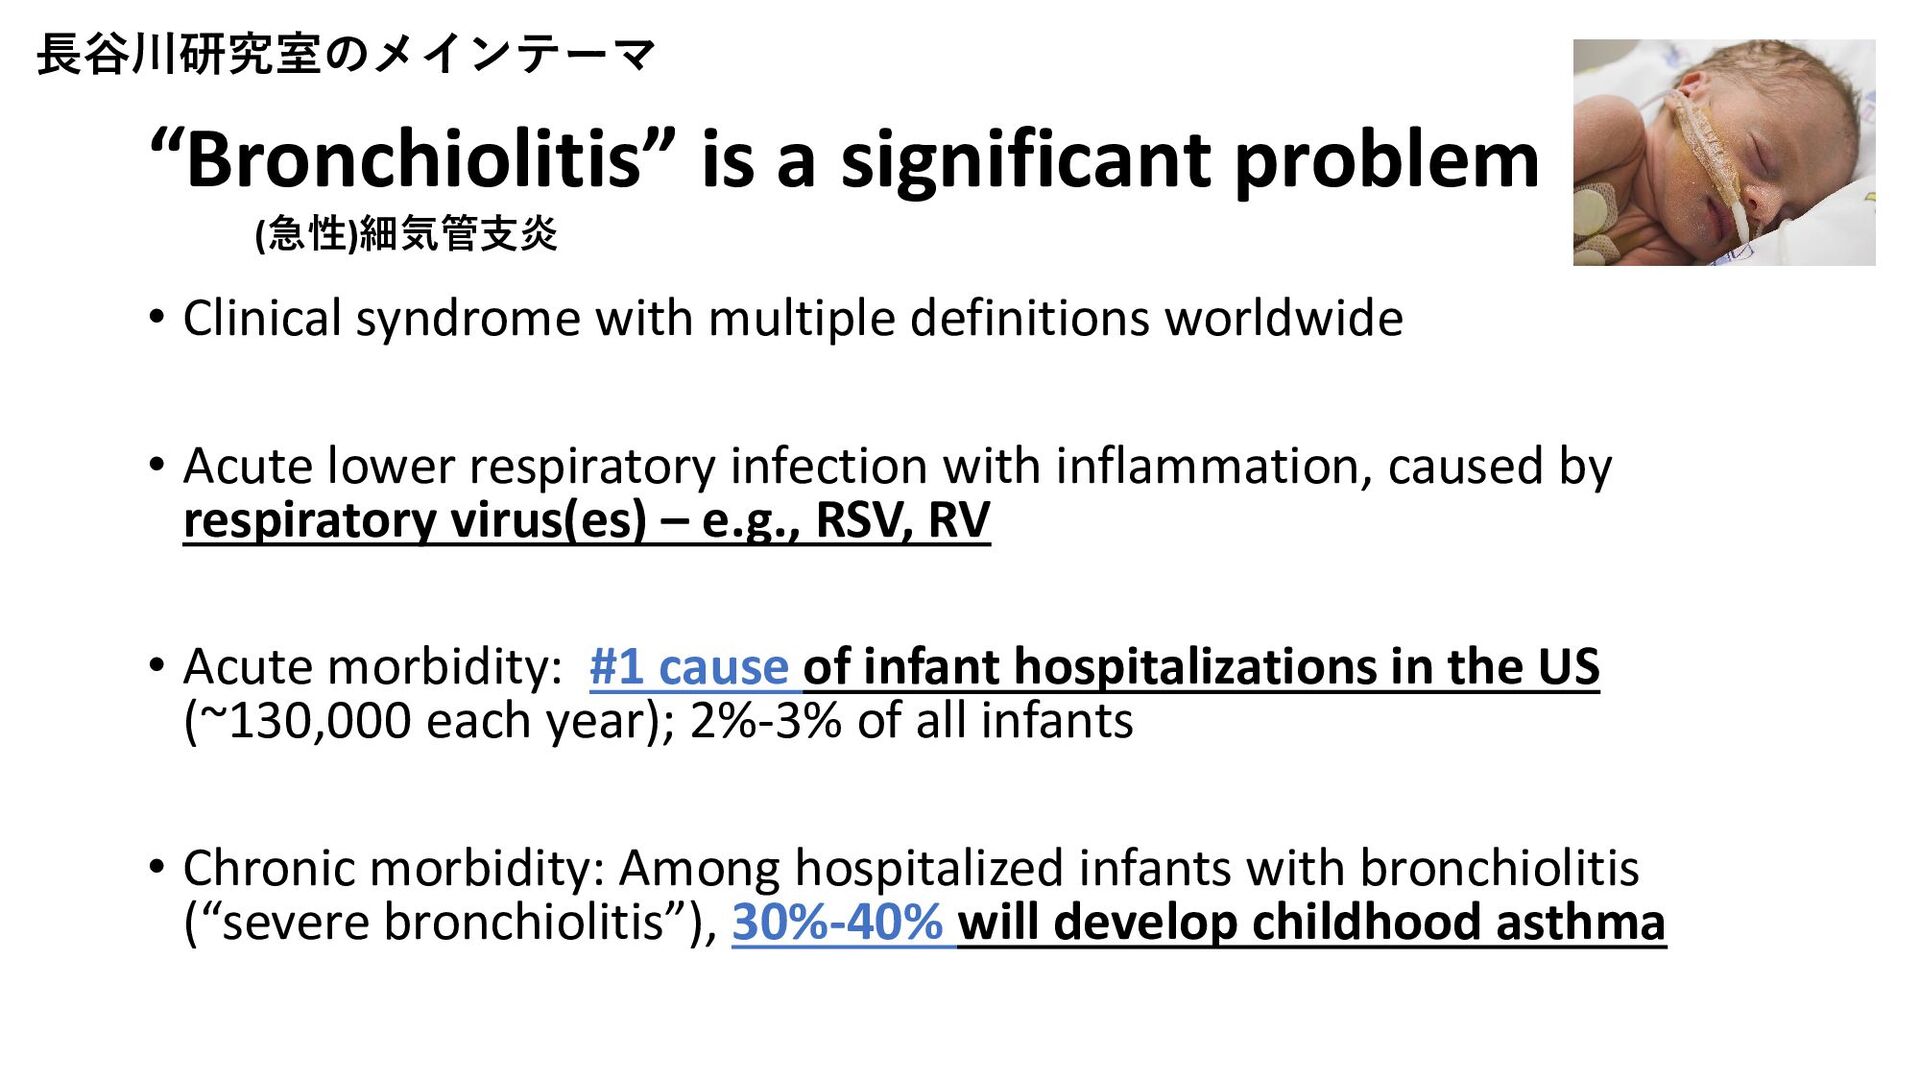
definitions worldwide • Acute lower respiratory infection with inflammation, caused by respiratory virus(es) – e.g., RSV, RV • Acute morbidity: #1 cause of infant hospitalizations in the US (~130,000 each year); 2%-3% of all infants • Chronic morbidity: Among hospitalized infants with bronchiolitis (“severe bronchiolitis”), 30%-40% will develop childhood asthma 長谷川研究室のメインテーマ (急性)細気管支炎
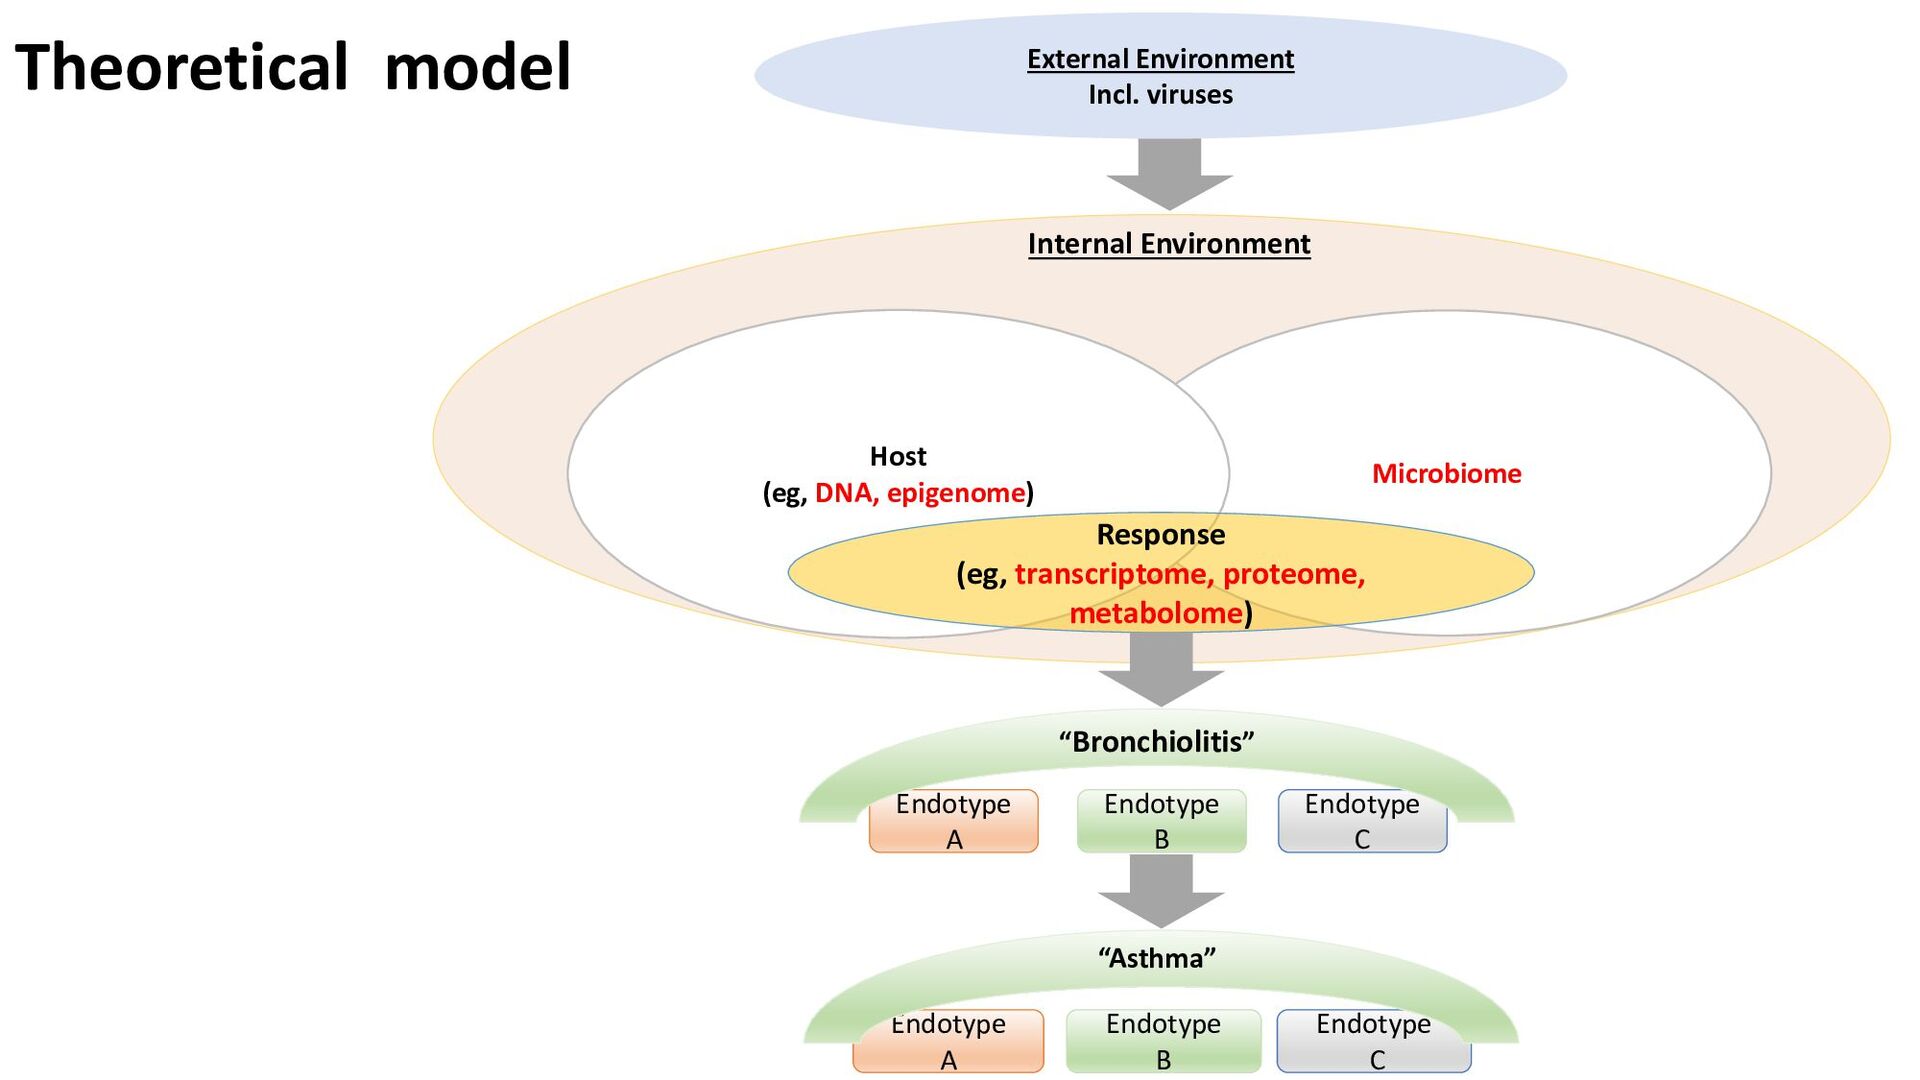
Endotype A Endotype B Endotype C “Bronchiolitis” Endotype A Endotype B Endotype C “Asthma” Internal Environment External Environment Incl. viruses Theoretical model
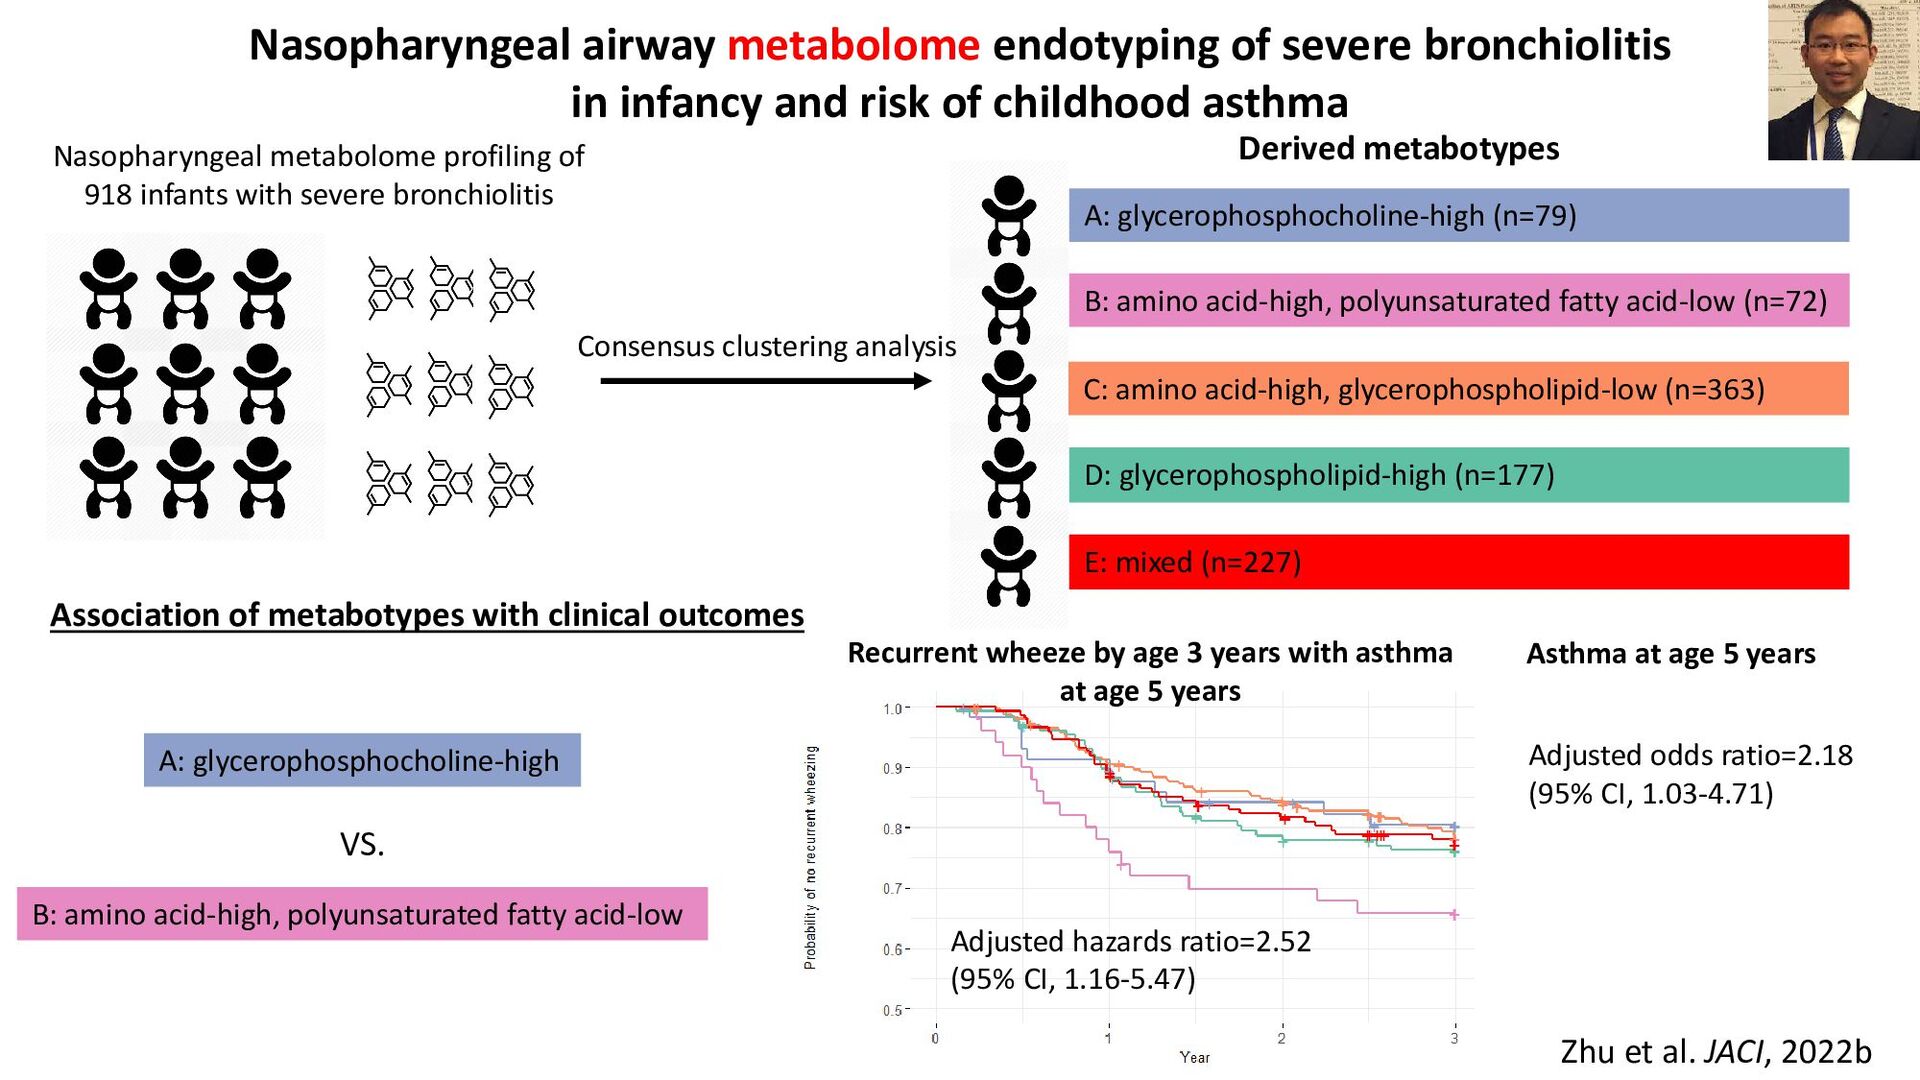
clustering analysis A: glycerophosphocholine-high (n=79) B: amino acid-high, polyunsaturated fatty acid-low (n=72) C: amino acid-high, glycerophospholipid-low (n=363) D: glycerophospholipid-high (n=177) E: mixed (n=227) Derived metabotypes Nasopharyngeal airway metabolome endotyping of severe bronchiolitis in infancy and risk of childhood asthma Association of metabotypes with clinical outcomes Zhu et al. JACI, 2022b Recurrent wheeze by age 3 years with asthma at age 5 years A: glycerophosphocholine-high B: amino acid-high, polyunsaturated fatty acid-low VS. Asthma at age 5 years Adjusted odds ratio=2.18 (95% CI, 1.03-4.71) Adjusted hazards ratio=2.52 (95% CI, 1.16-5.47)
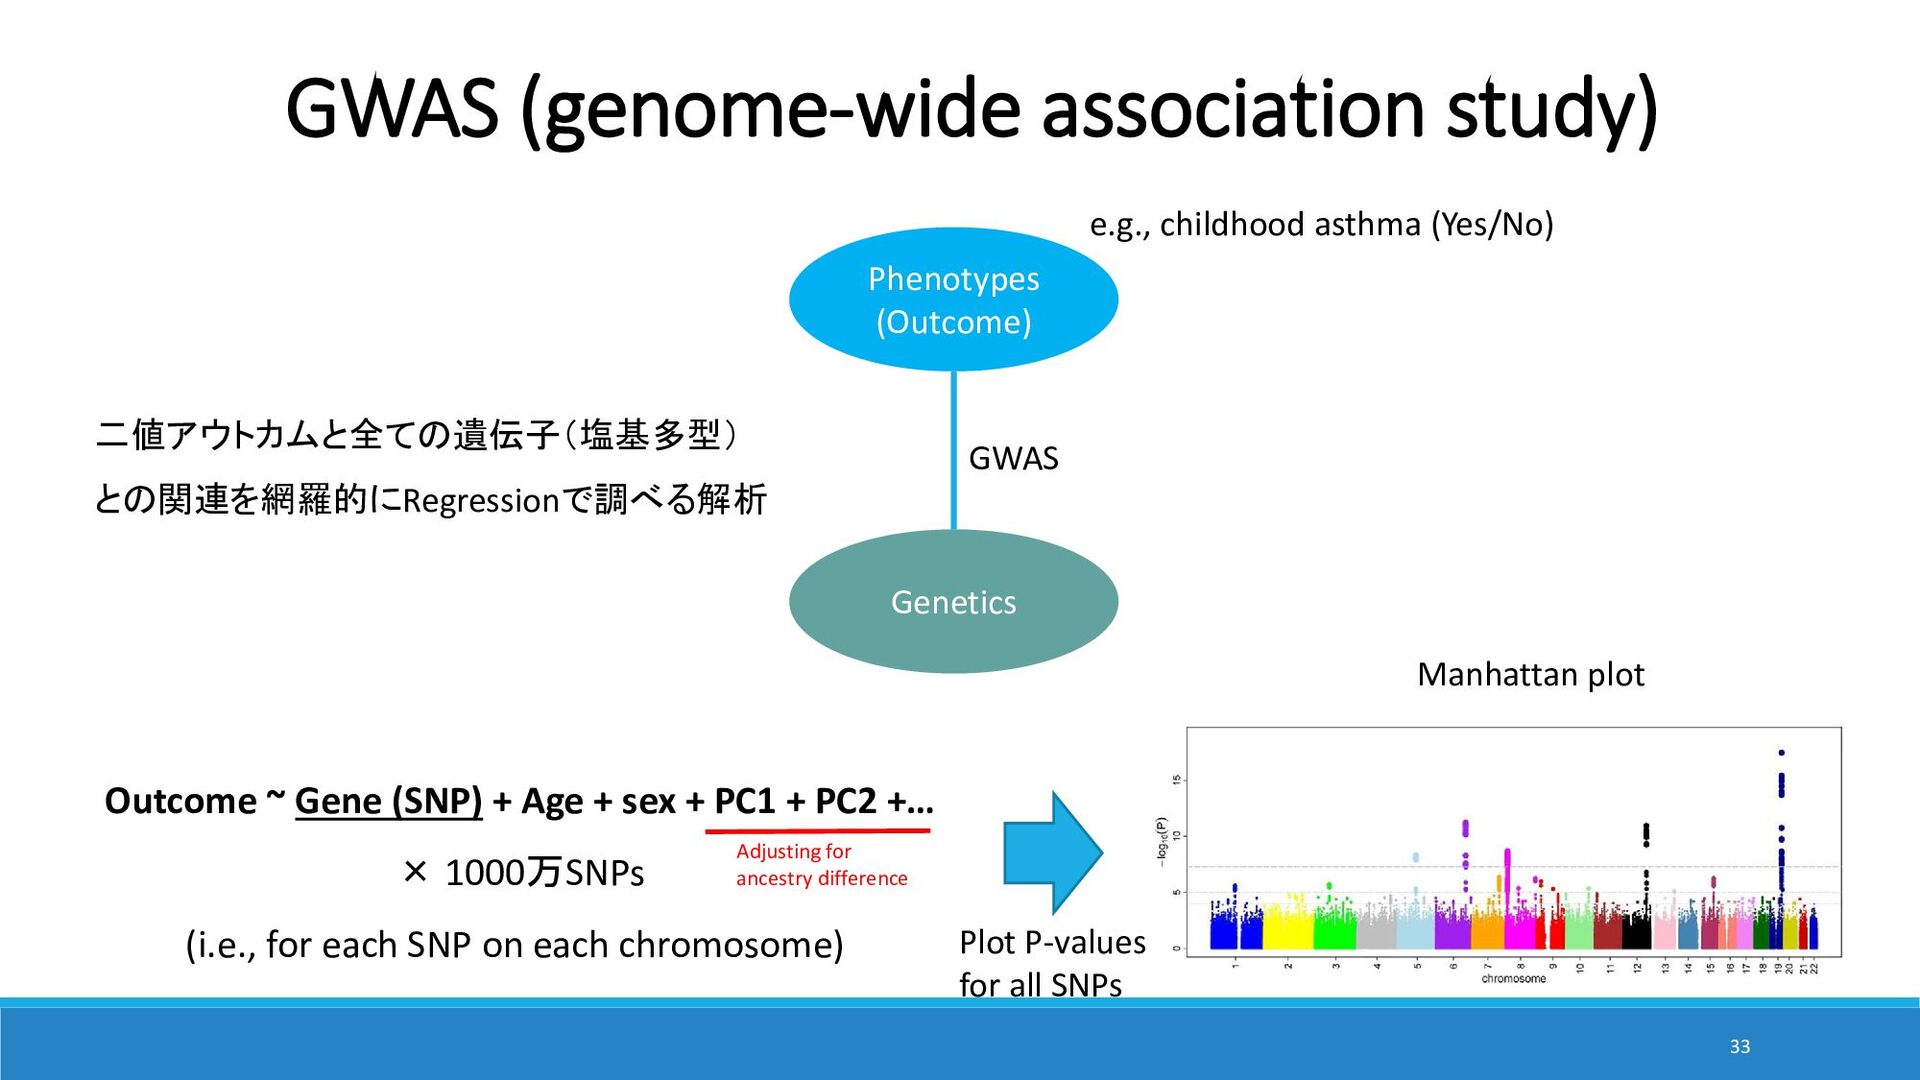
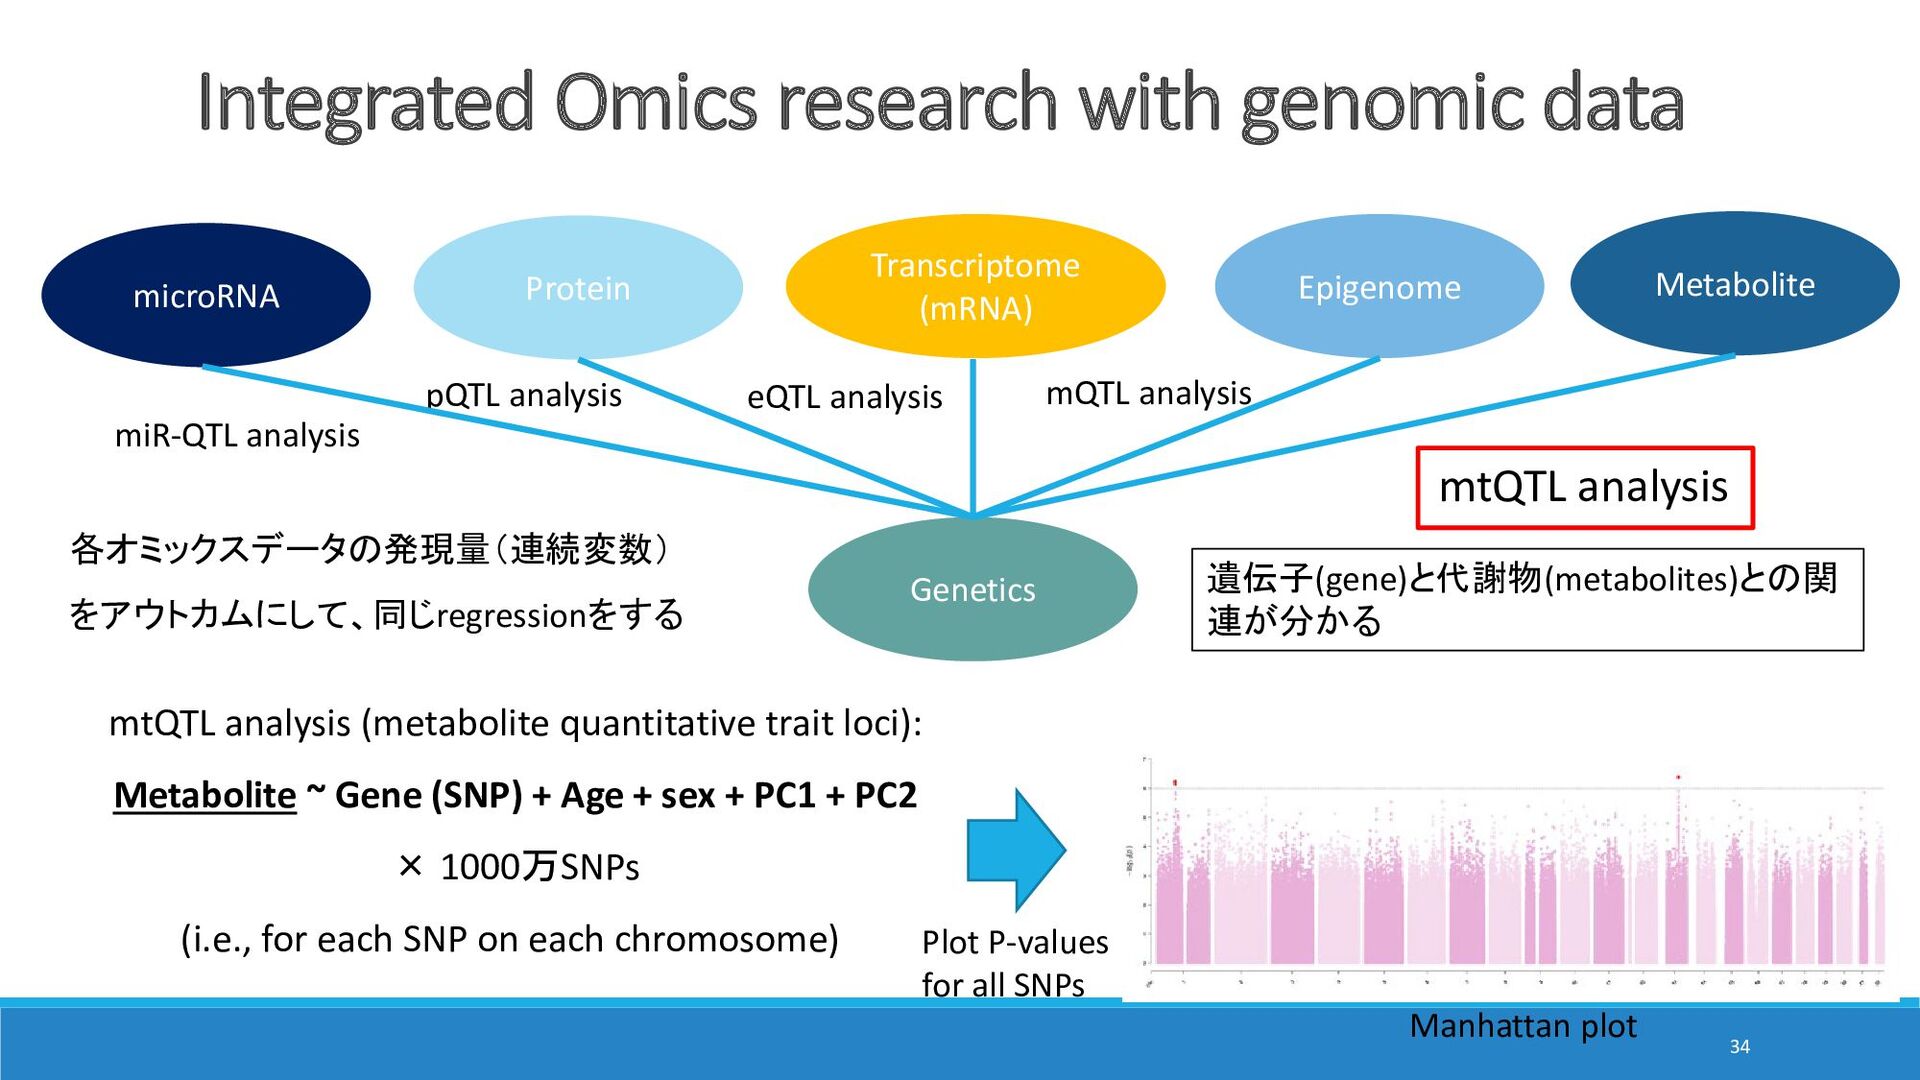
Age + sex + PC1 + PC2 +… × 1000万SNPs (i.e., for each SNP on each chromosome) e.g., childhood asthma (Yes/No) Plot P-values for all SNPs Adjusting for ancestry difference GWAS (genome-wide association study) Manhattan plot 二値アウトカムと全ての遺伝子(塩基多型) との関連を網羅的にRegressionで調べる解析
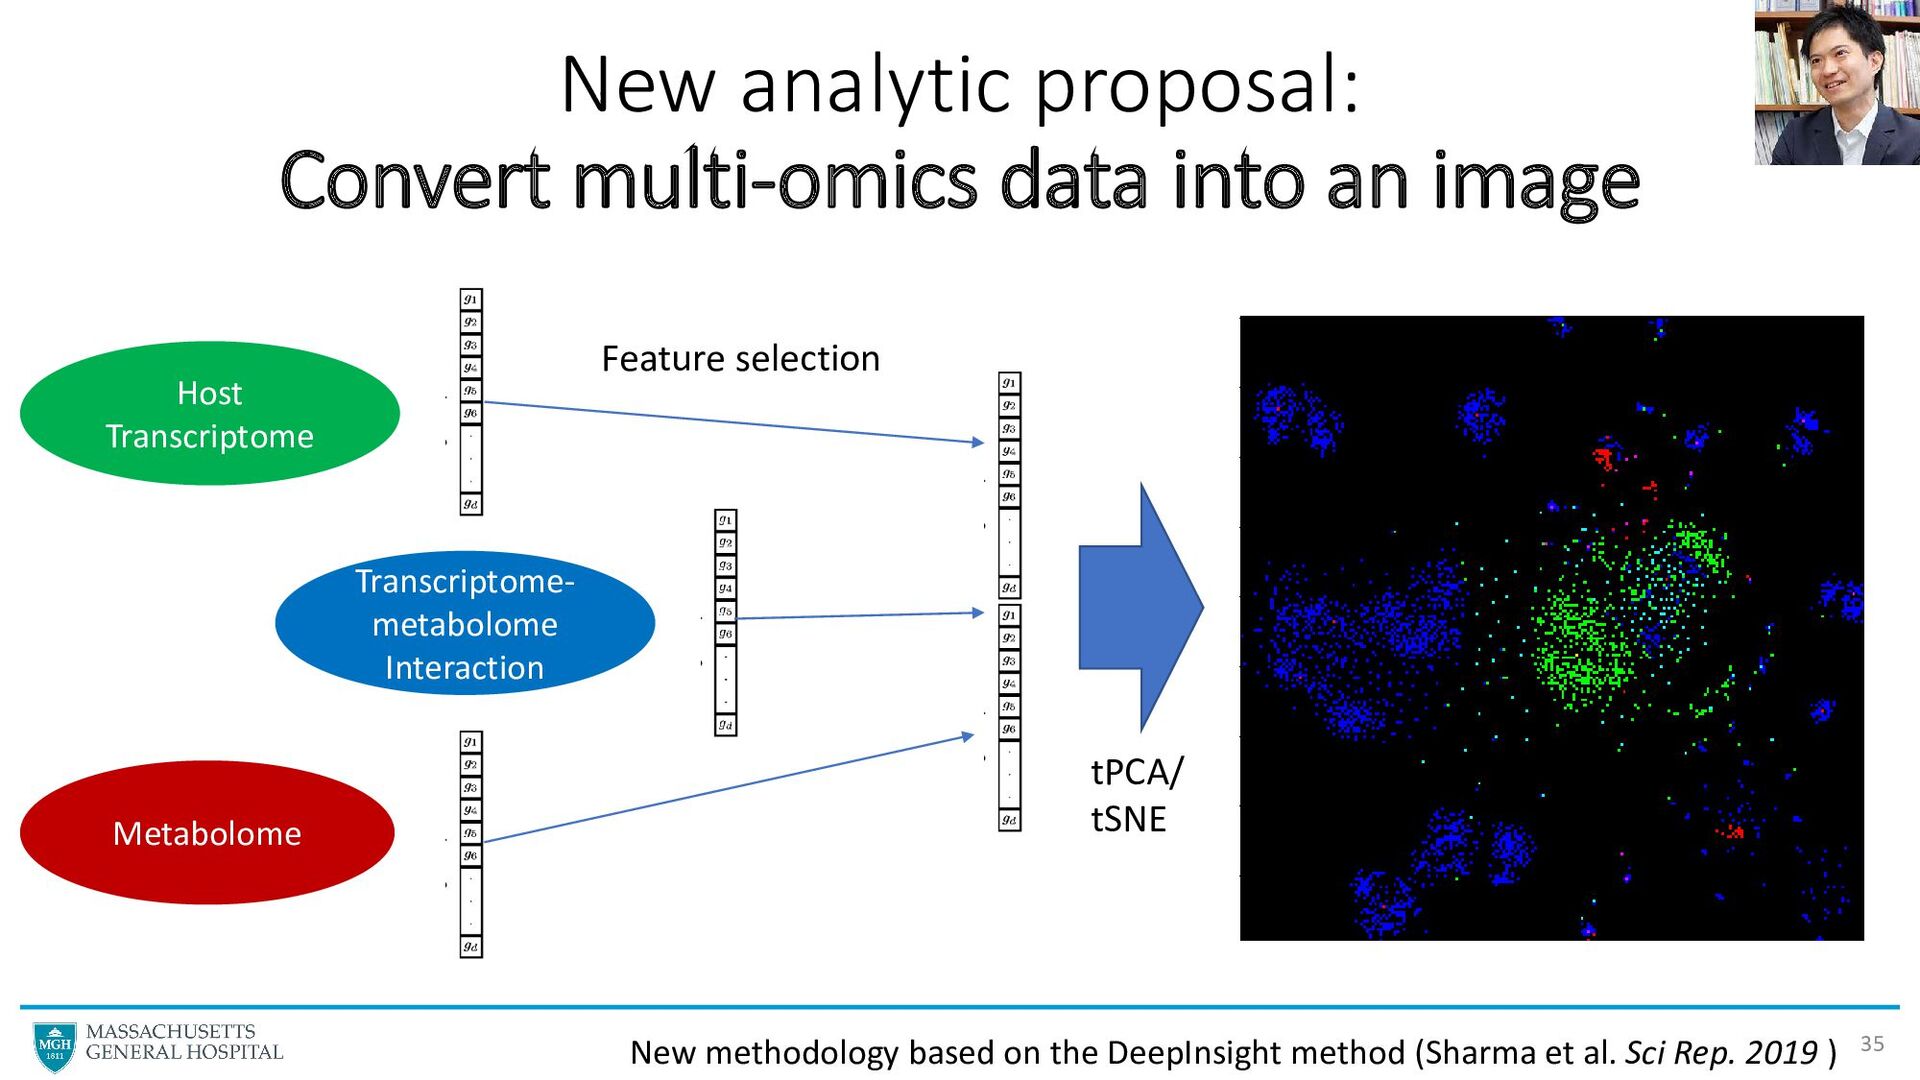
Host Transcriptome Metabolome Transcriptome- metabolome Interaction Feature selection tPCA/ tSNE New methodology based on the DeepInsight method (Sharma et al. Sci Rep. 2019 )
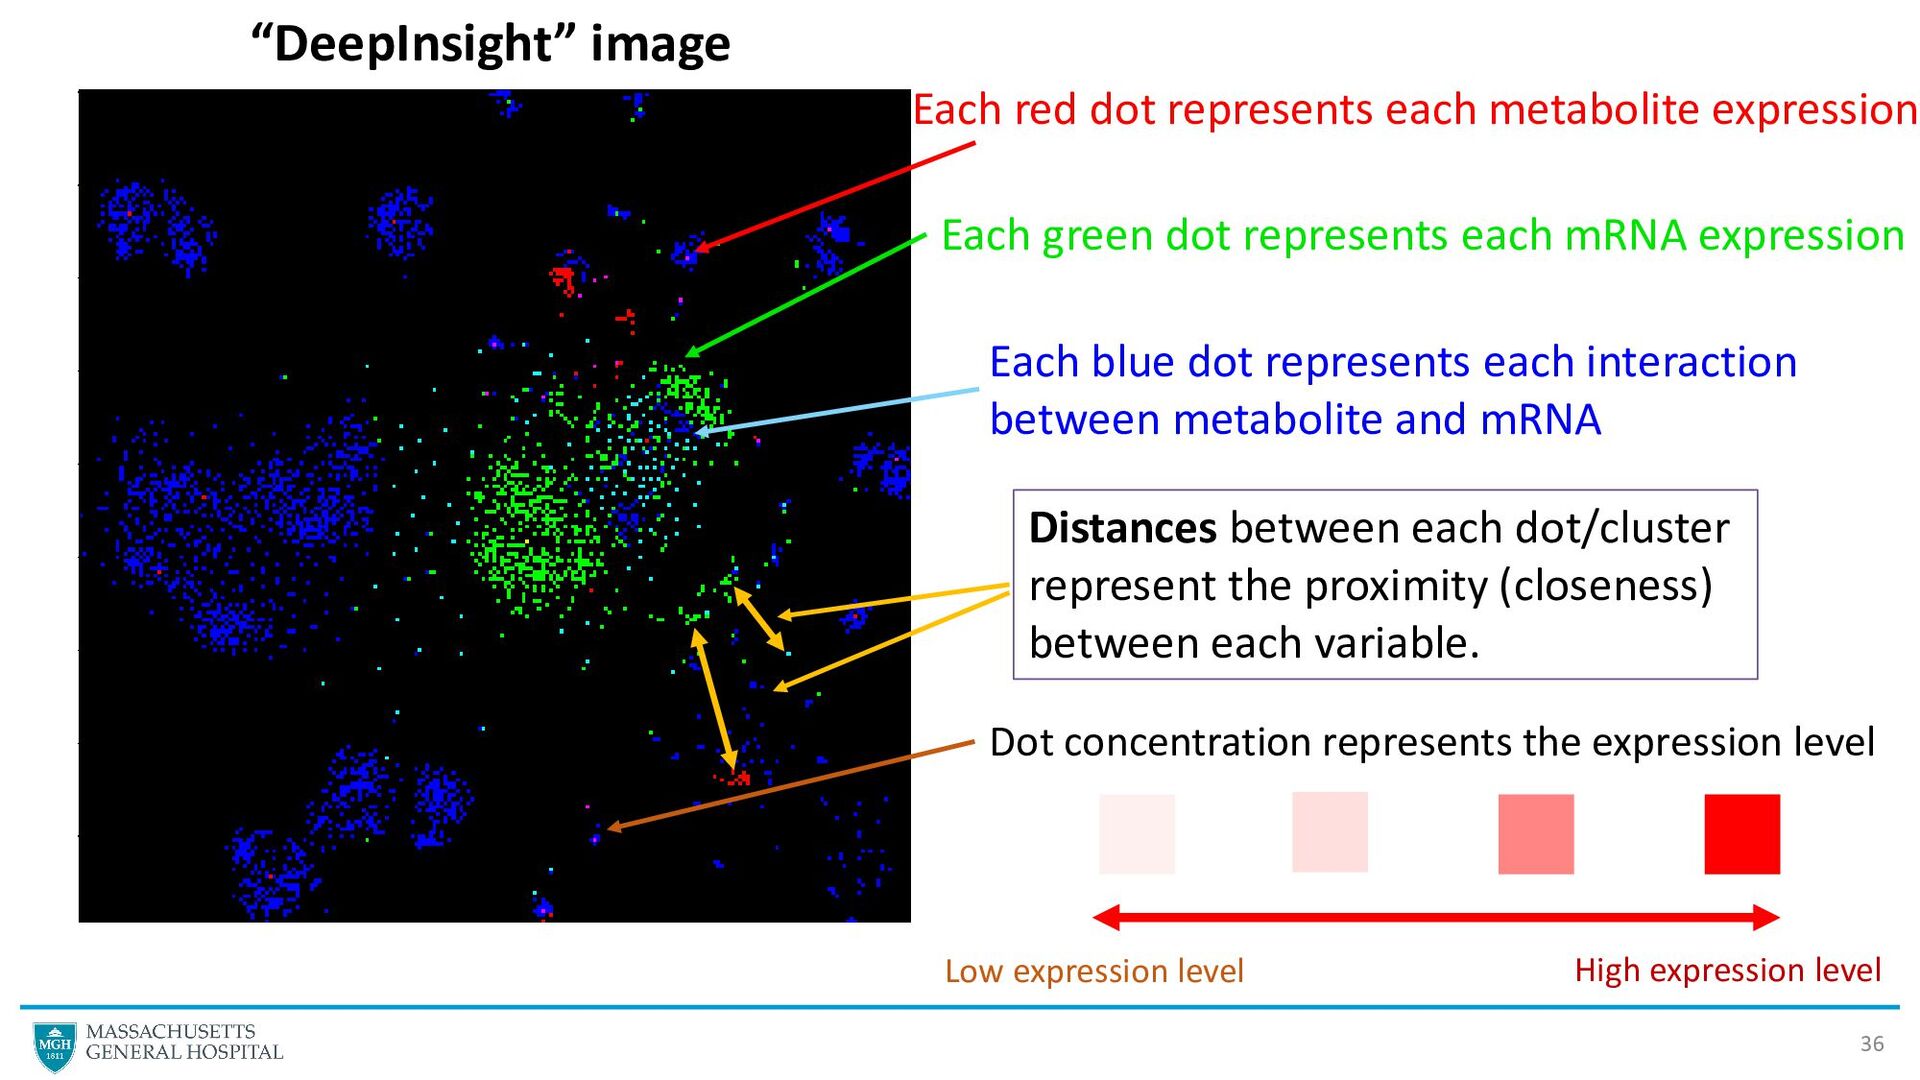
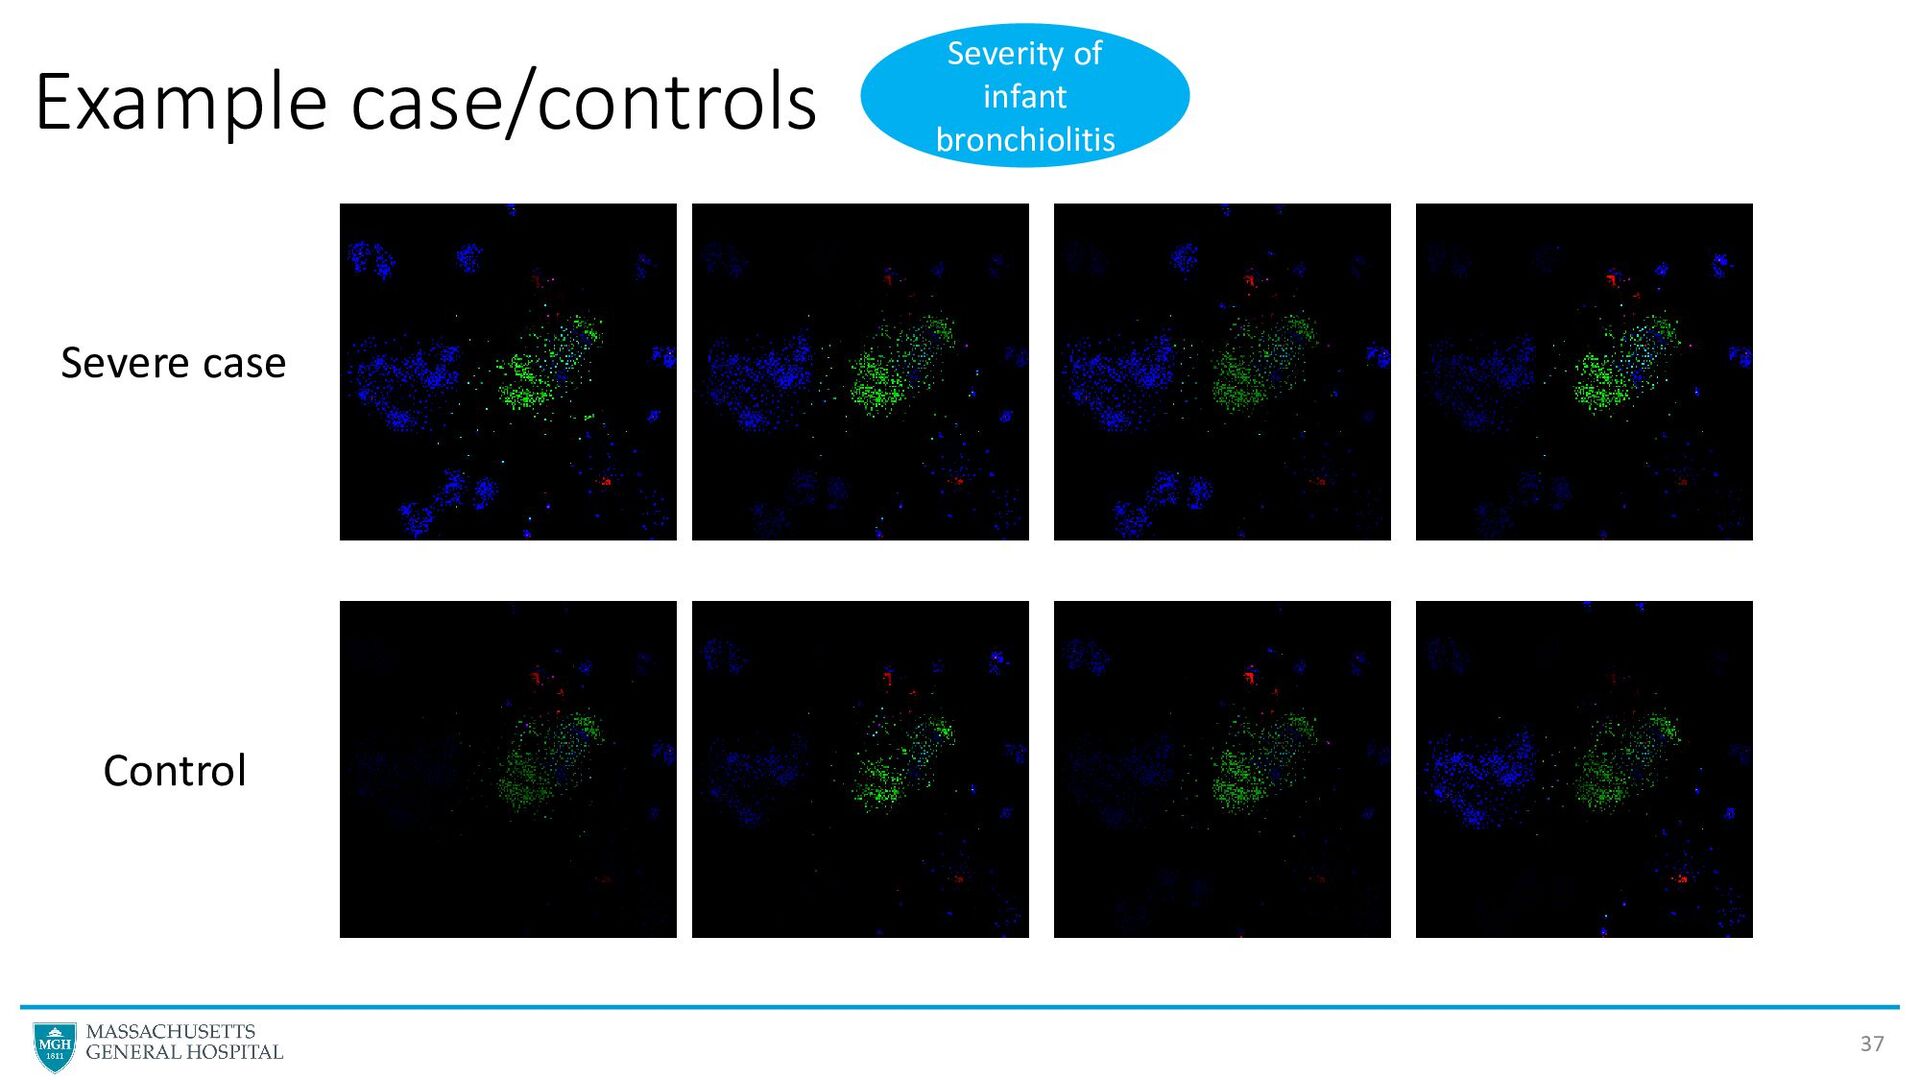
dot represents each mRNA expression Each blue dot represents each interaction between metabolite and mRNA Distances between each dot/cluster represent the proximity (closeness) between each variable. Dot concentration represents the expression level High expression level Low expression level “DeepInsight” image
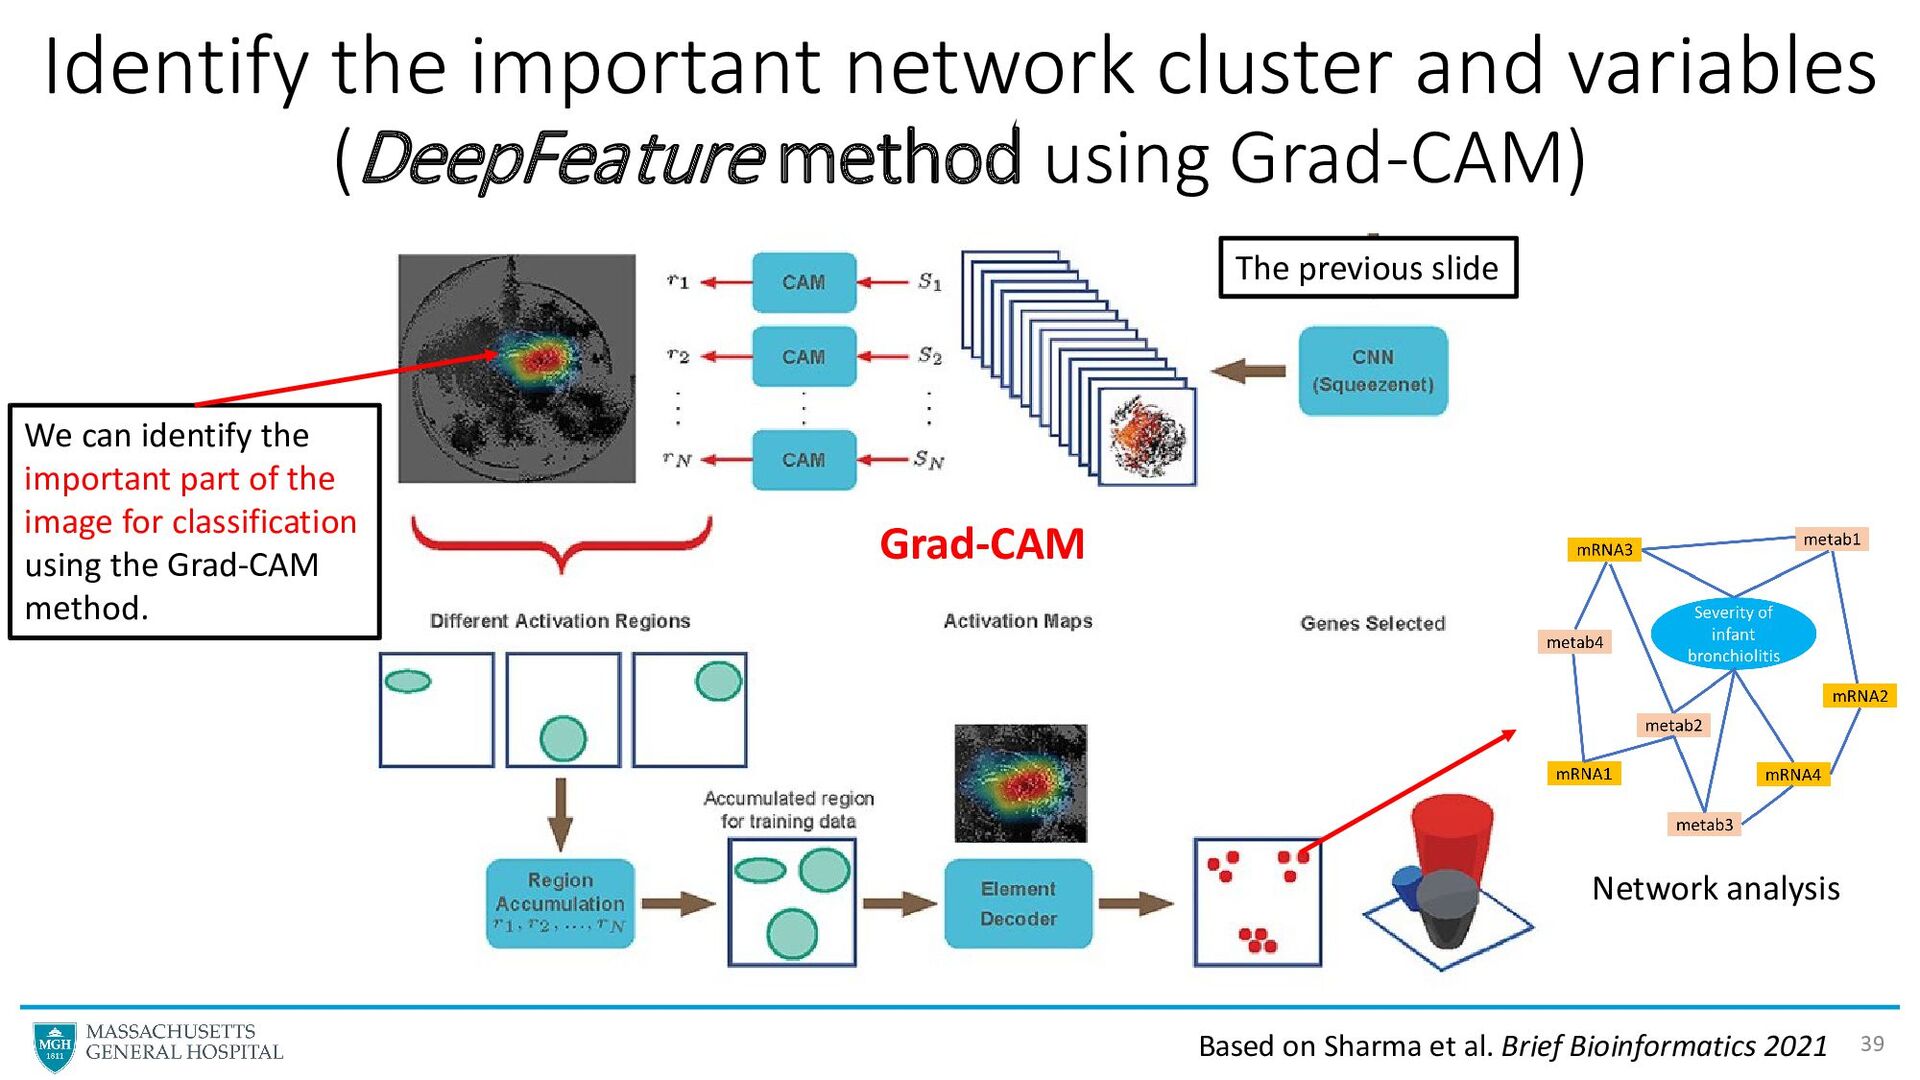
Grad-CAM) 39 The previous slide Based on Sharma et al. Brief Bioinformatics 2021 We can identify the important part of the image for classification using the Grad-CAM method. Grad-CAM Network analysis
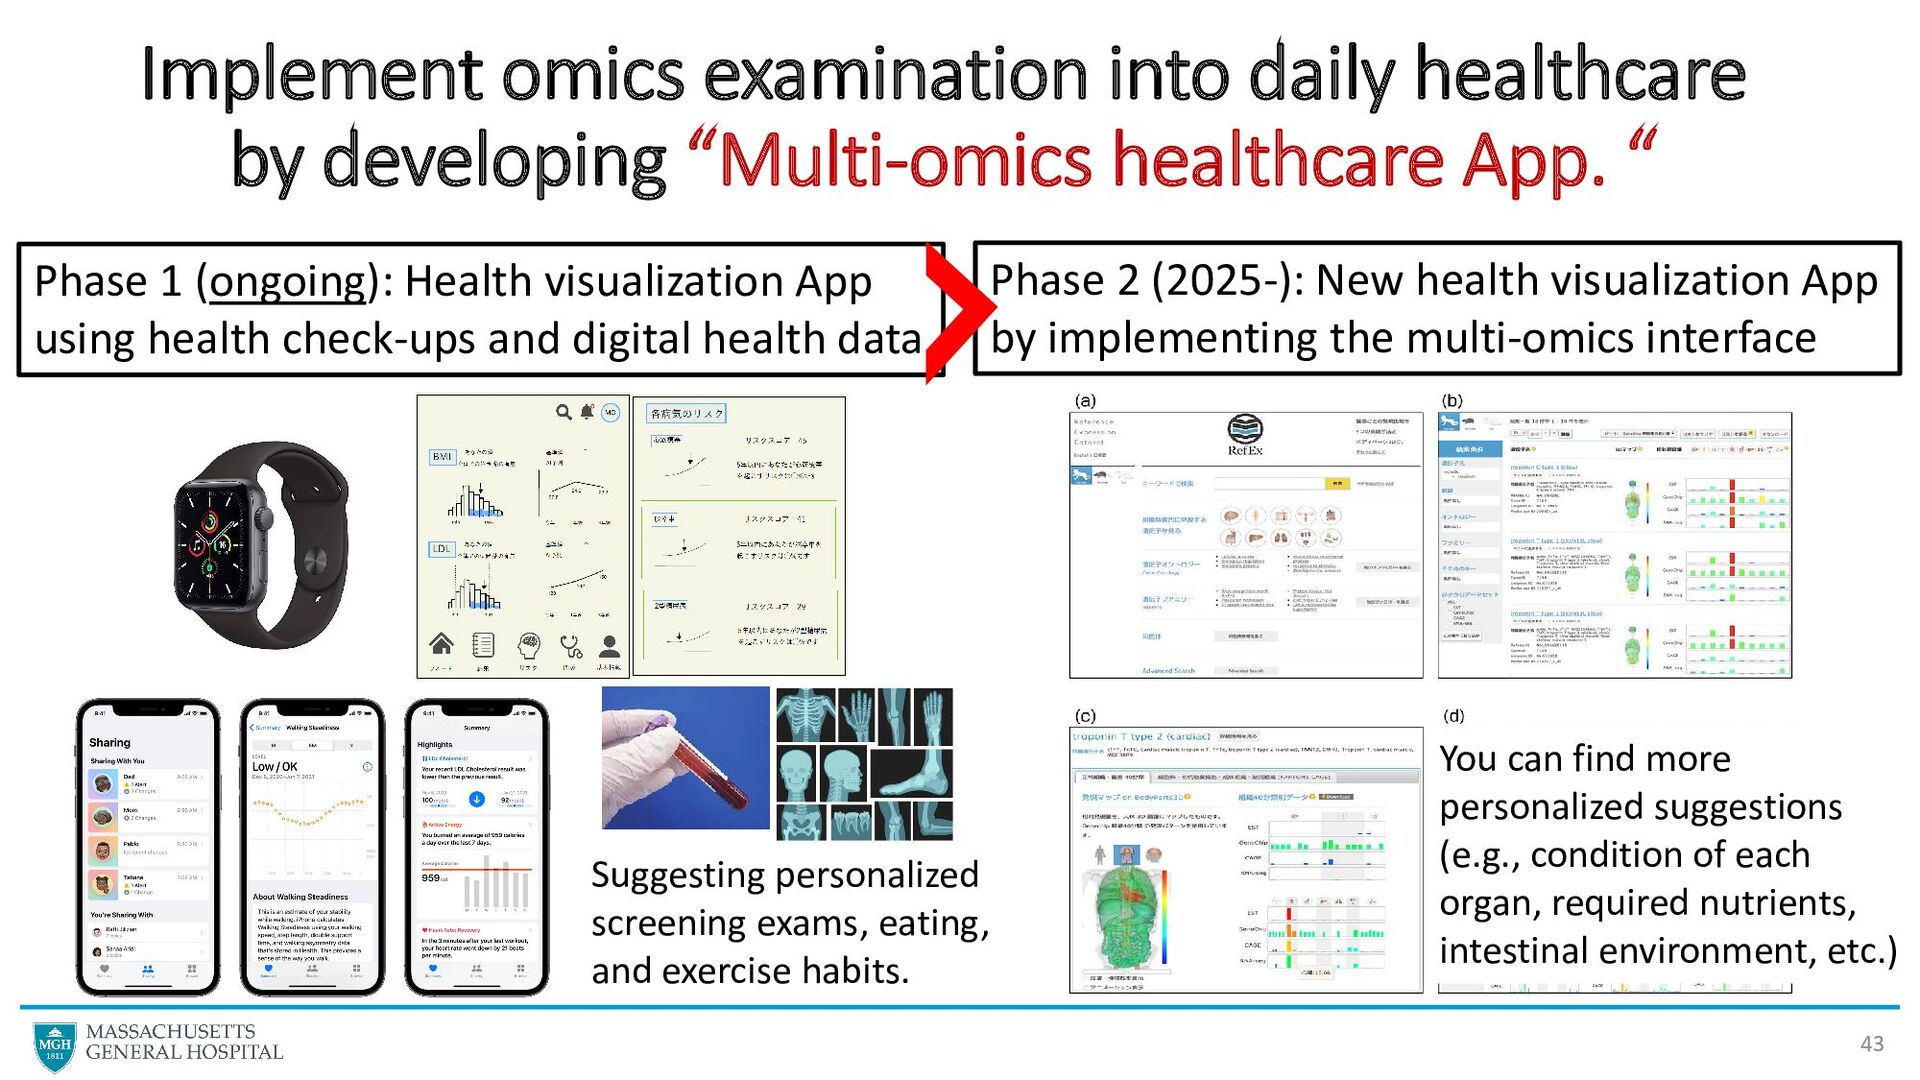
App. “ 43 Phase 1 (ongoing): Health visualization App using health check-ups and digital health data Phase 2 (2025-): New health visualization App by implementing the multi-omics interface Suggesting personalized screening exams, eating, and exercise habits. You can find more personalized suggestions (e.g., condition of each organ, required nutrients, intestinal environment, etc.)
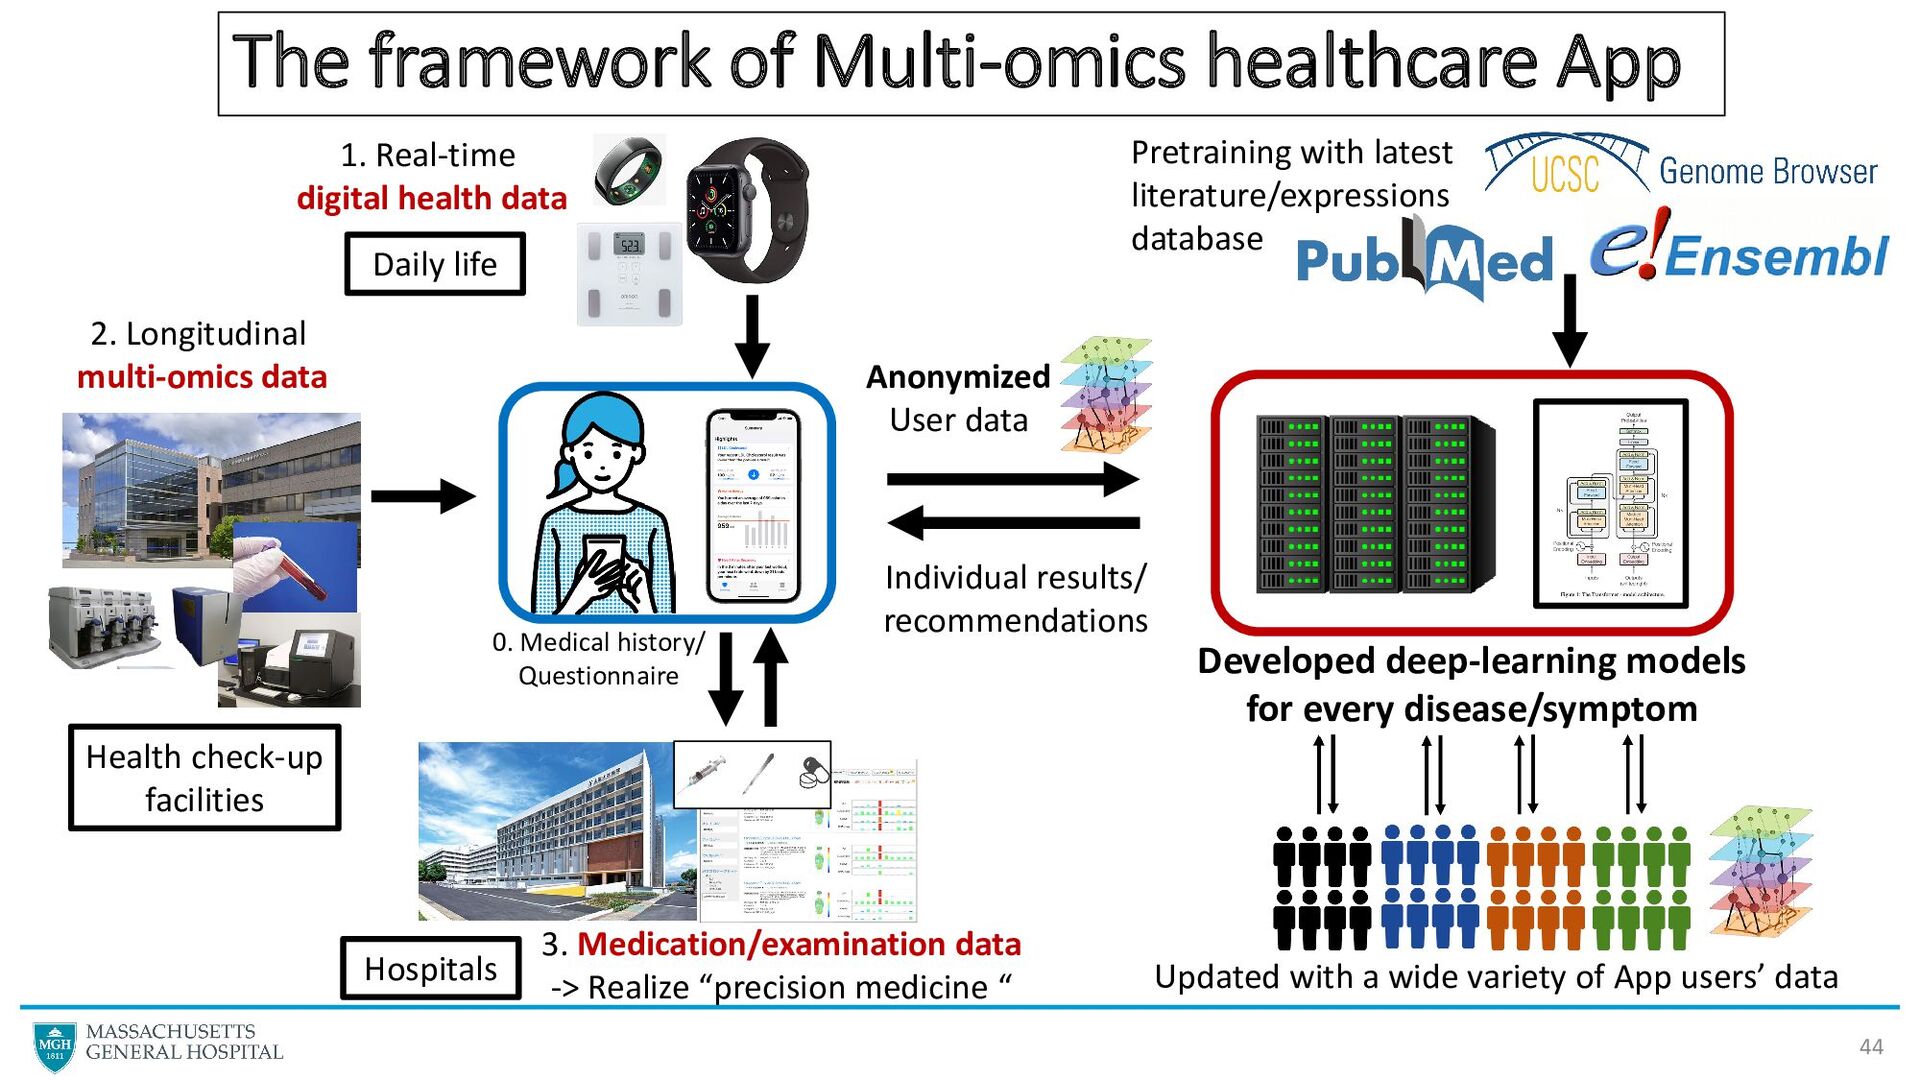
Anonymized User data Developed deep-learning models for every disease/symptom 1. Real-time digital health data 2. Longitudinal multi-omics data 3. Medication/examination data -> Realize “precision medicine “ 0. Medical history/ Questionnaire Health check-up facilities Hospitals Pretraining with latest literature/expressions database Updated with a wide variety of App users’ data Daily life
![Convolutional neural network [CNN] with DeepInsight 38 Severe case Control](https://files.speakerdeck.com/presentations/b956da53c236494197d5c33265ae2bd2/slide_37.jpg)