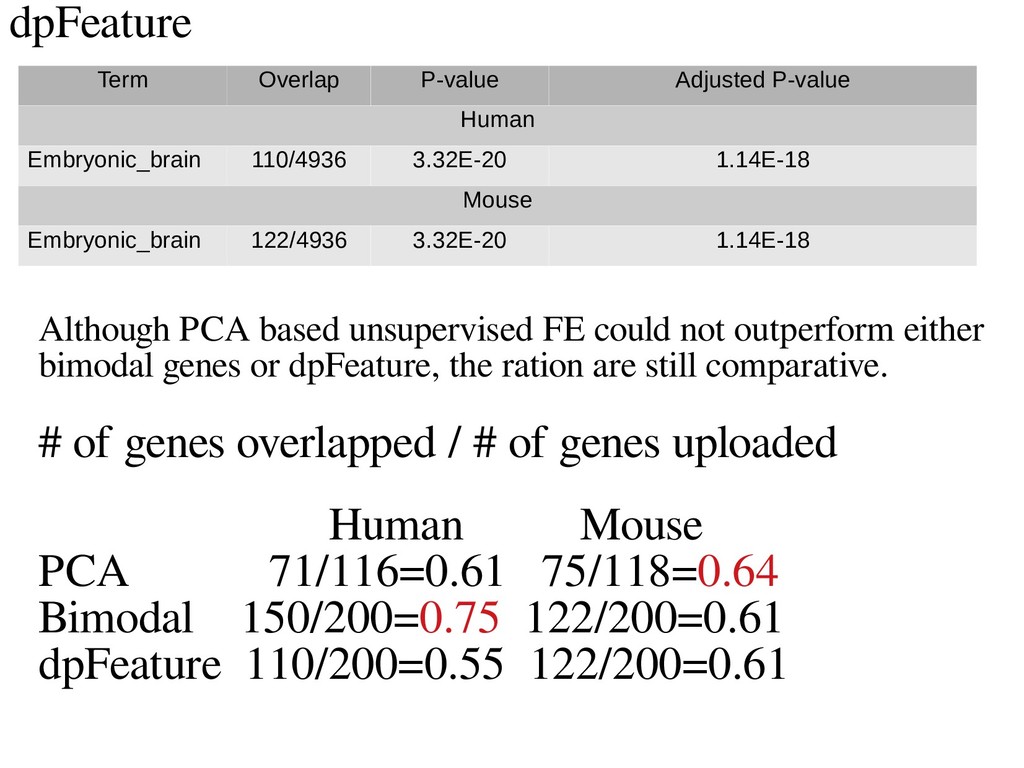
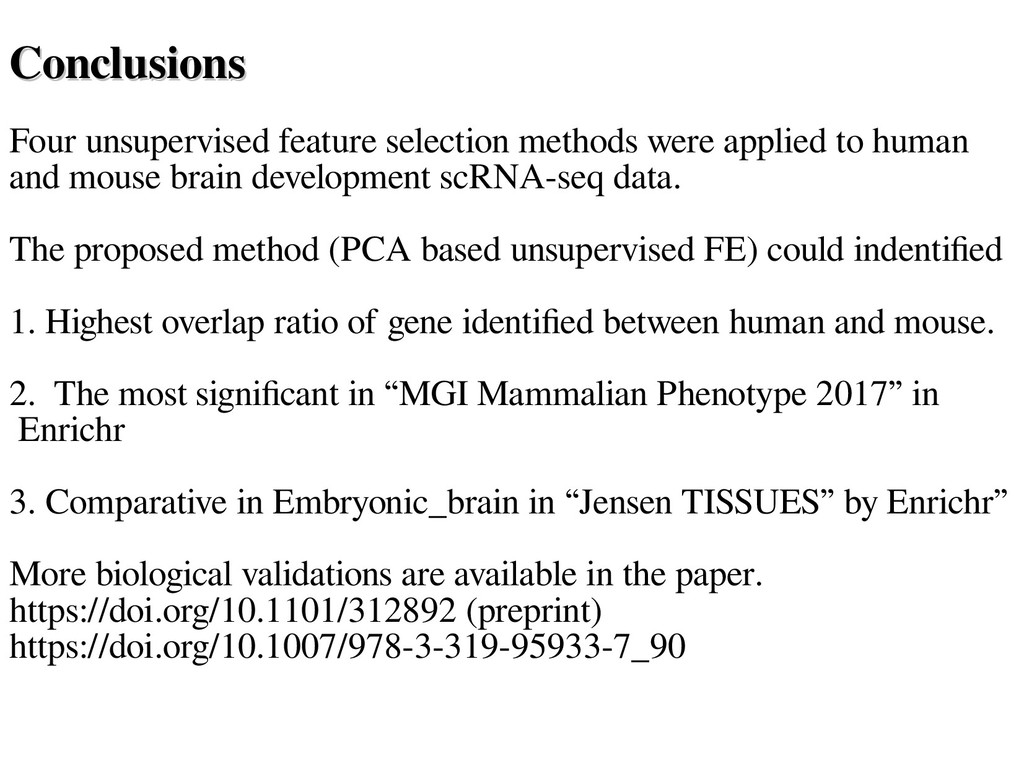
Principal Component Analysis-Based Unsupervised Feature Extraction Applied to Single Cell Gene Expression Analysis
Presentation at ICIC2018
http://ic-ic.tongji.edu.cn/2018/index.htm
papers
https://doi.org/10.1101/312892 (preprint)
https://doi.org/10.1007/978-3-319-95933-7_90