Upgrade to Pro — share decks privately, control downloads, hide ads and more …

Demystifying the neural network black box

Tanuj
March 20, 2019

Demystifying the neural network black box

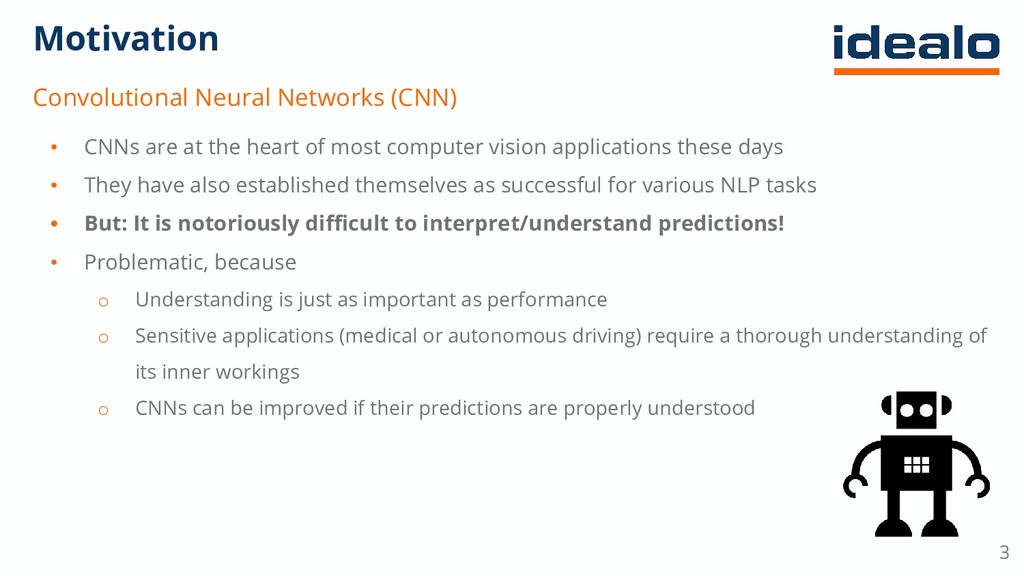
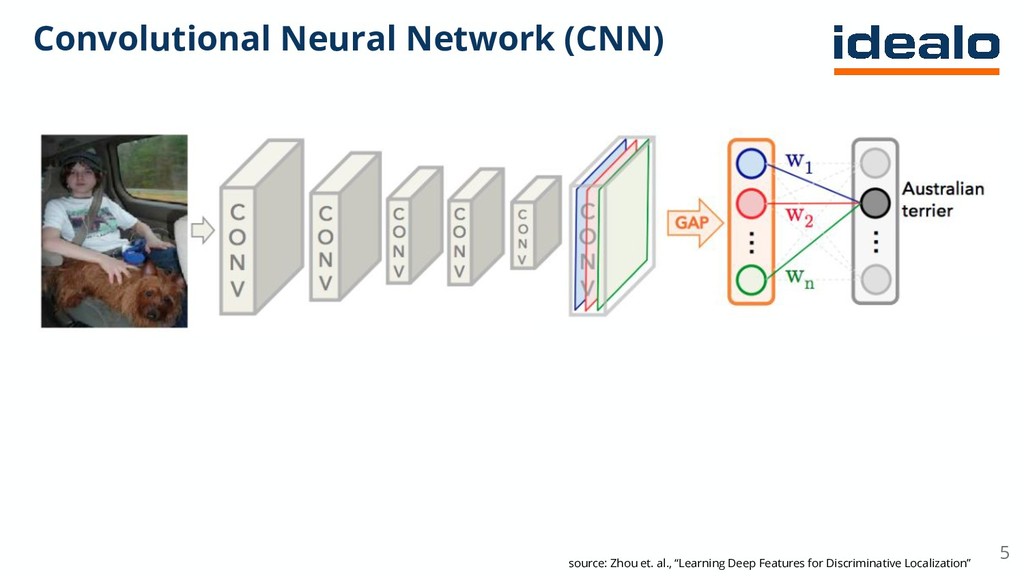
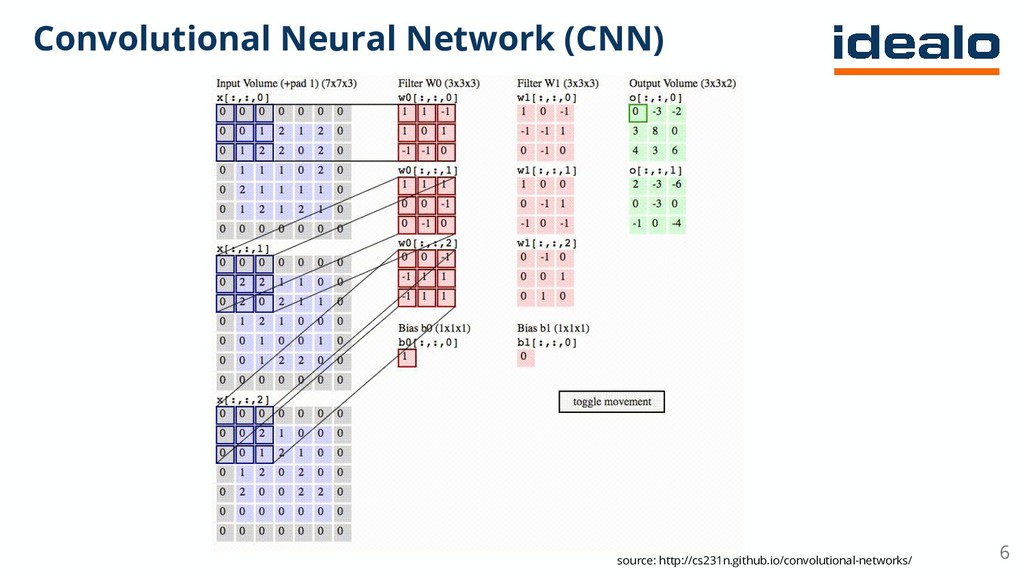
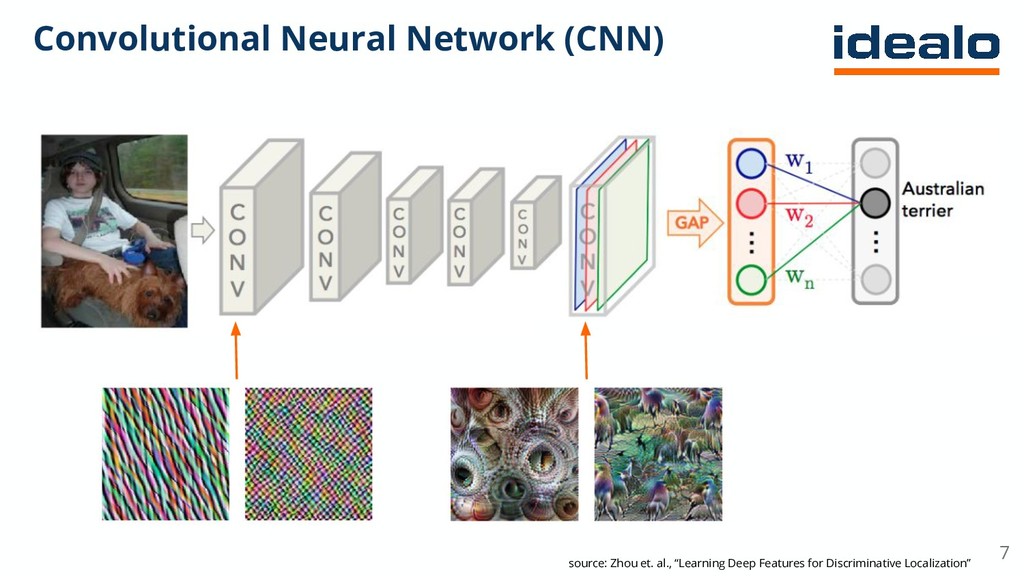
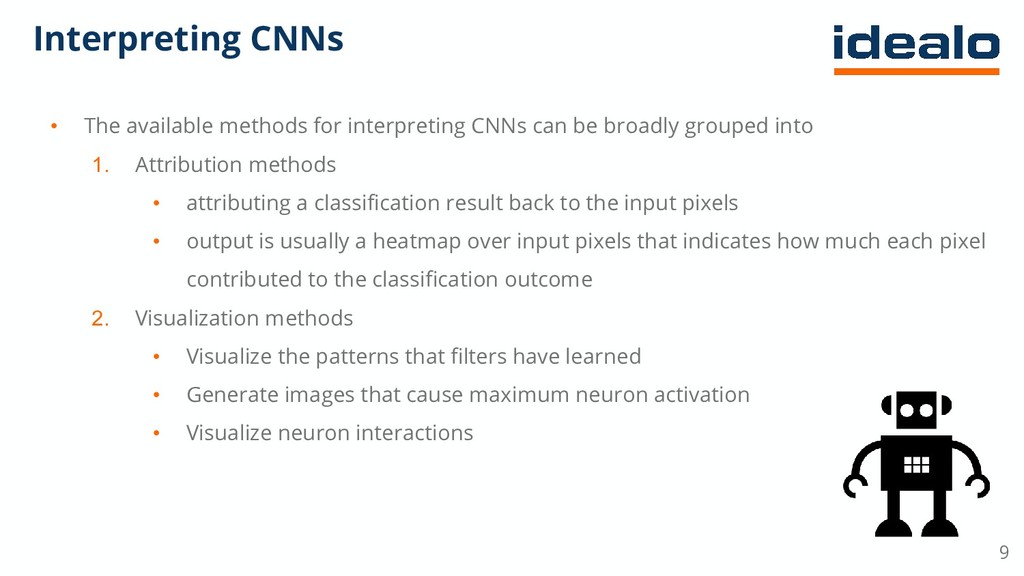
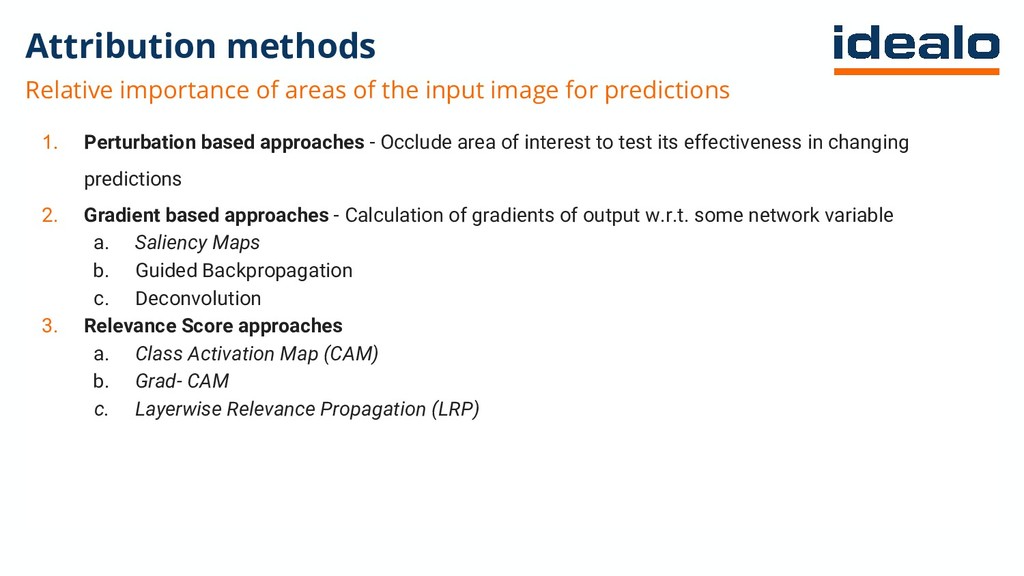
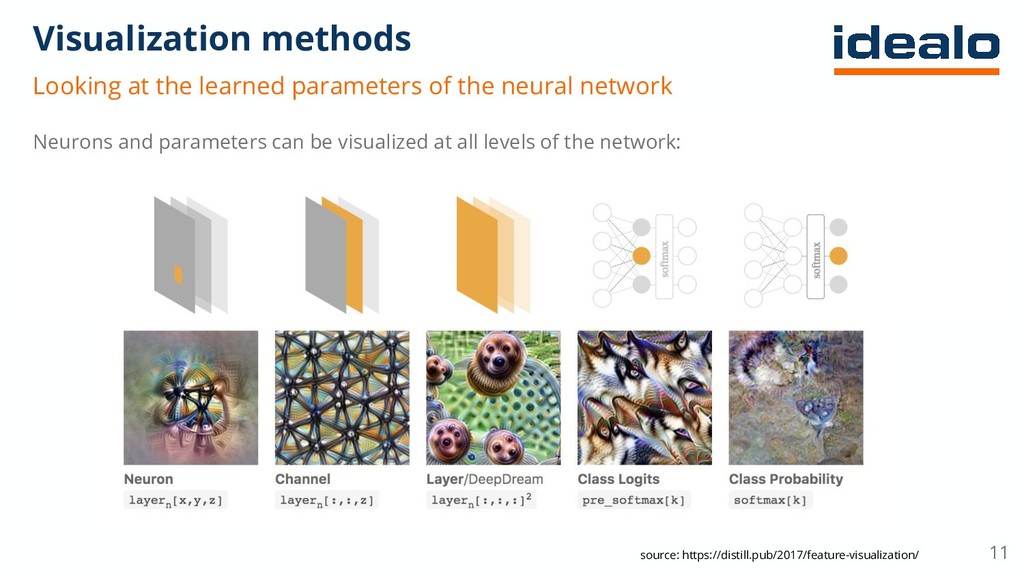
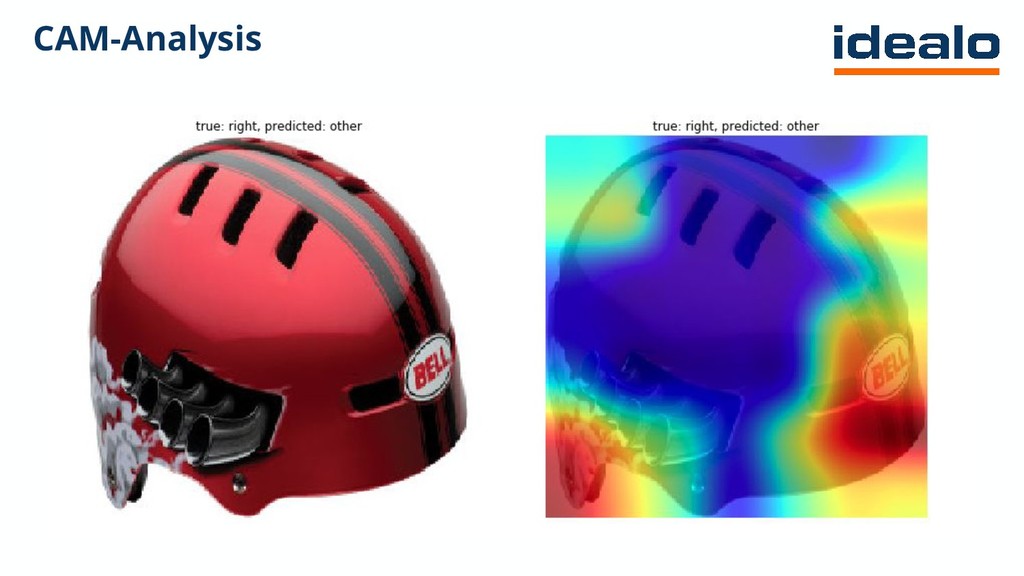
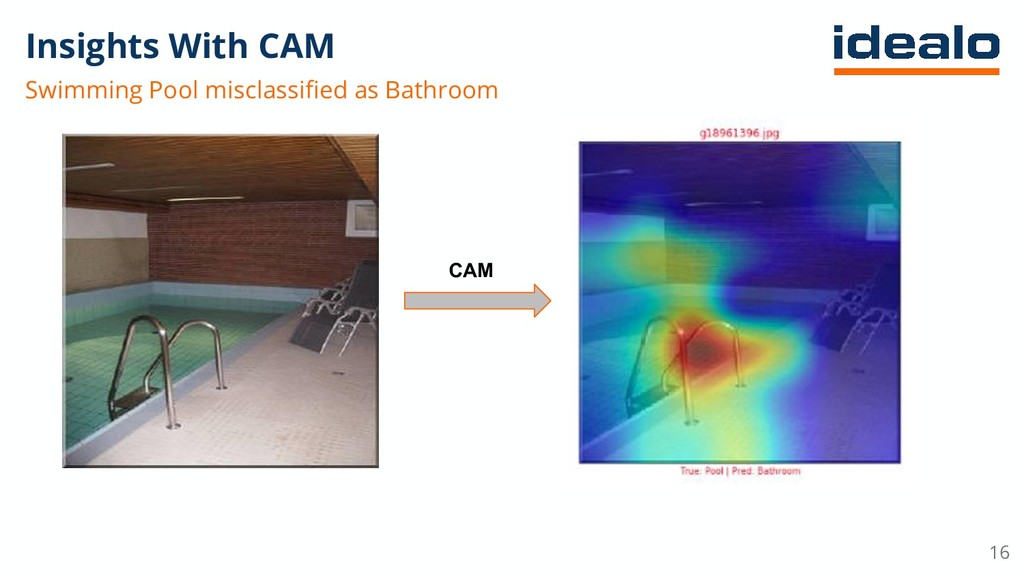
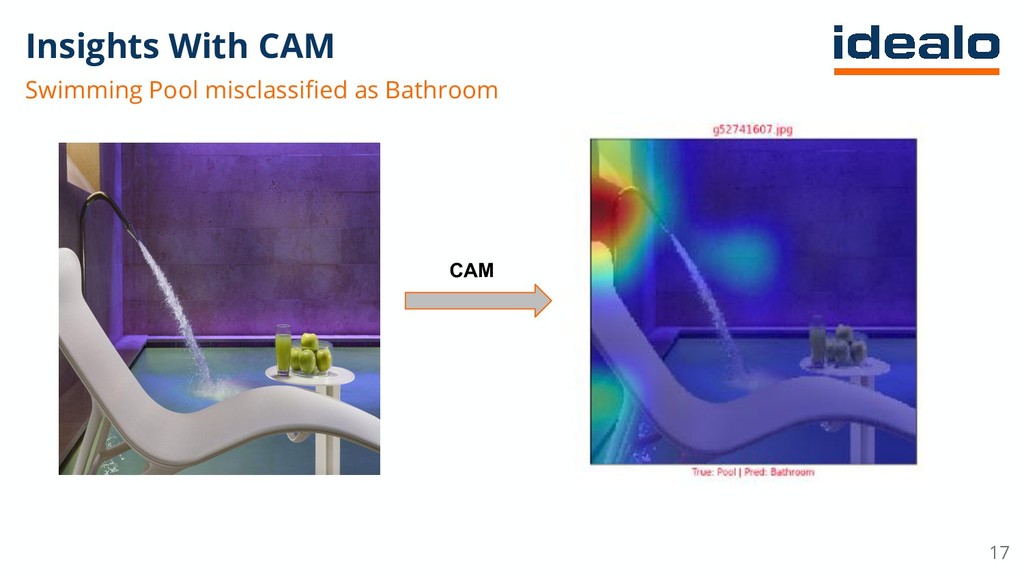
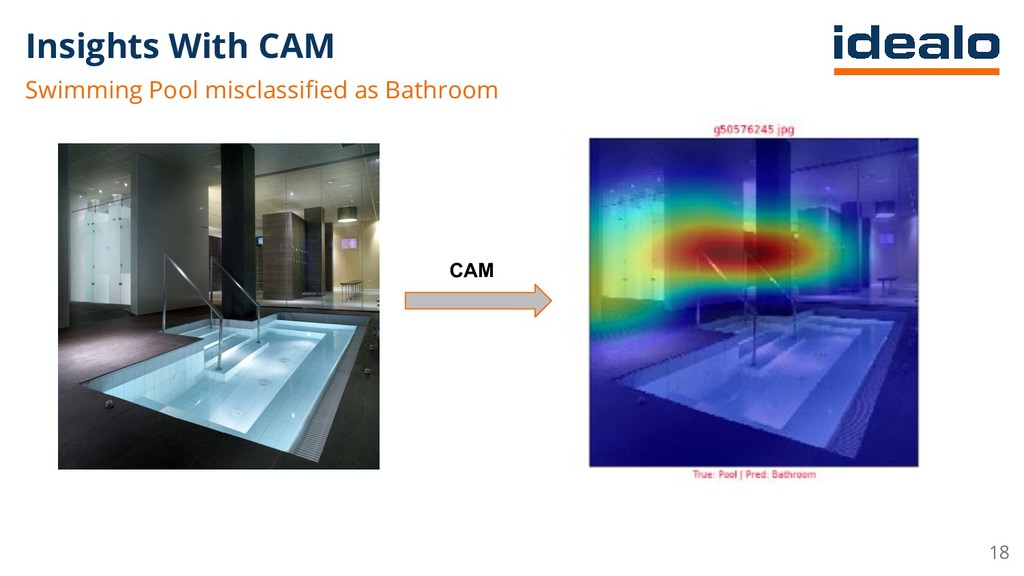
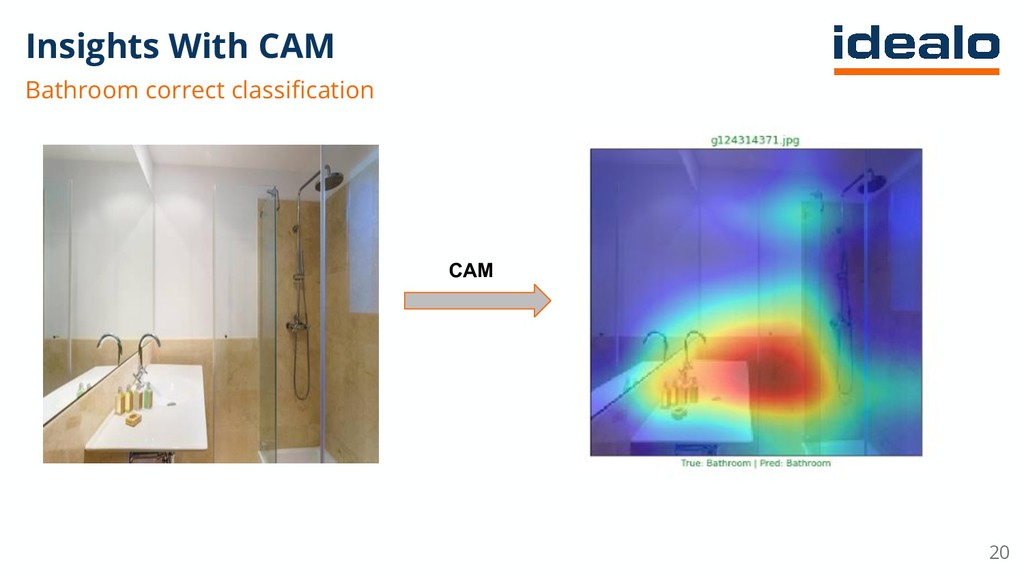
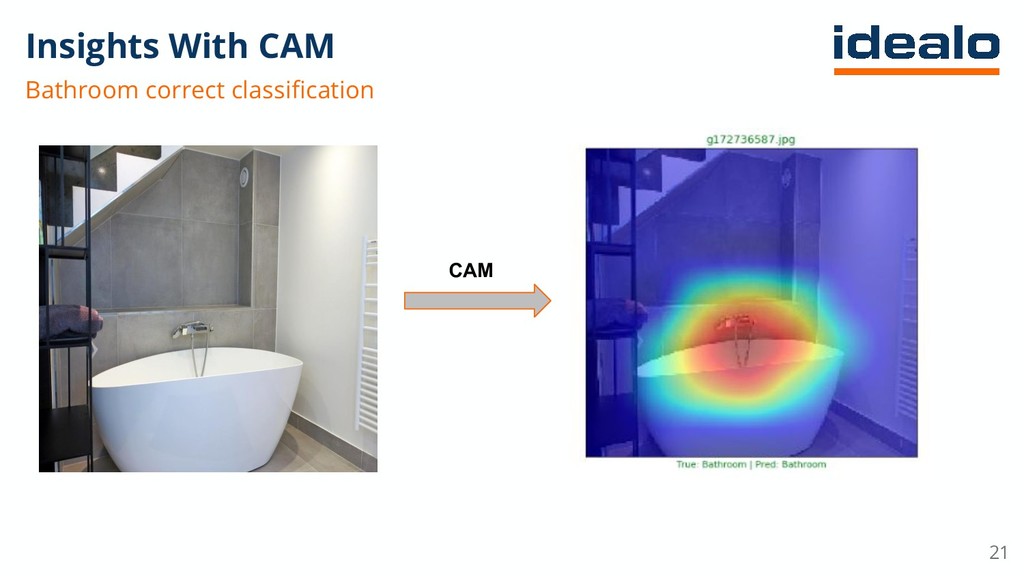
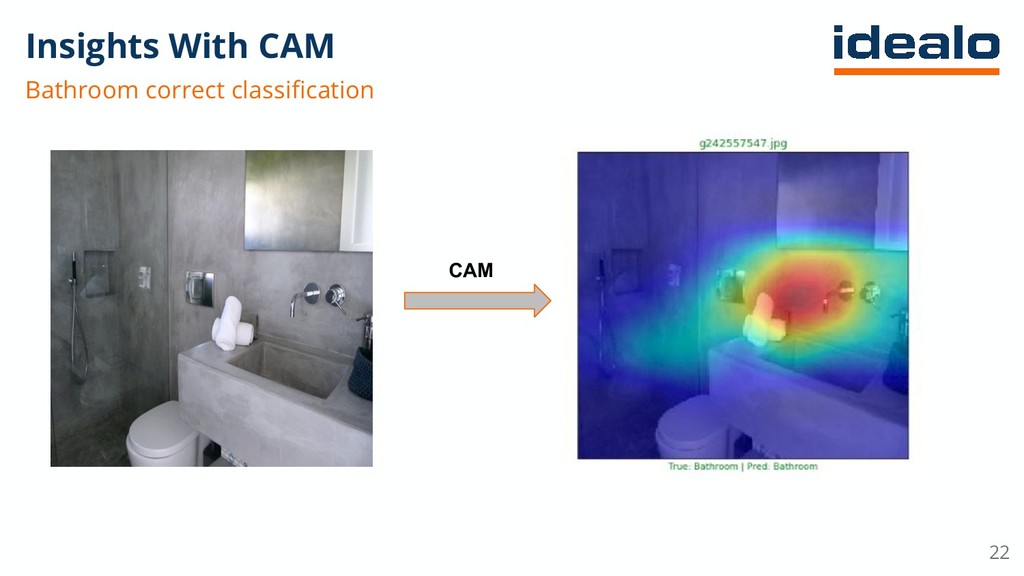
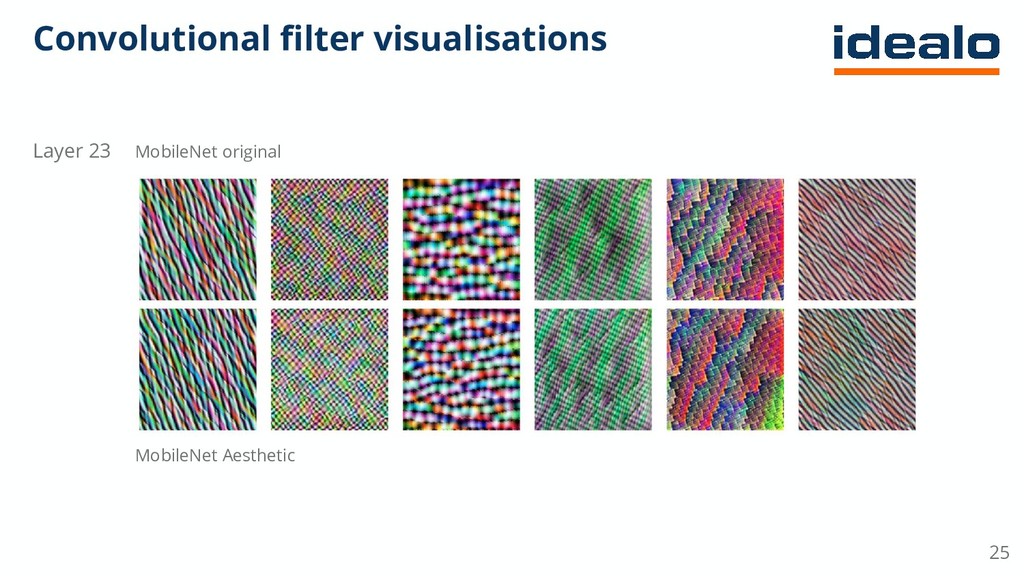
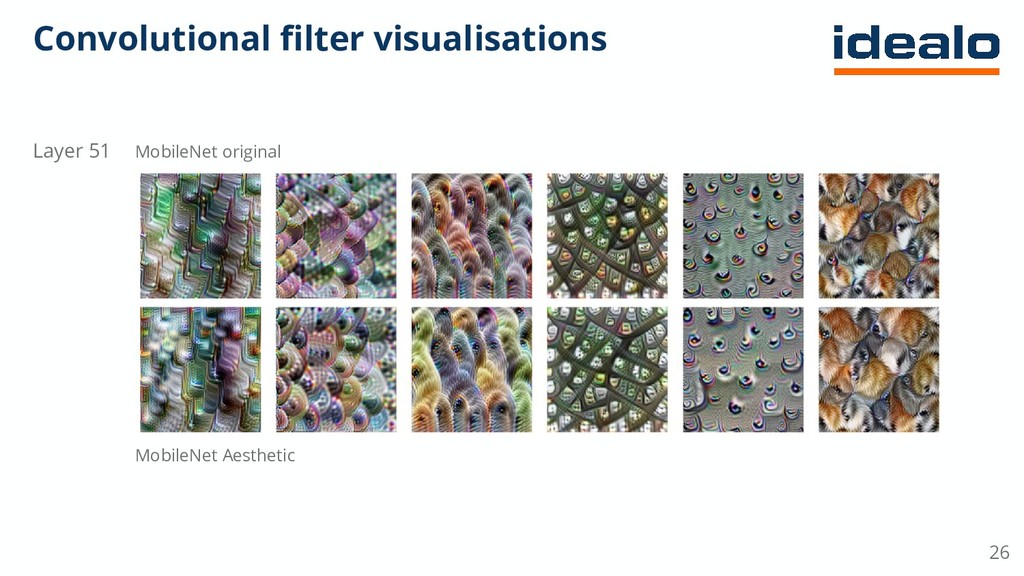
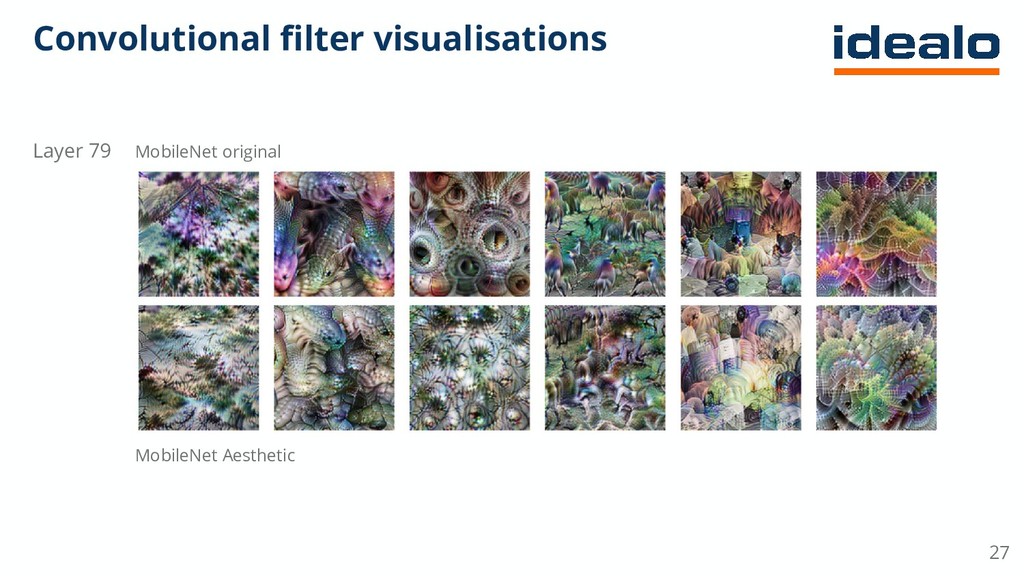
Convolutional Neural Networks (CNN) are state of the art when it comes to computer vision tasks, such as image recognition and object detection. However, due to the high amount of architectural complexity, it is often difficult to interpret the decisions made by these networks. Luckily, there are several techniques available which can enhance our comprehension of CNN decisions. These techniques are generally divided into attribution and visualisation methods. We have talked about several such techniques in this presentation.
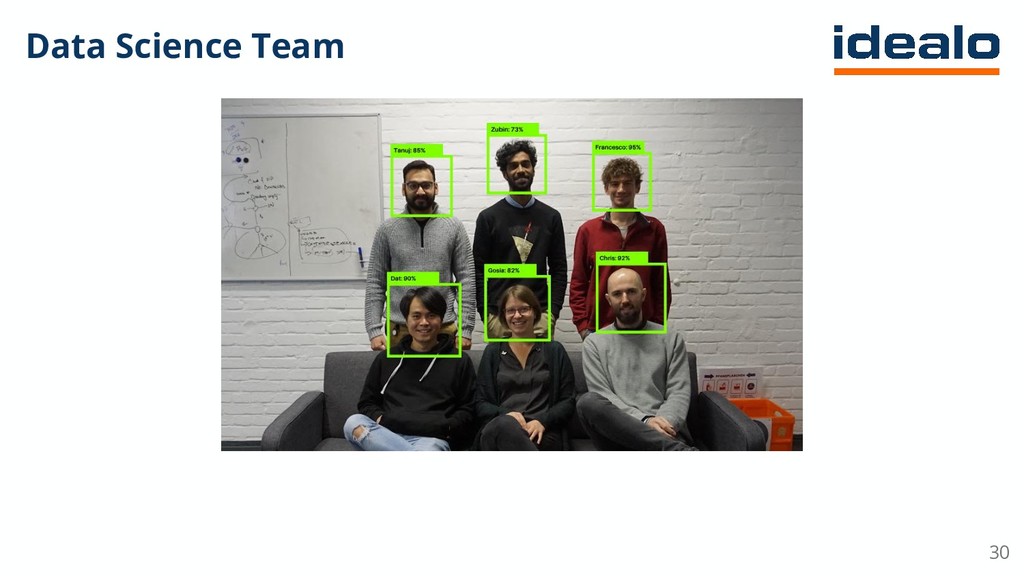
Tanuj

March 20, 2019
Tweet

More Decks by Tanuj

Other Decks in Technology

Transcript

  1. 1 Demystifying the neural network black box Christopher Lennan (Senior

    Data Scientist) @chris_lennan Tanuj Jain (Data Scientist) @tjainn #idealoTech
  2. 3 Motivation Convolutional Neural Networks (CNN) • CNNs are at

    the heart of most computer vision applications these days • They have also established themselves as successful for various NLP tasks • But: It is notoriously difficult to interpret/understand predictions! • Problematic, because o Understanding is just as important as performance o Sensitive applications (medical or autonomous driving) require a thorough understanding of its inner workings o CNNs can be improved if their predictions are properly understood
  3. idealo Use Case • Why are these misclassified as bathrooms?

    4 Use Case: Identify the area of Hotel Property
  4. Convolutional Neural Network (CNN) 5 source: Zhou et. al., “Learning

    Deep Features for Discriminative Localization”
  5. Convolutional Neural Network (CNN) 7 source: Zhou et. al., “Learning

    Deep Features for Discriminative Localization”
  6. 9 Interpreting CNNs • The available methods for interpreting CNNs

    can be broadly grouped into 1. Attribution methods • attributing a classification result back to the input pixels • output is usually a heatmap over input pixels that indicates how much each pixel contributed to the classification outcome 2. Visualization methods • Visualize the patterns that filters have learned • Generate images that cause maximum neuron activation • Visualize neuron interactions
  7. Attribution methods 1. Perturbation based approaches - Occlude area of

    interest to test its effectiveness in changing predictions 2. Gradient based approaches - Calculation of gradients of output w.r.t. some network variable a. Saliency Maps b. Guided Backpropagation c. Deconvolution 3. Relevance Score approaches a. Class Activation Map (CAM) b. Grad- CAM c. Layerwise Relevance Propagation (LRP) Relative importance of areas of the input image for predictions
  8. Visualization methods Neurons and parameters can be visualized at all

    levels of the network: 11 Looking at the learned parameters of the neural network source: https://distill.pub/2017/feature-visualization/