Learning Solution Dept. Data Science Dept.2 Data Science Dept.1 Ad Data Dept. - Keiichiro Nagao - Joined LINE Corporation as a Data Scientist in October 2020 - Working on data analysis for family service data projects especially LIVEBUY
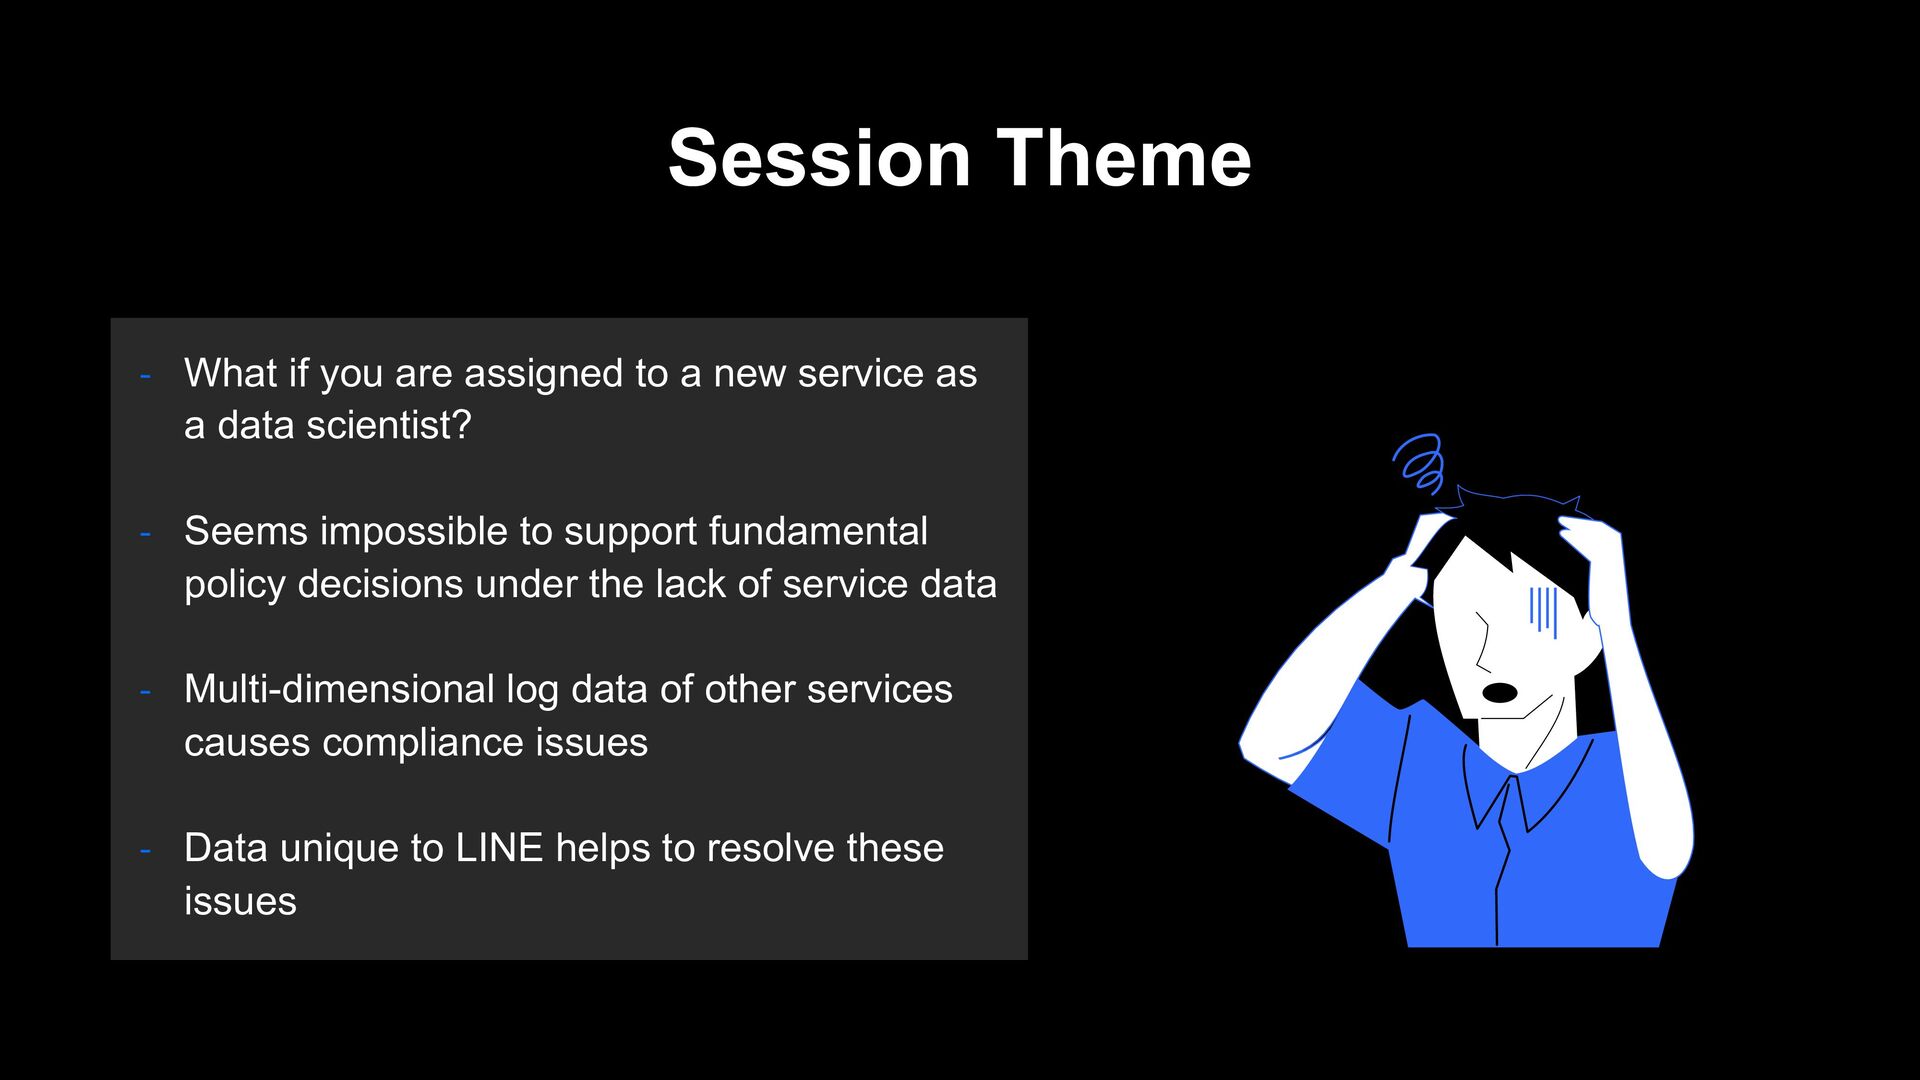
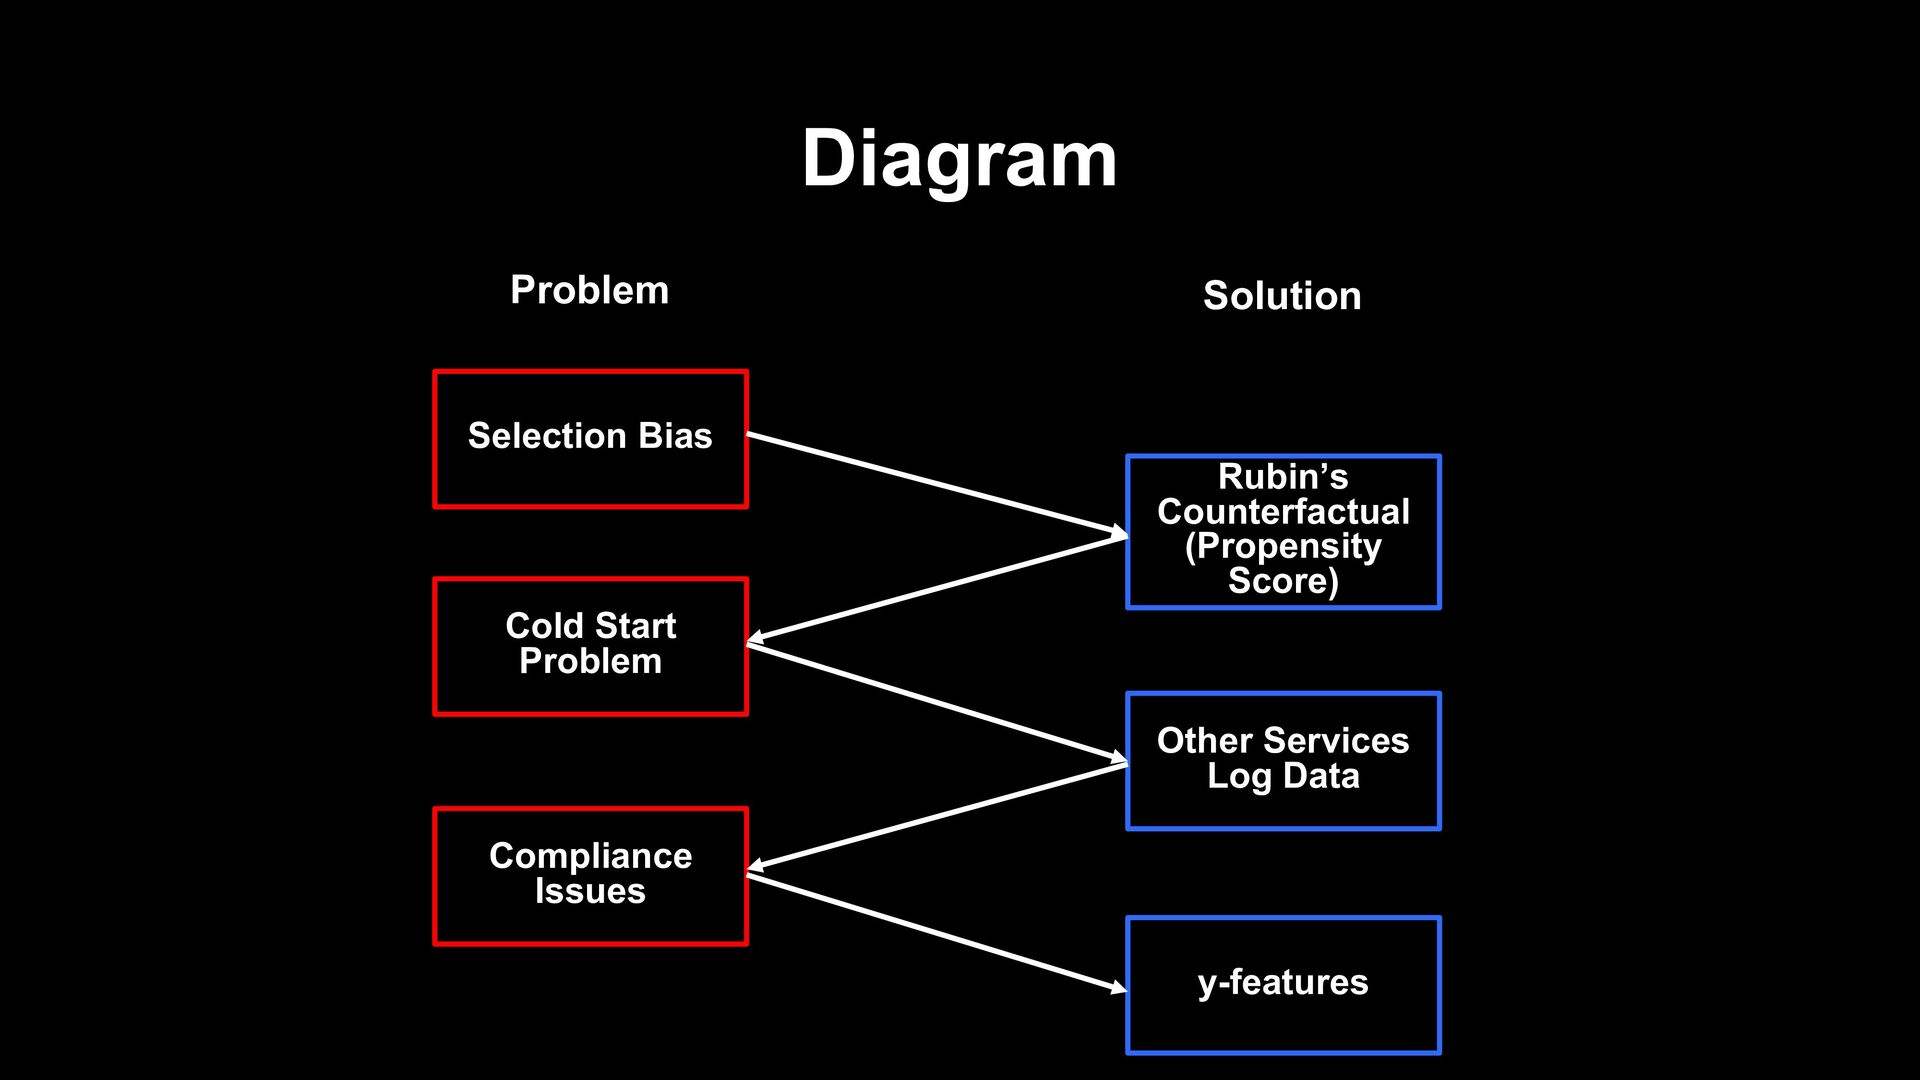
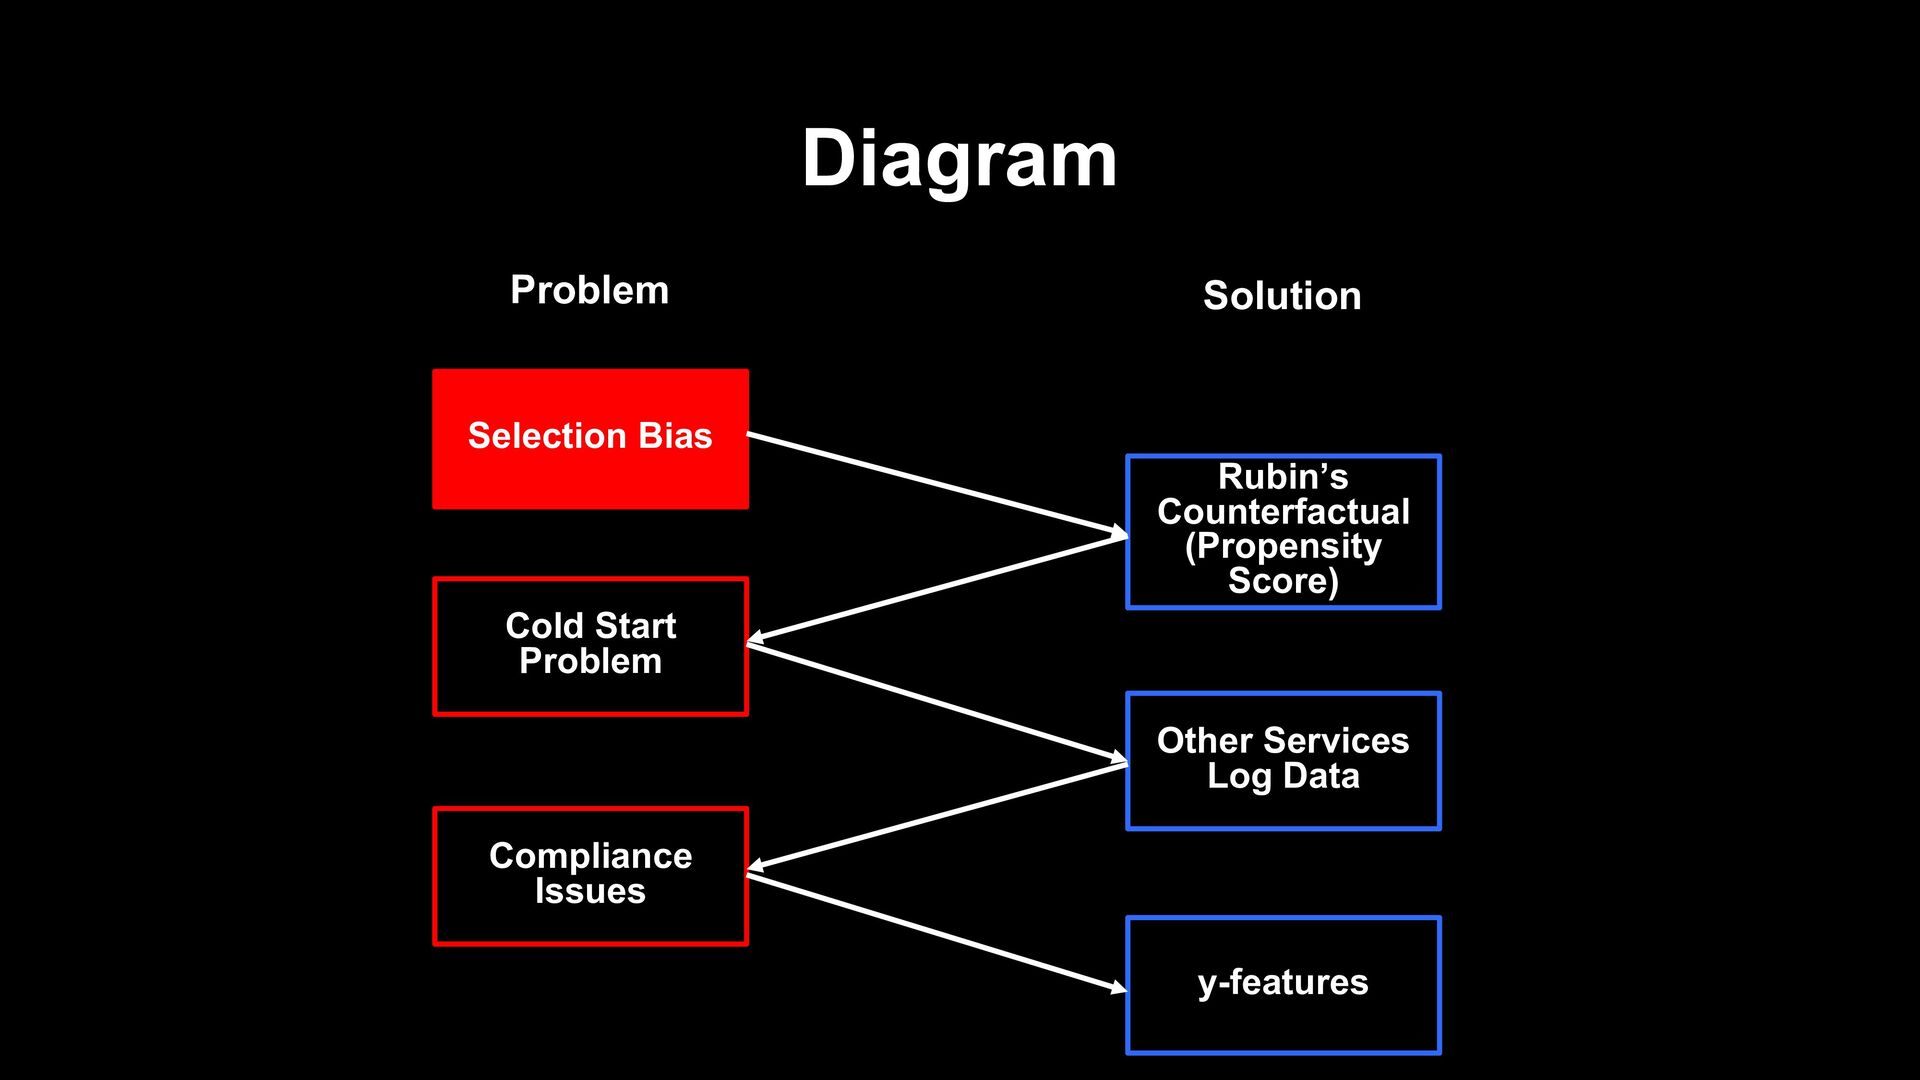
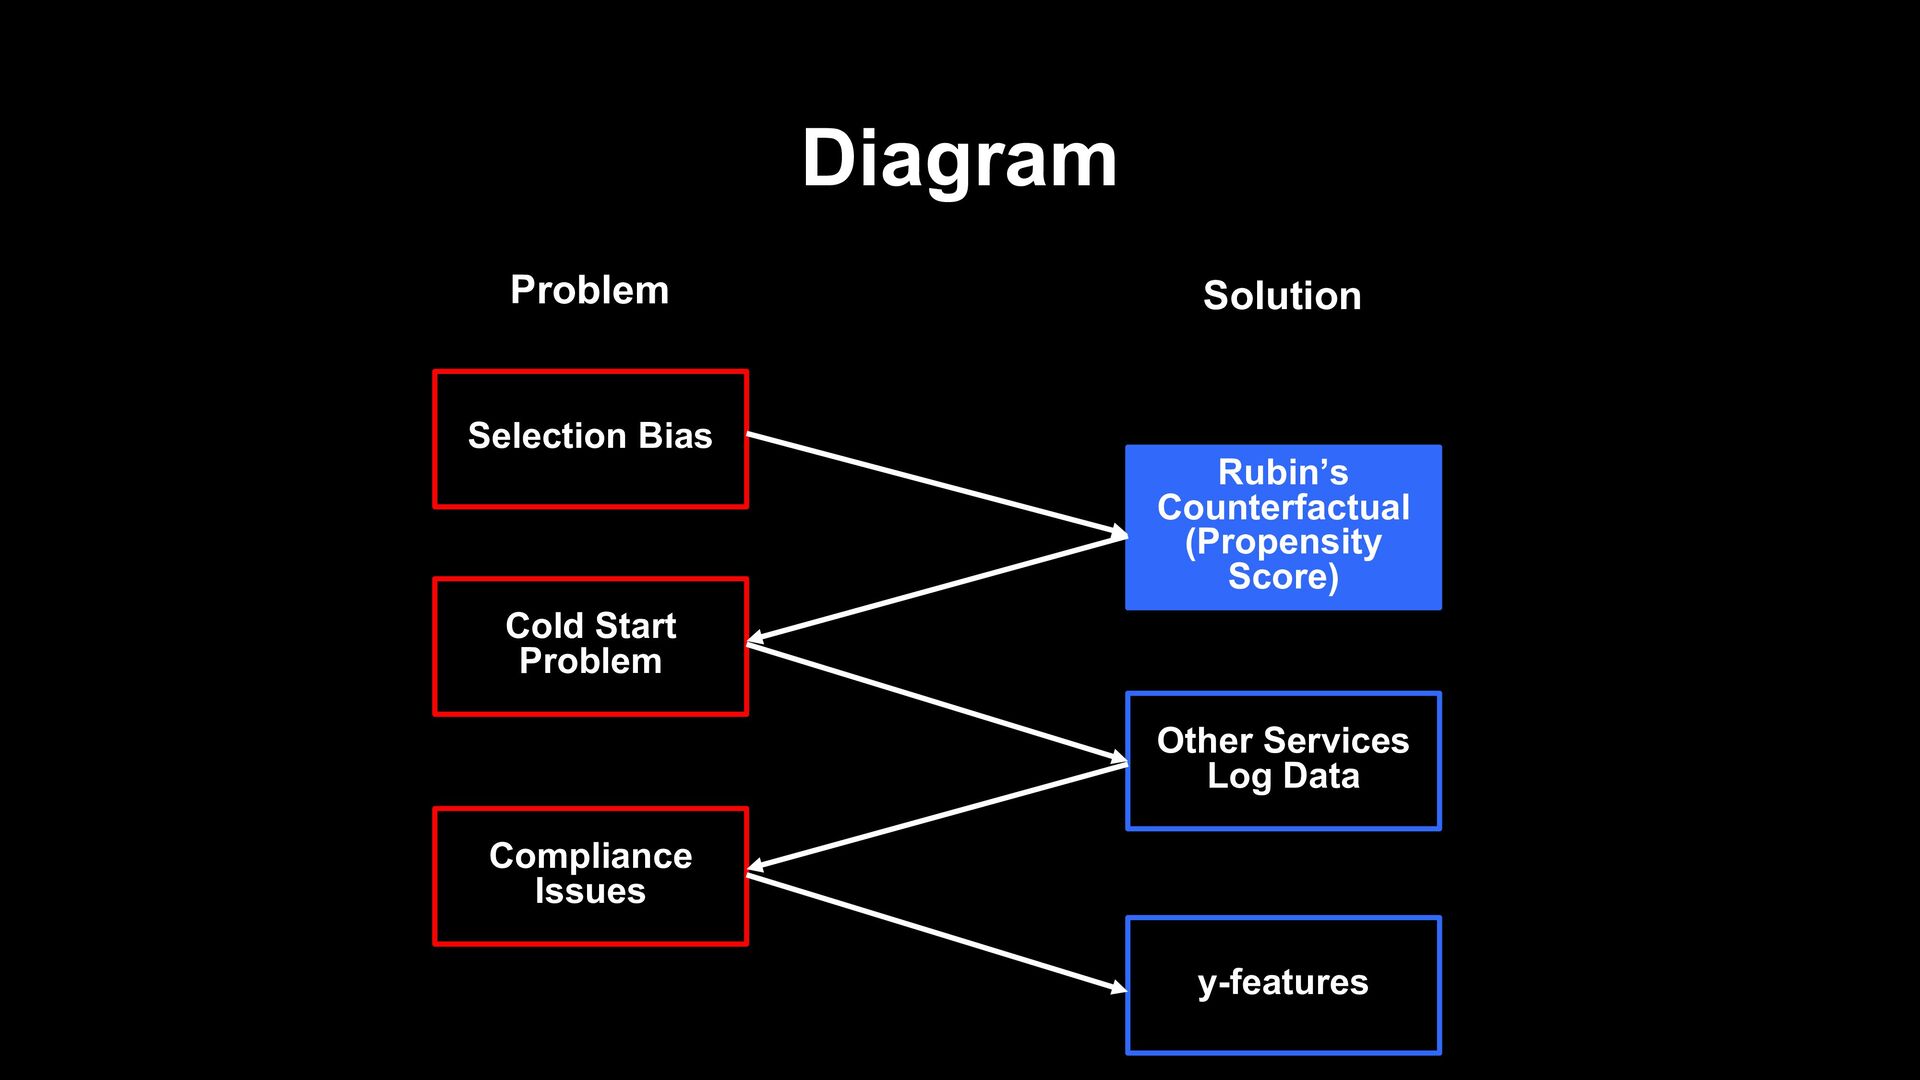
new service as a data scientist? - Seems impossible to support fundamental policy decisions under the lack of service data - Multi-dimensional log data of other services causes compliance issues - Data unique to LINE helps to resolve these issues
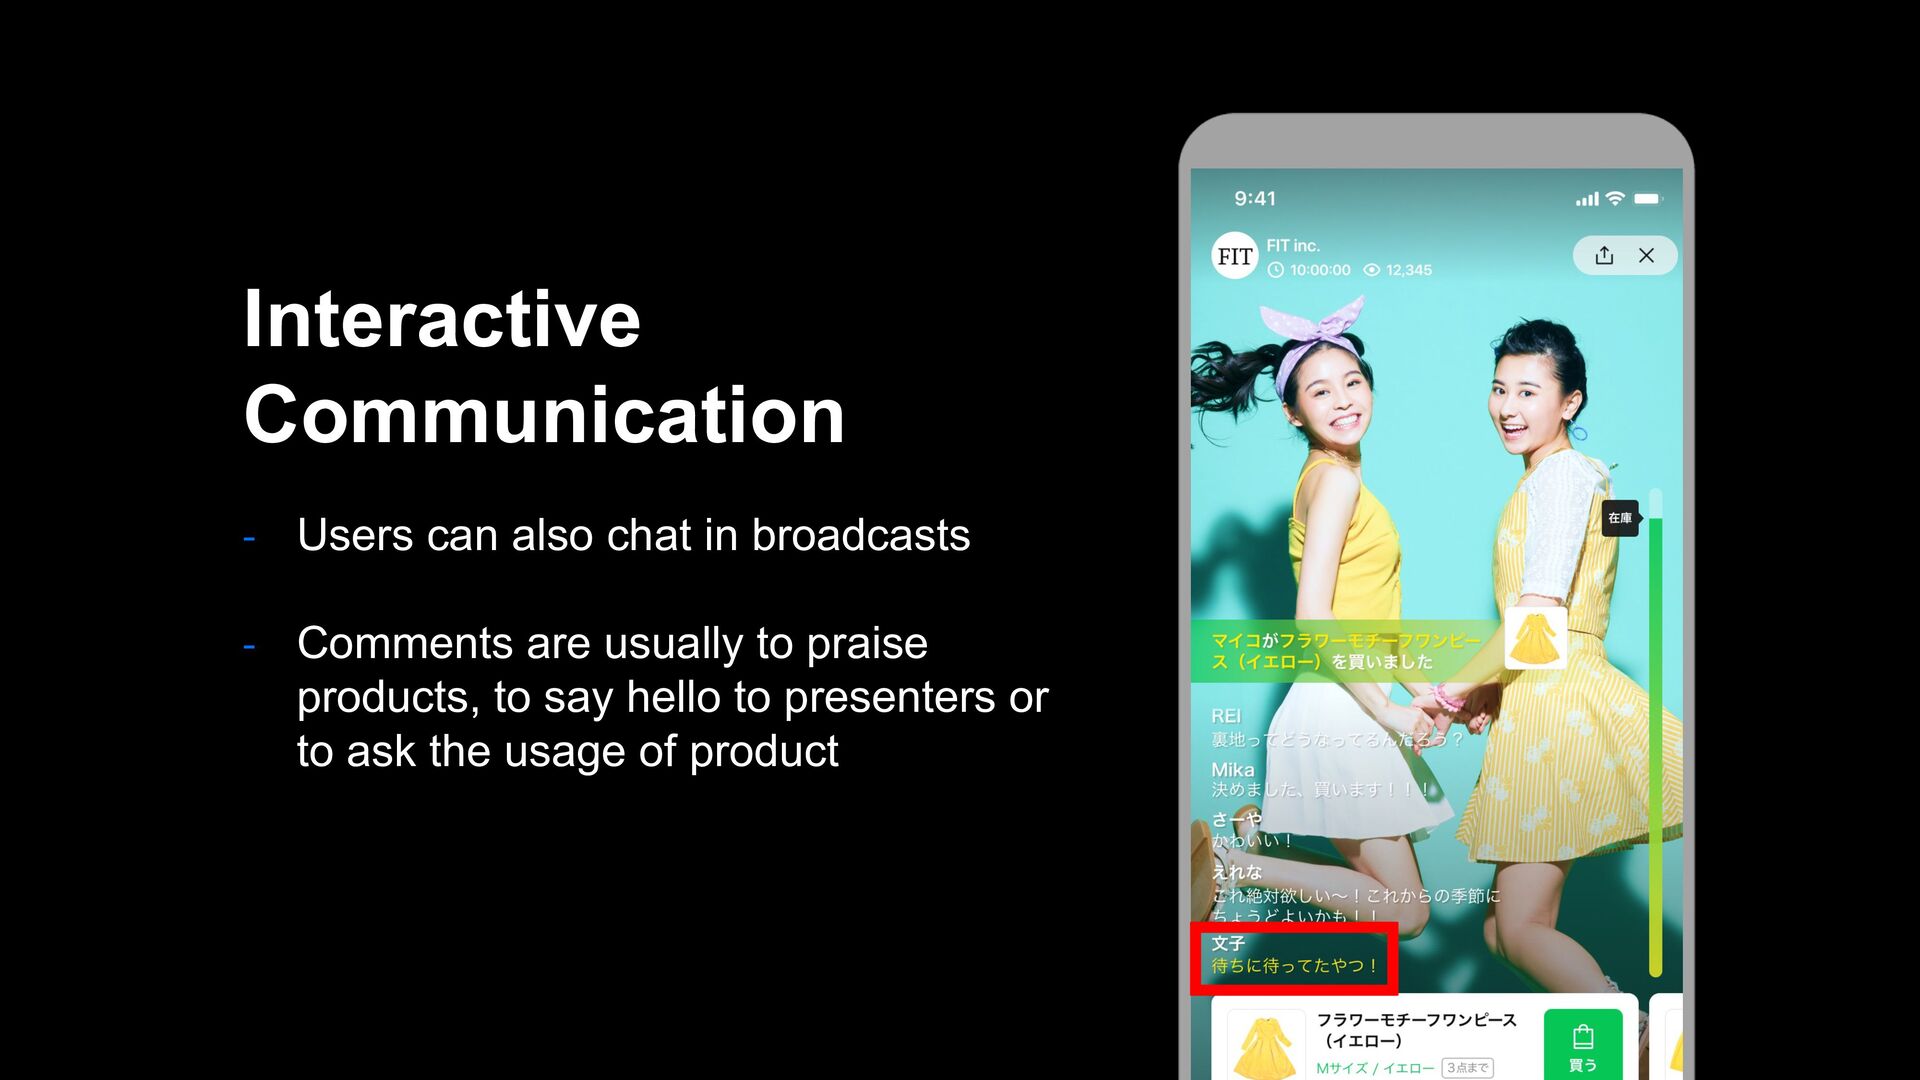
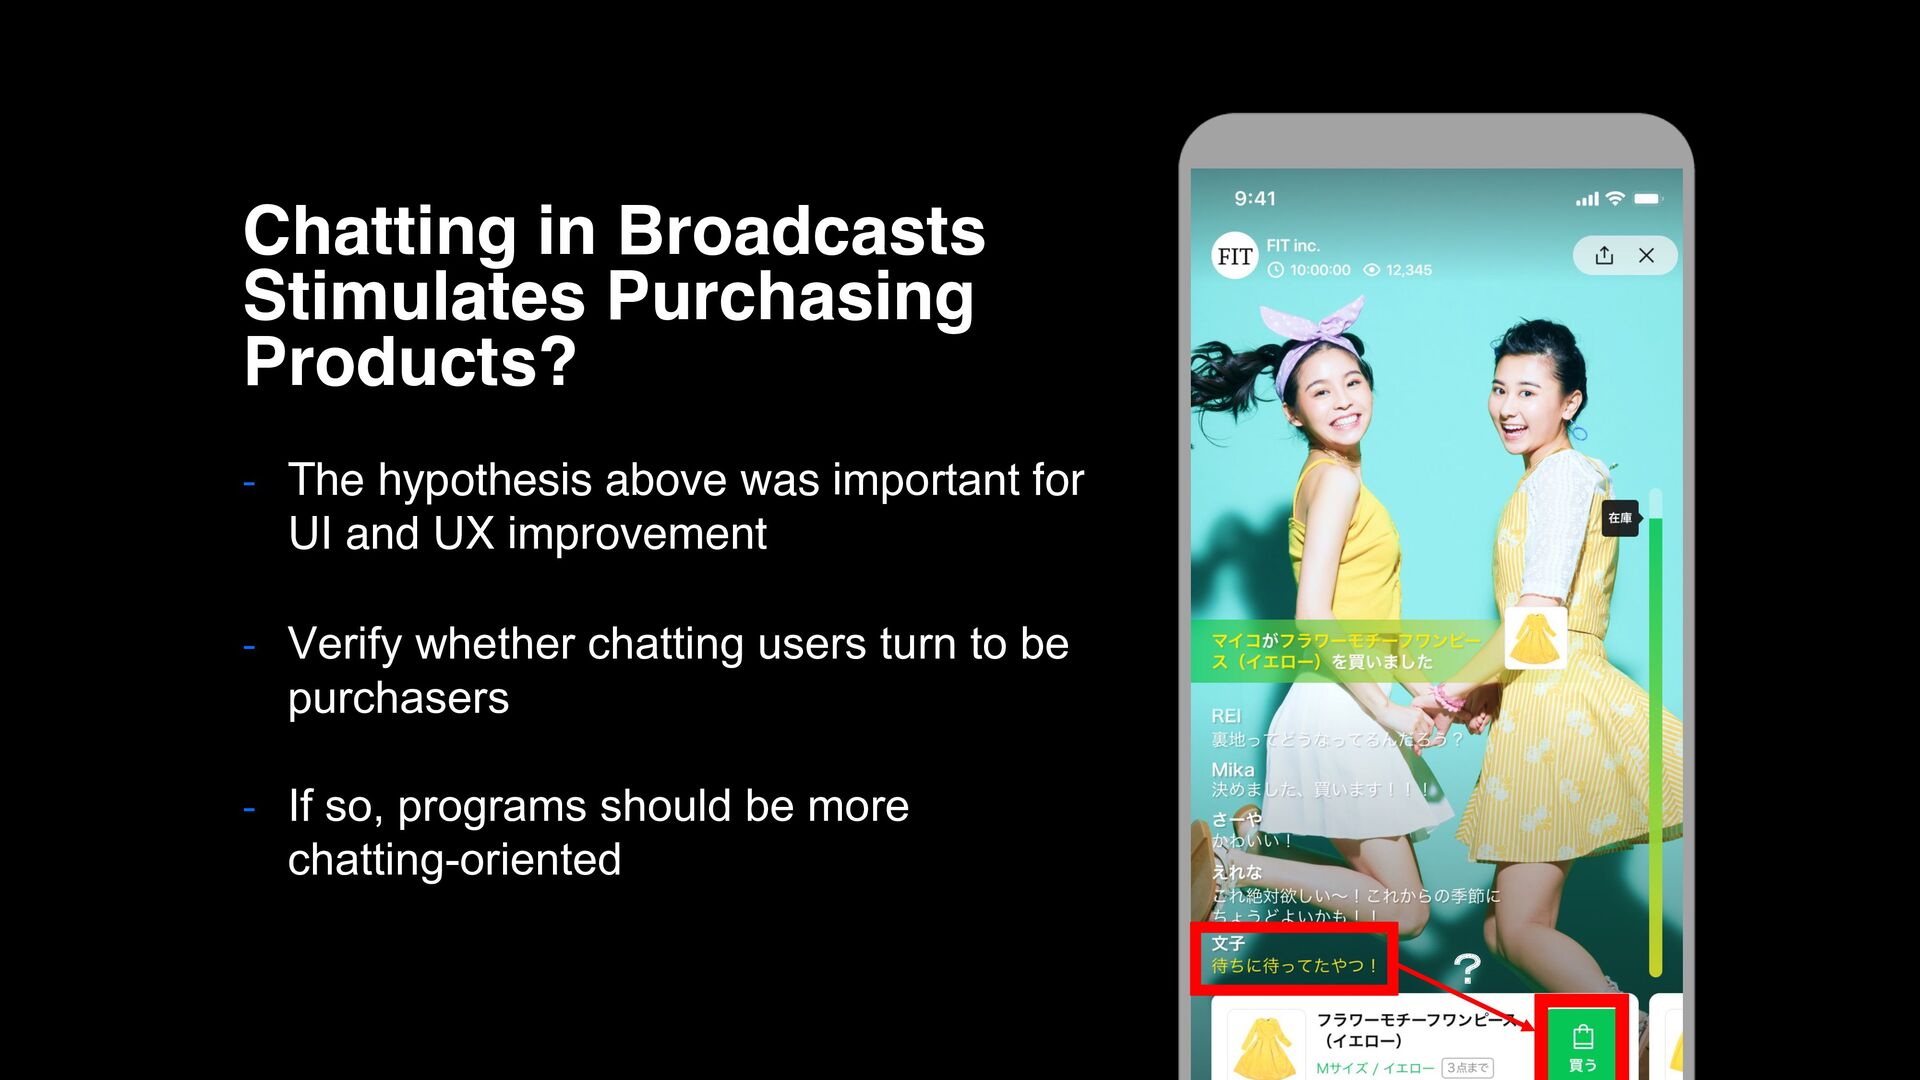
improvement - Verify whether chatting users turn to be purchasers - If so, programs should be more chatting-oriented Chatting in Broadcasts Stimulates Purchasing Products? ?
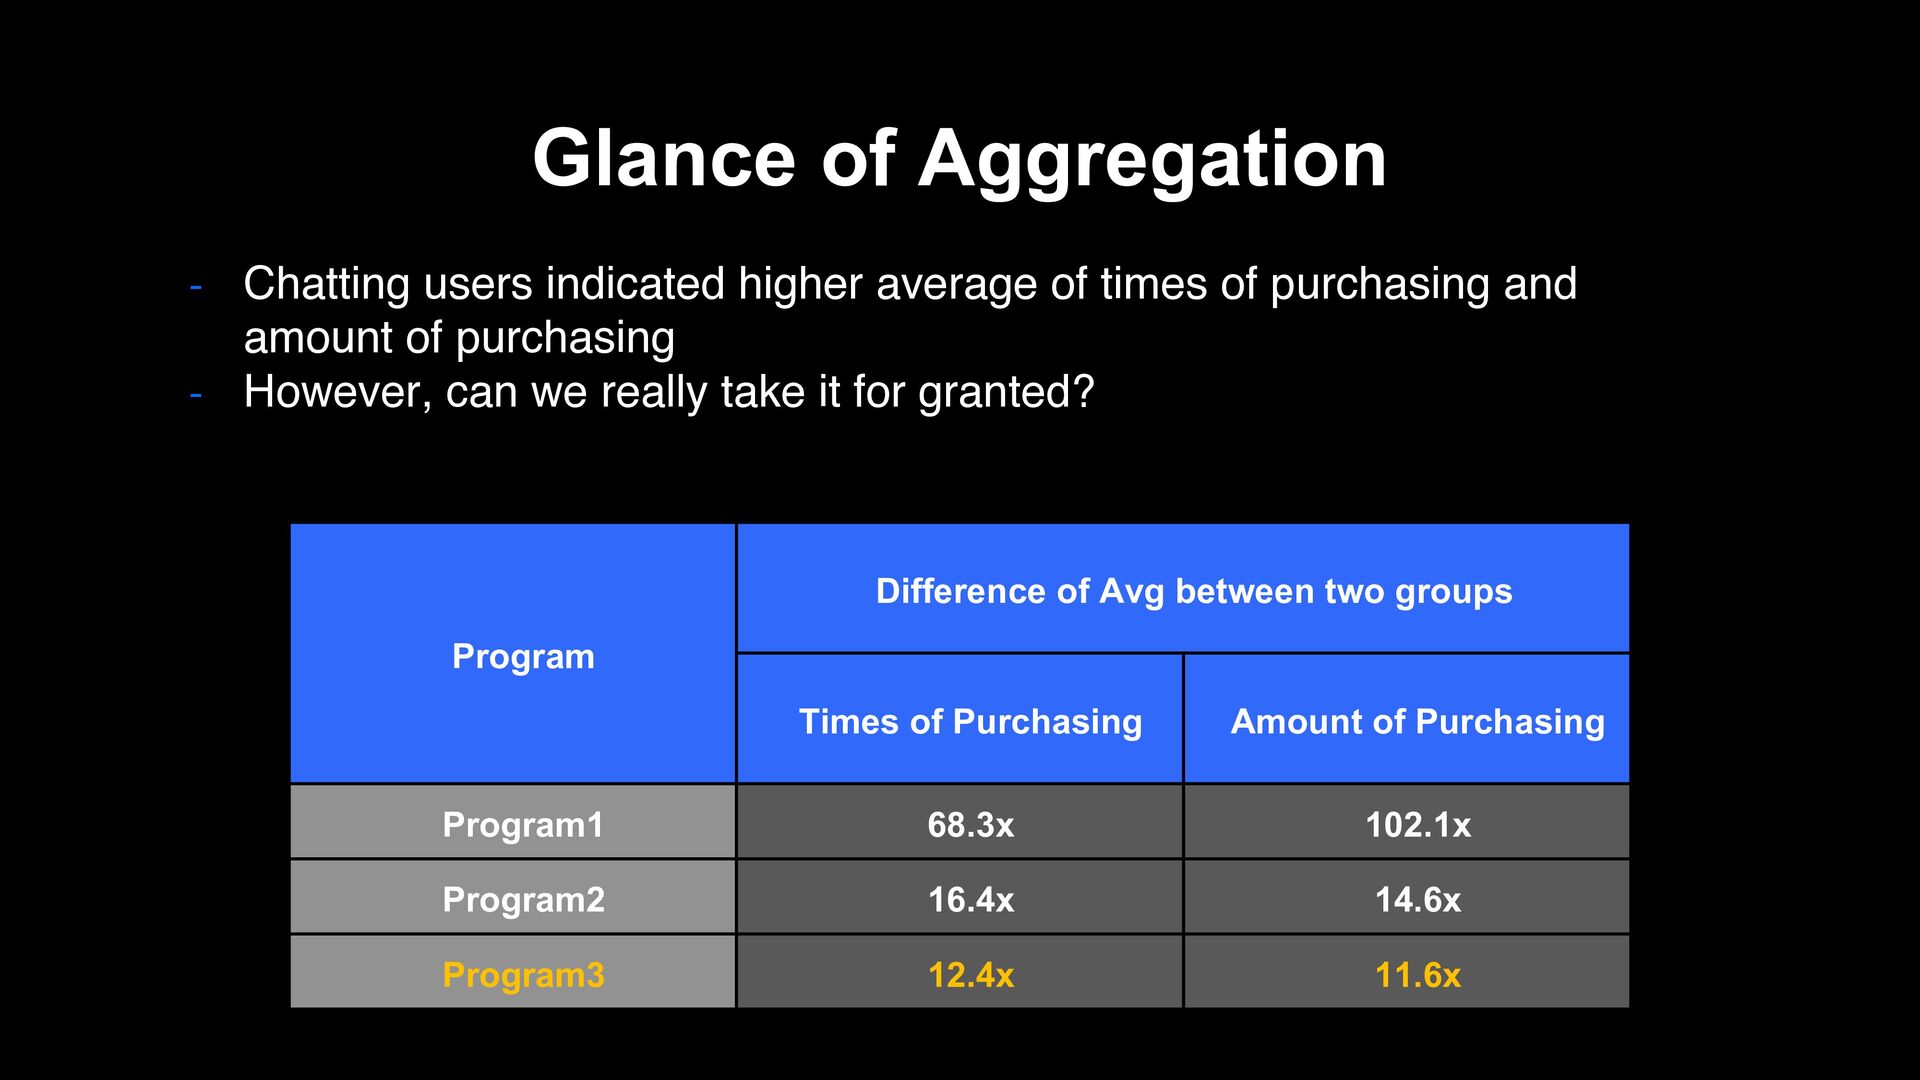
times of purchasing and amount of purchasing - However, can we really take it for granted? Program Difference of Avg between two groups Times of Purchasing Amount of Purchasing Program1 68.3x 102.1x Program2 16.4x 14.6x Program3 12.4x 11.6x
times of purchasing and amount of purchasing - However, can we really take it for granted? Program Difference of Avg between two groups Times of Purchasing Amount of Purchasing Program1 68.3x 102.1x Program2 16.4x 14.6x Program3 12.4x 11.6x
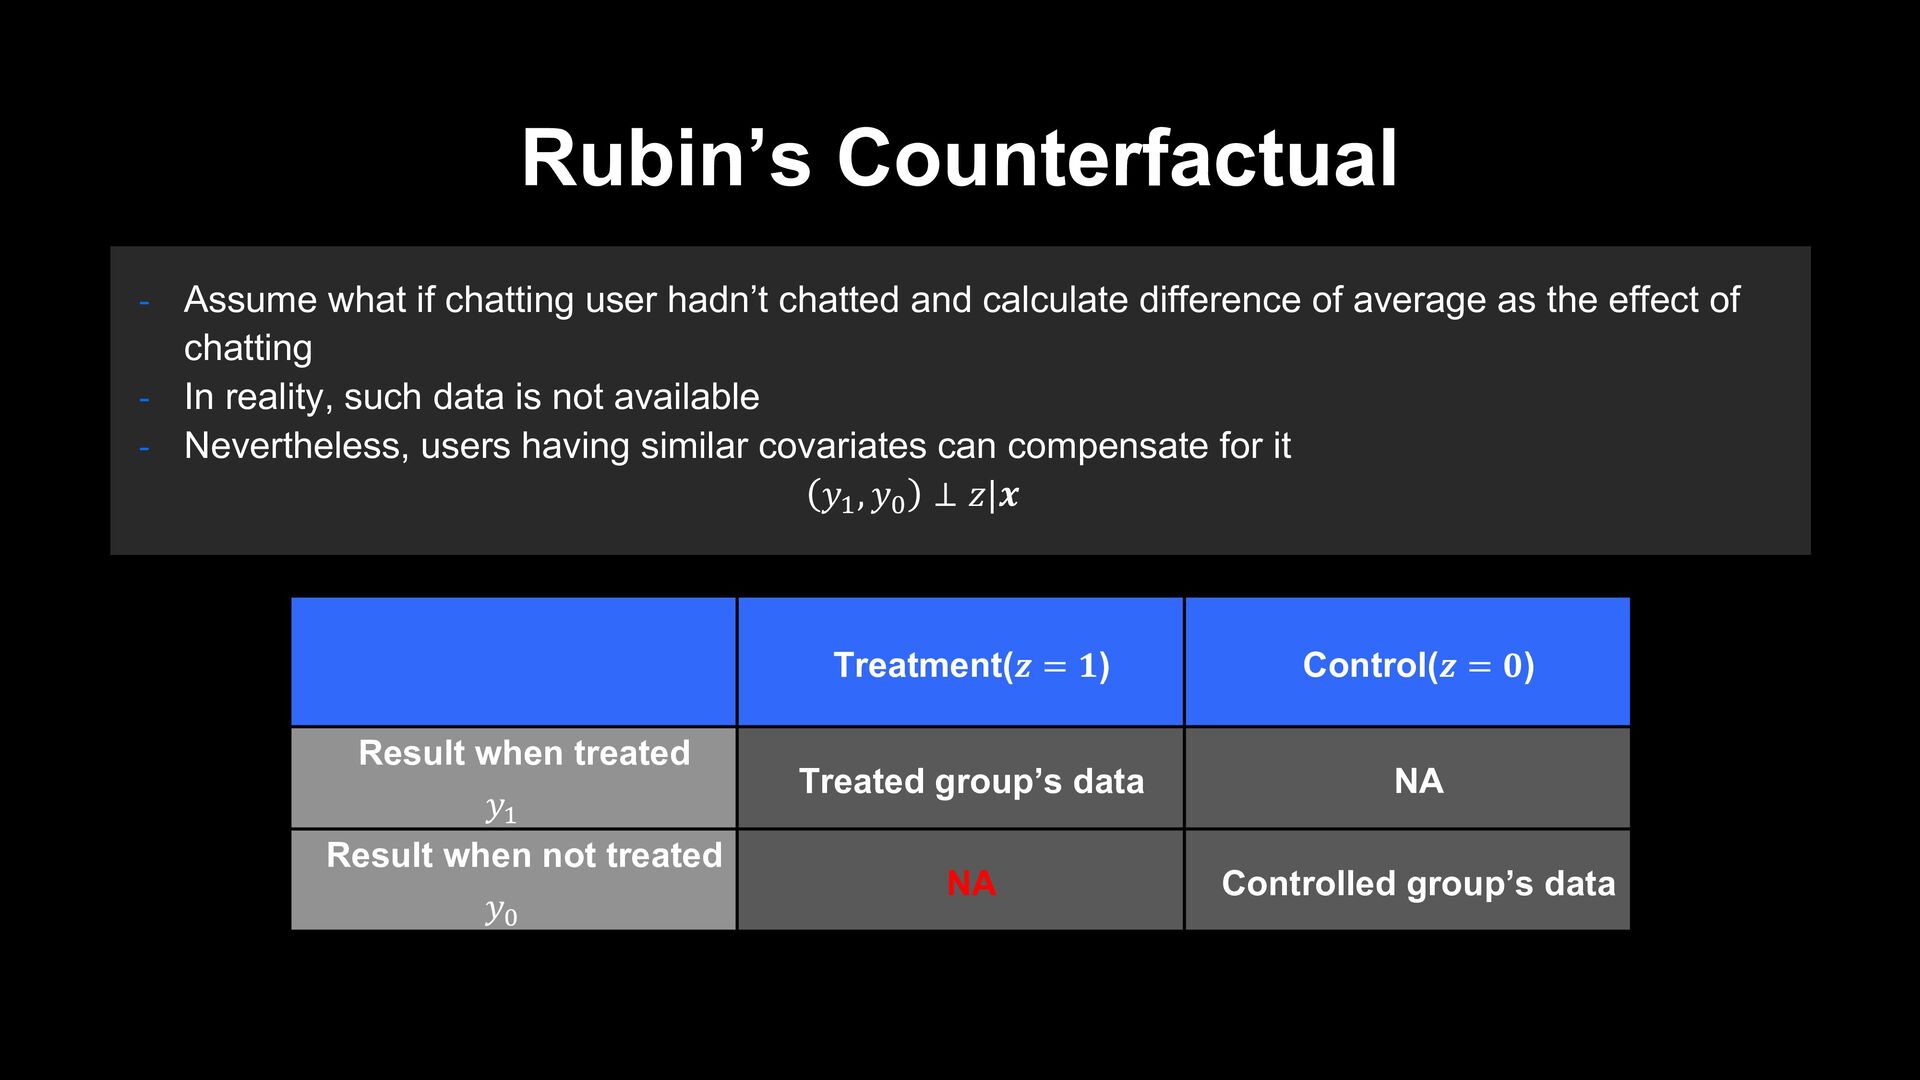
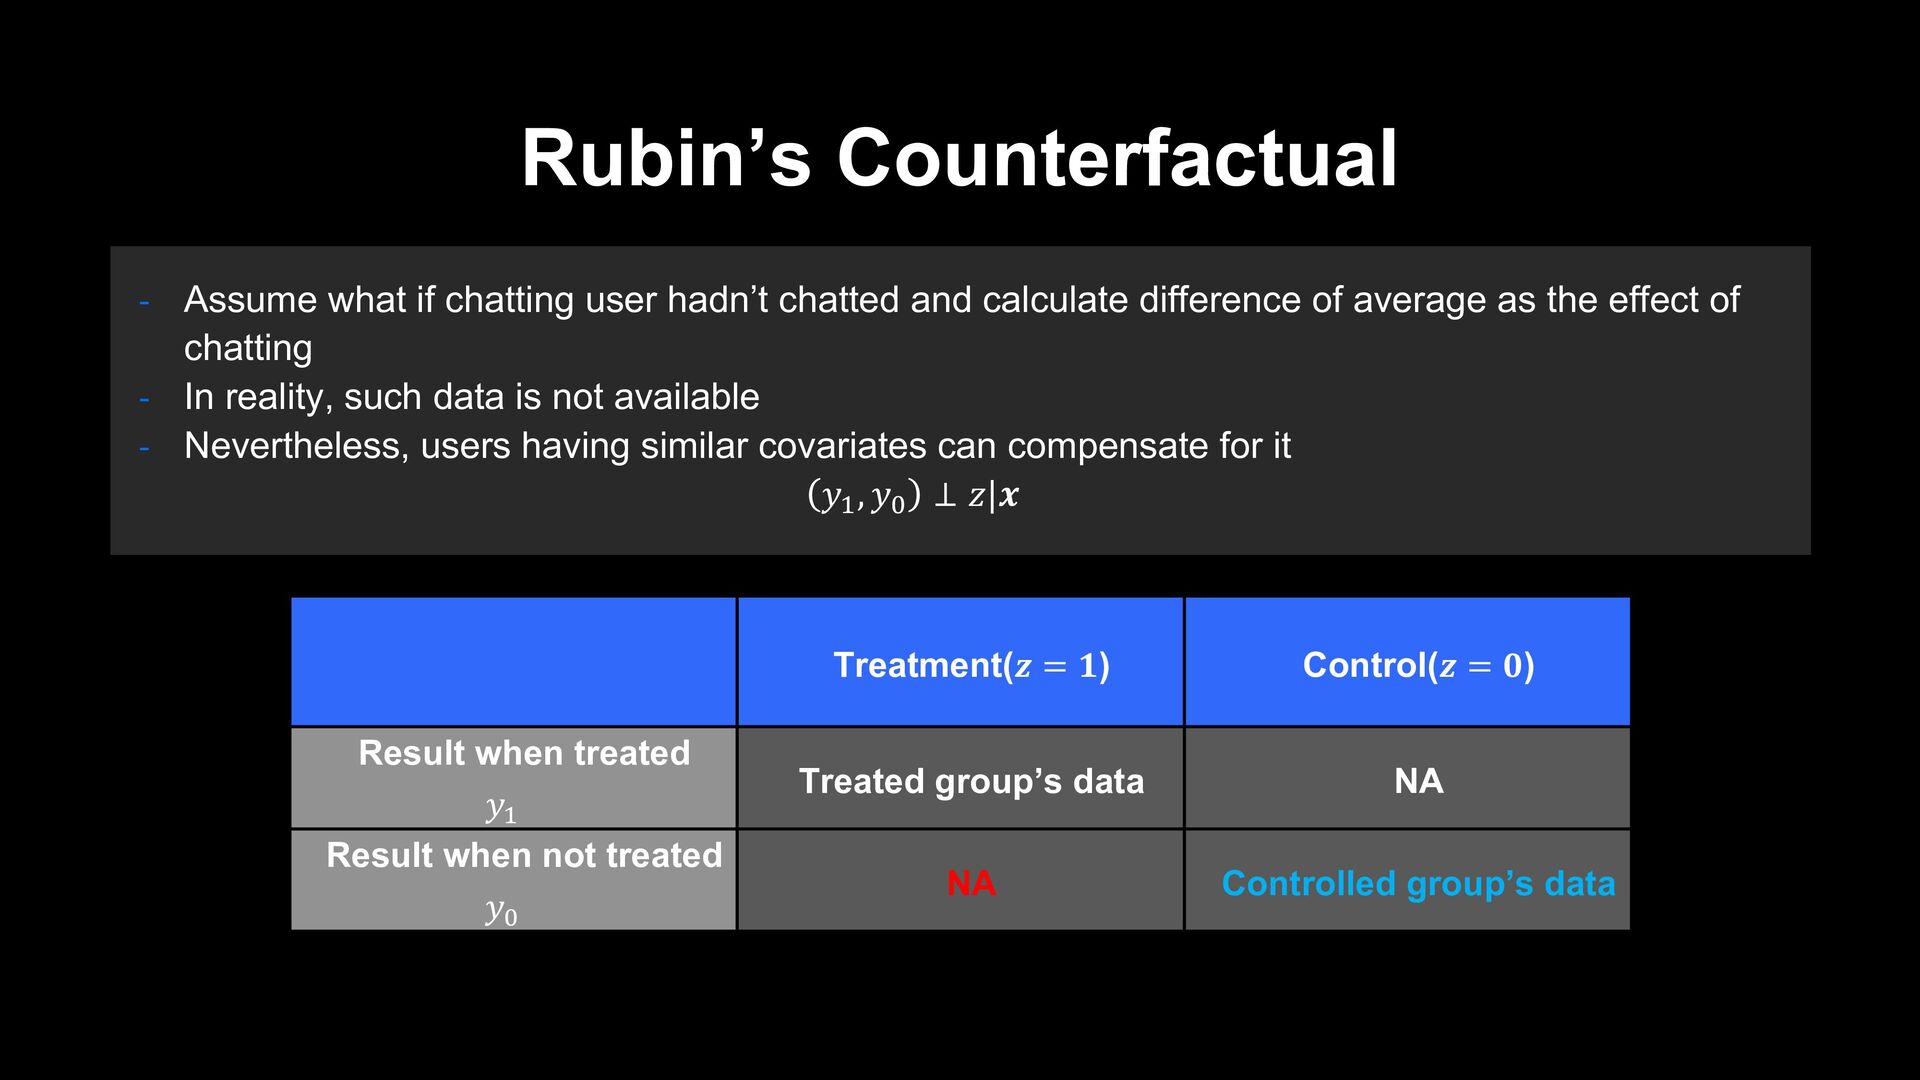
and calculate difference of average as the effect of chatting - In reality, such data is not available - Nevertheless, users having similar covariates can compensate for it 𝑦! , 𝑦" ⊥ 𝑧|𝒙 Treatment(𝒛 = 𝟏) Control(𝒛 = 𝟎) Result when treated 𝑦! Treated group’s data NA Result when not treated 𝑦" NA Controlled group’s data
and calculate difference of average as the effect of chatting - In reality, such data is not available - Nevertheless, users having similar covariates can compensate for it 𝑦! , 𝑦" ⊥ 𝑧|𝒙 Treatment(𝒛 = 𝟏) Control(𝒛 = 𝟎) Result when treated 𝑦! Treated group’s data NA Result when not treated 𝑦" NA Controlled group’s data
and calculate difference of average as the effect of chatting - In reality, such data is not available - Nevertheless, users having similar covariates can compensate for it 𝑦! , 𝑦" ⊥ 𝑧|𝒙 Treatment(𝒛 = 𝟏) Control(𝒛 = 𝟎) Result when treated 𝑦! Treated group’s data NA Result when not treated 𝑦" NA Controlled group’s data
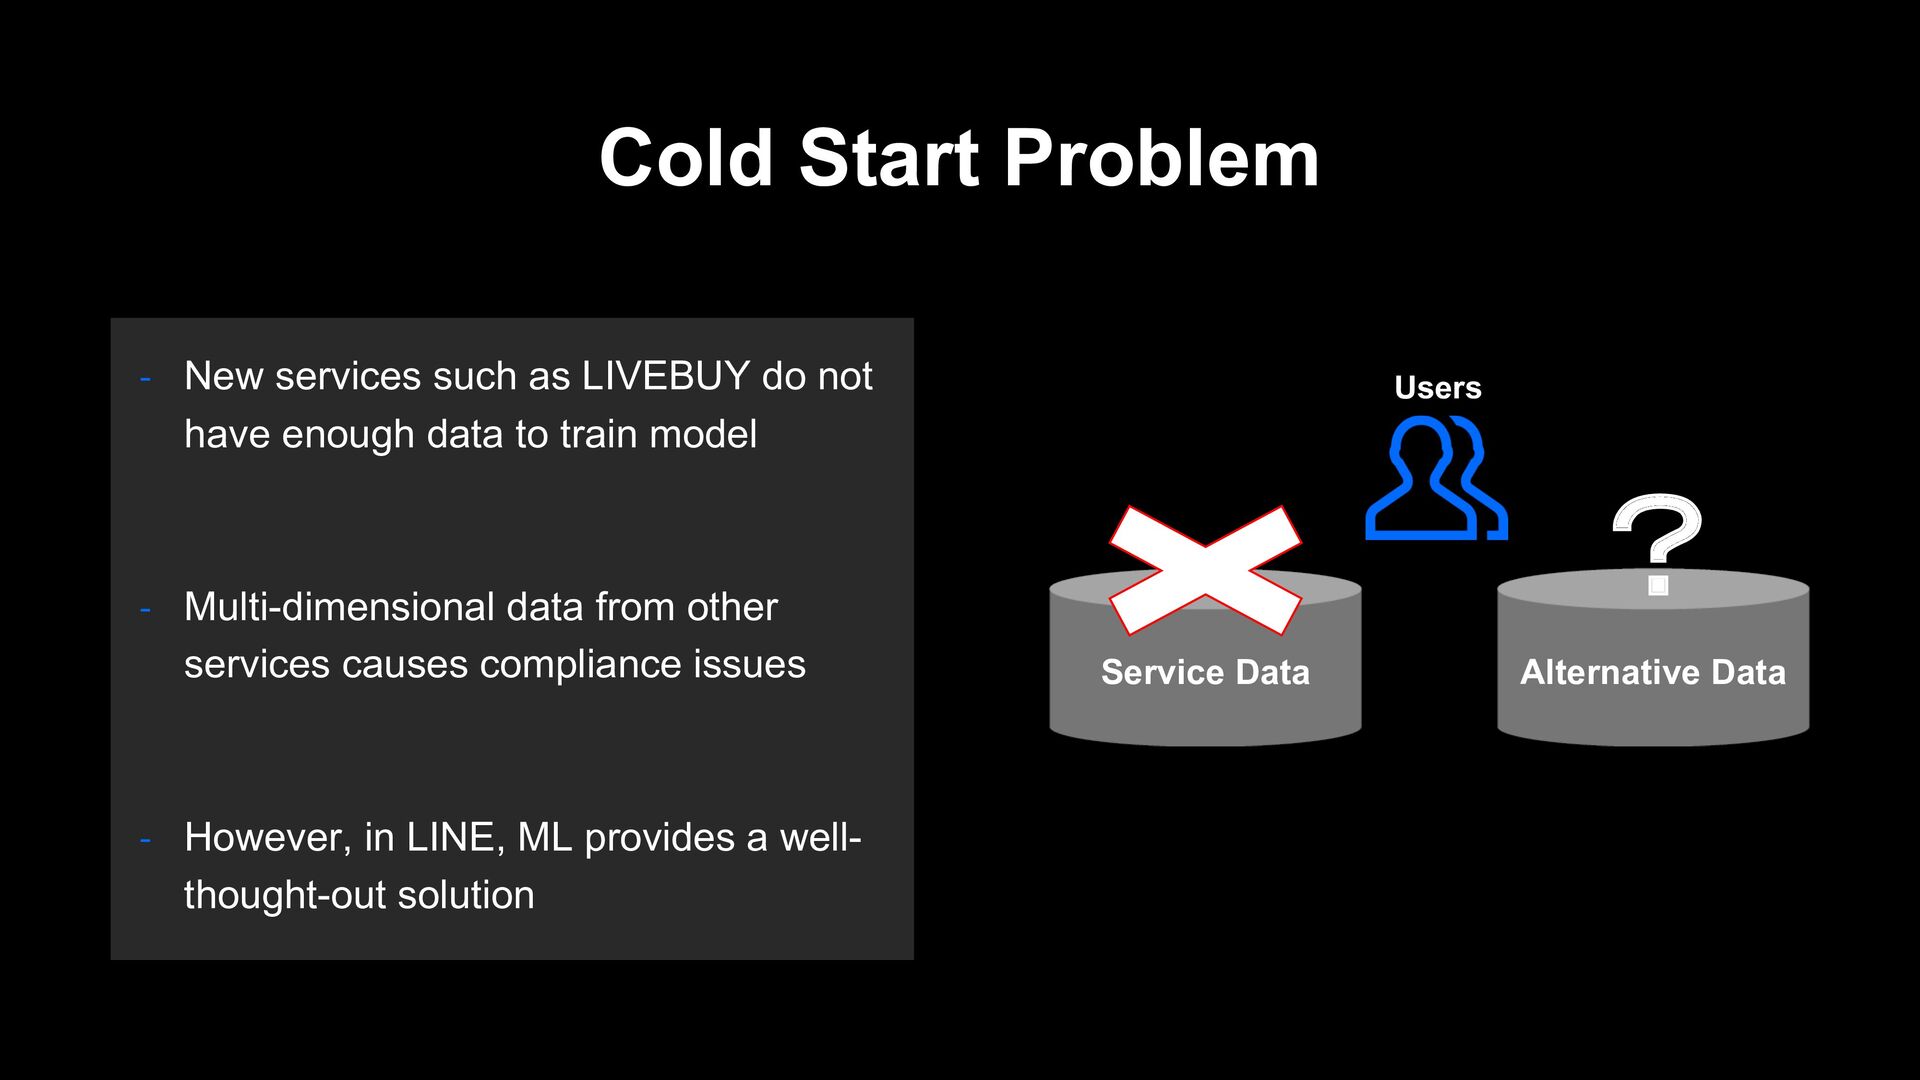
not have enough data to train model - Multi-dimensional data from other services causes compliance issues - However, in LINE, ML provides a well- thought-out solution Service Data Alternative Data ? Users
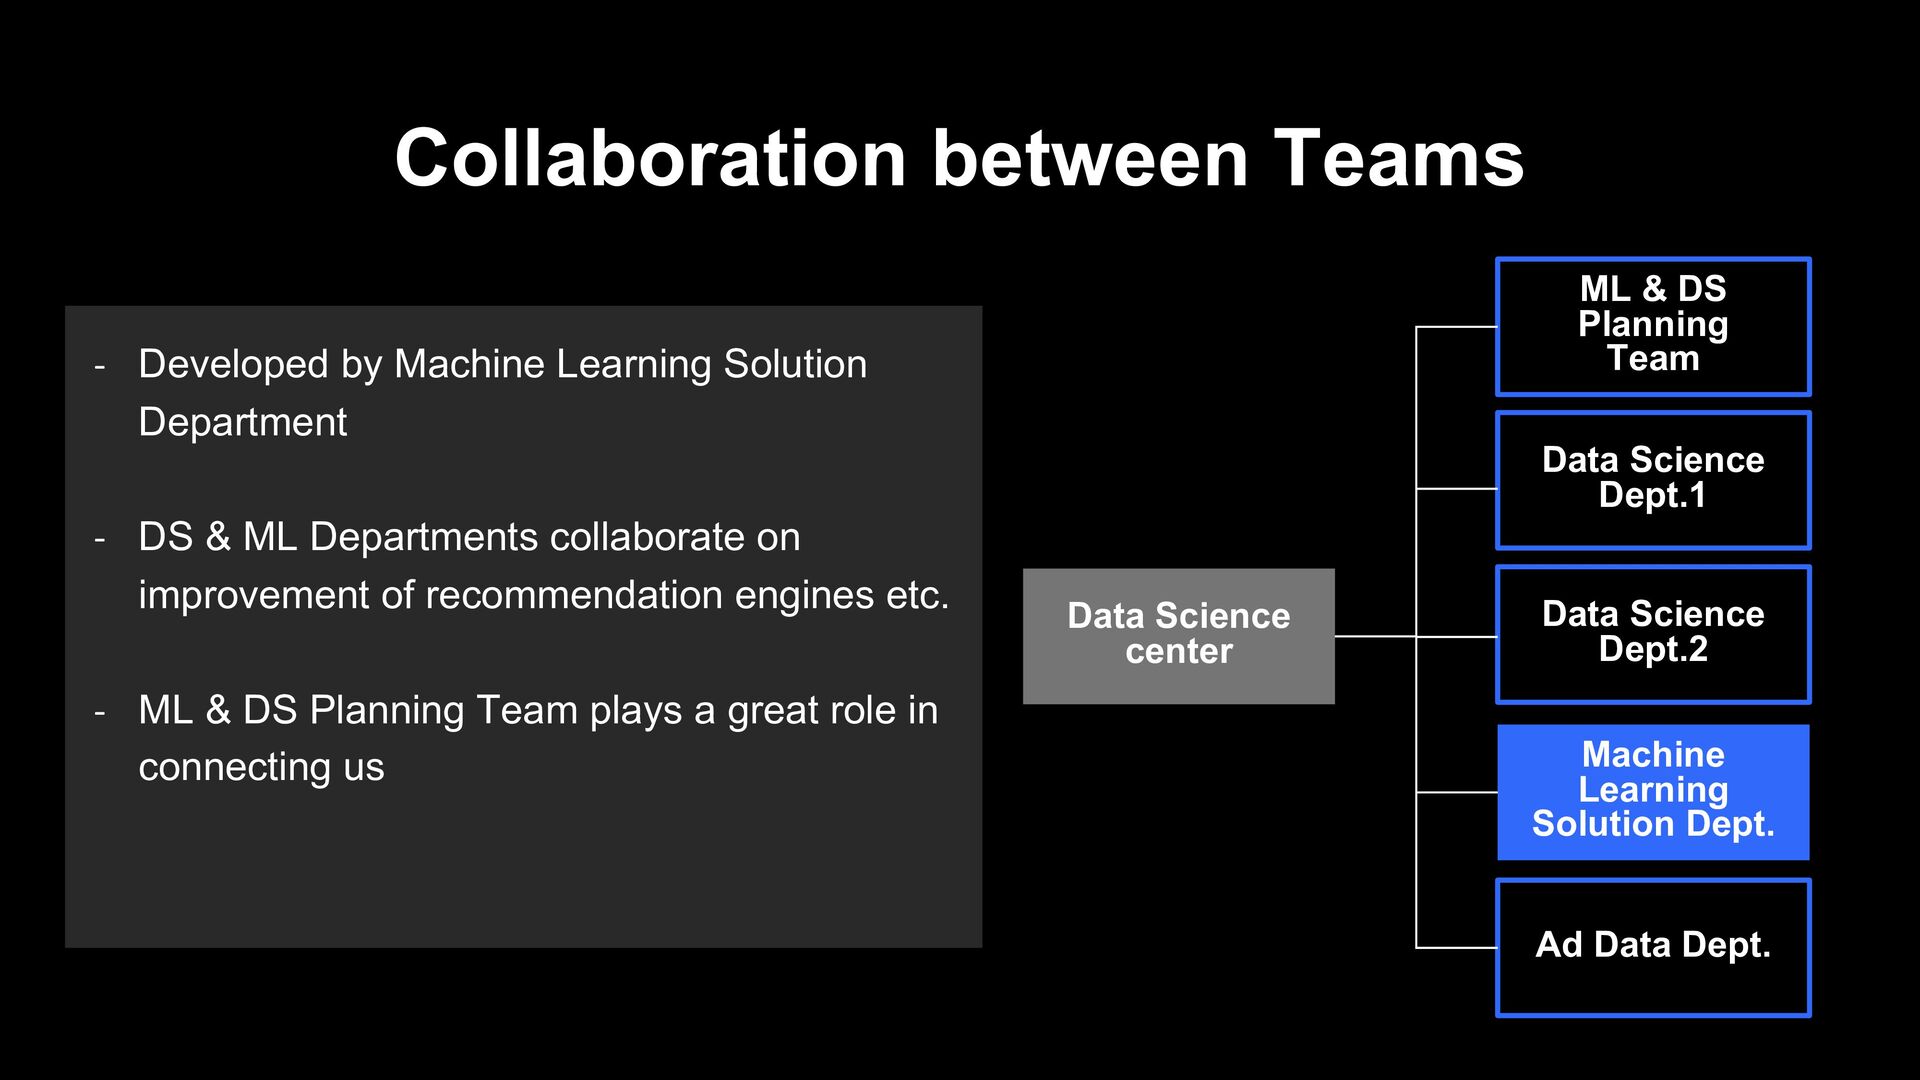
center Data Science Dept.2 Machine Learning Solution Dept. Data Science Dept.1 Ad Data Dept. - Developed by Machine Learning Solution Department - DS & ML Departments collaborate on improvement of recommendation engines etc. - ML & DS Planning Team plays a great role in connecting us
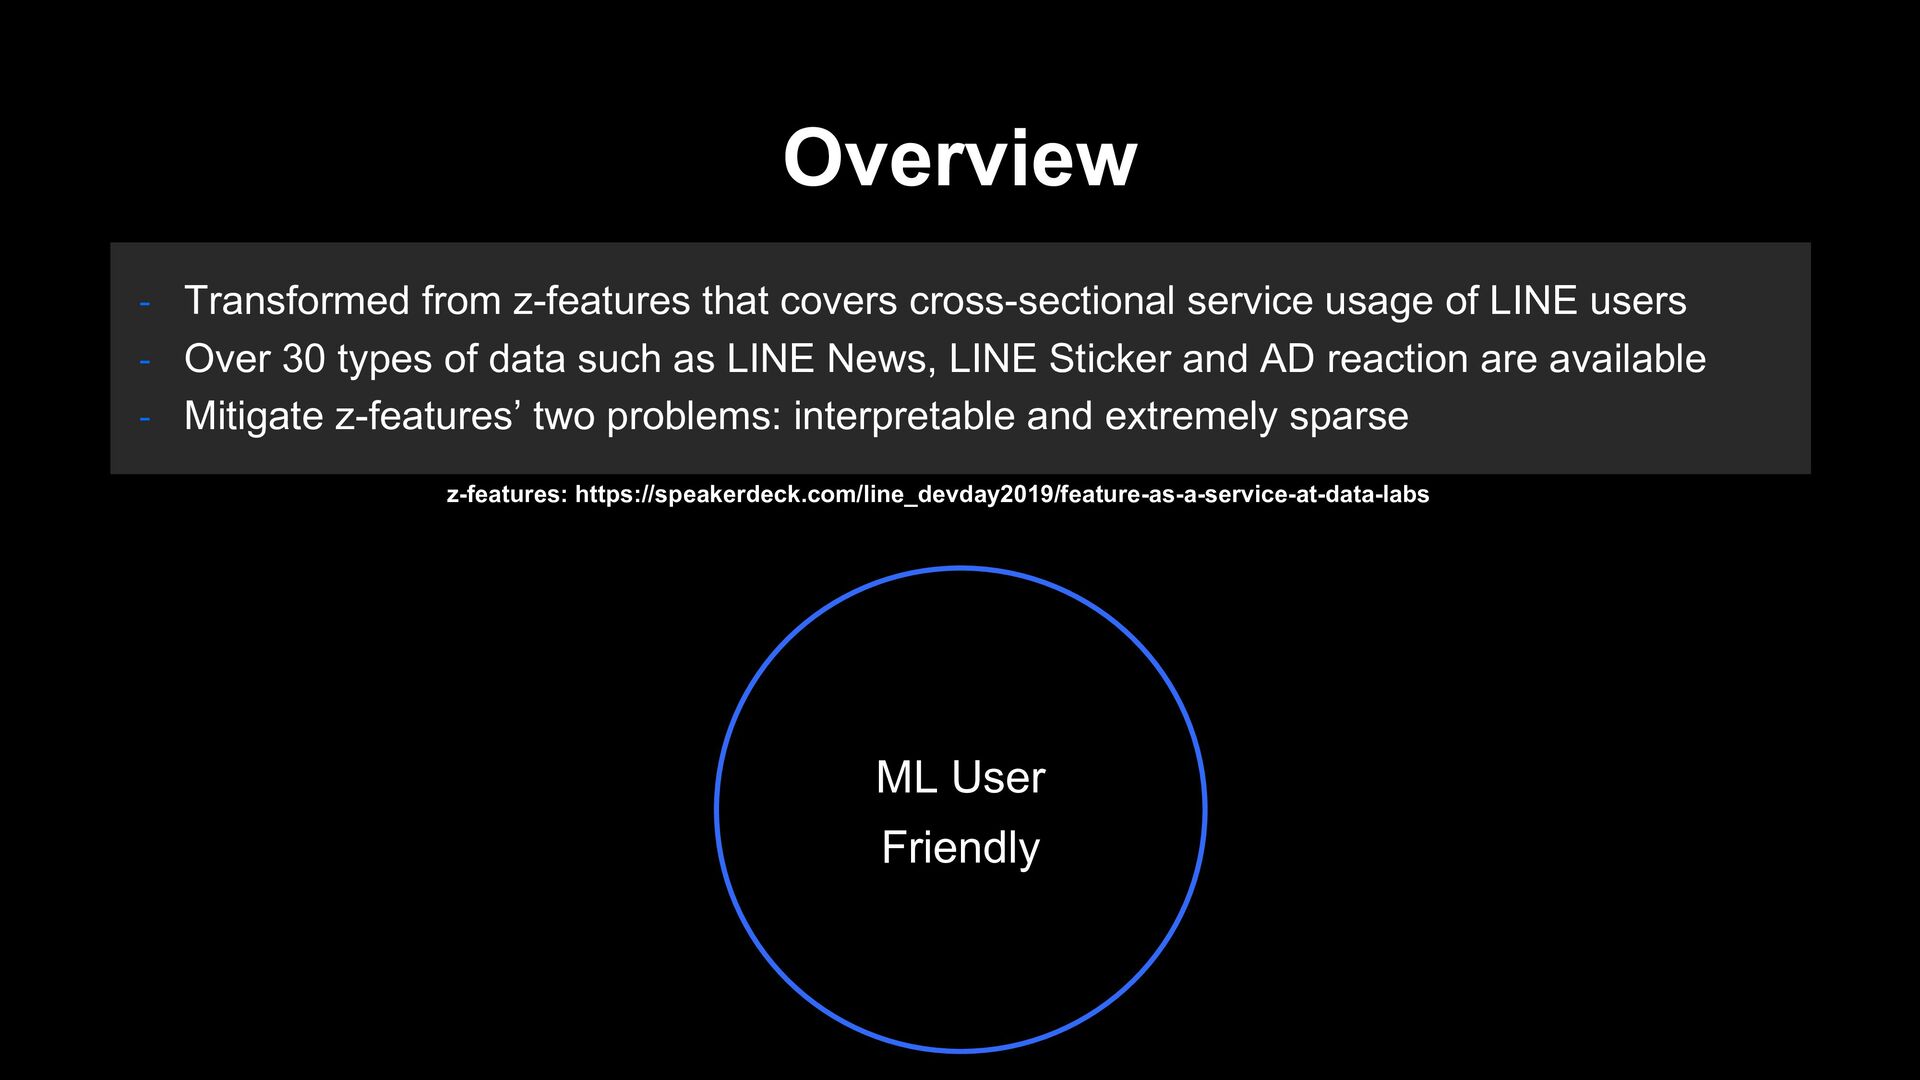
of LINE users - Over 30 types of data such as LINE News, LINE Sticker and AD reaction are available - Mitigate z-features’ two problems: interpretable and extremely sparse z-features: https://speakerdeck.com/line_devday2019/feature-as-a-service-at-data-labs ML User Friendly
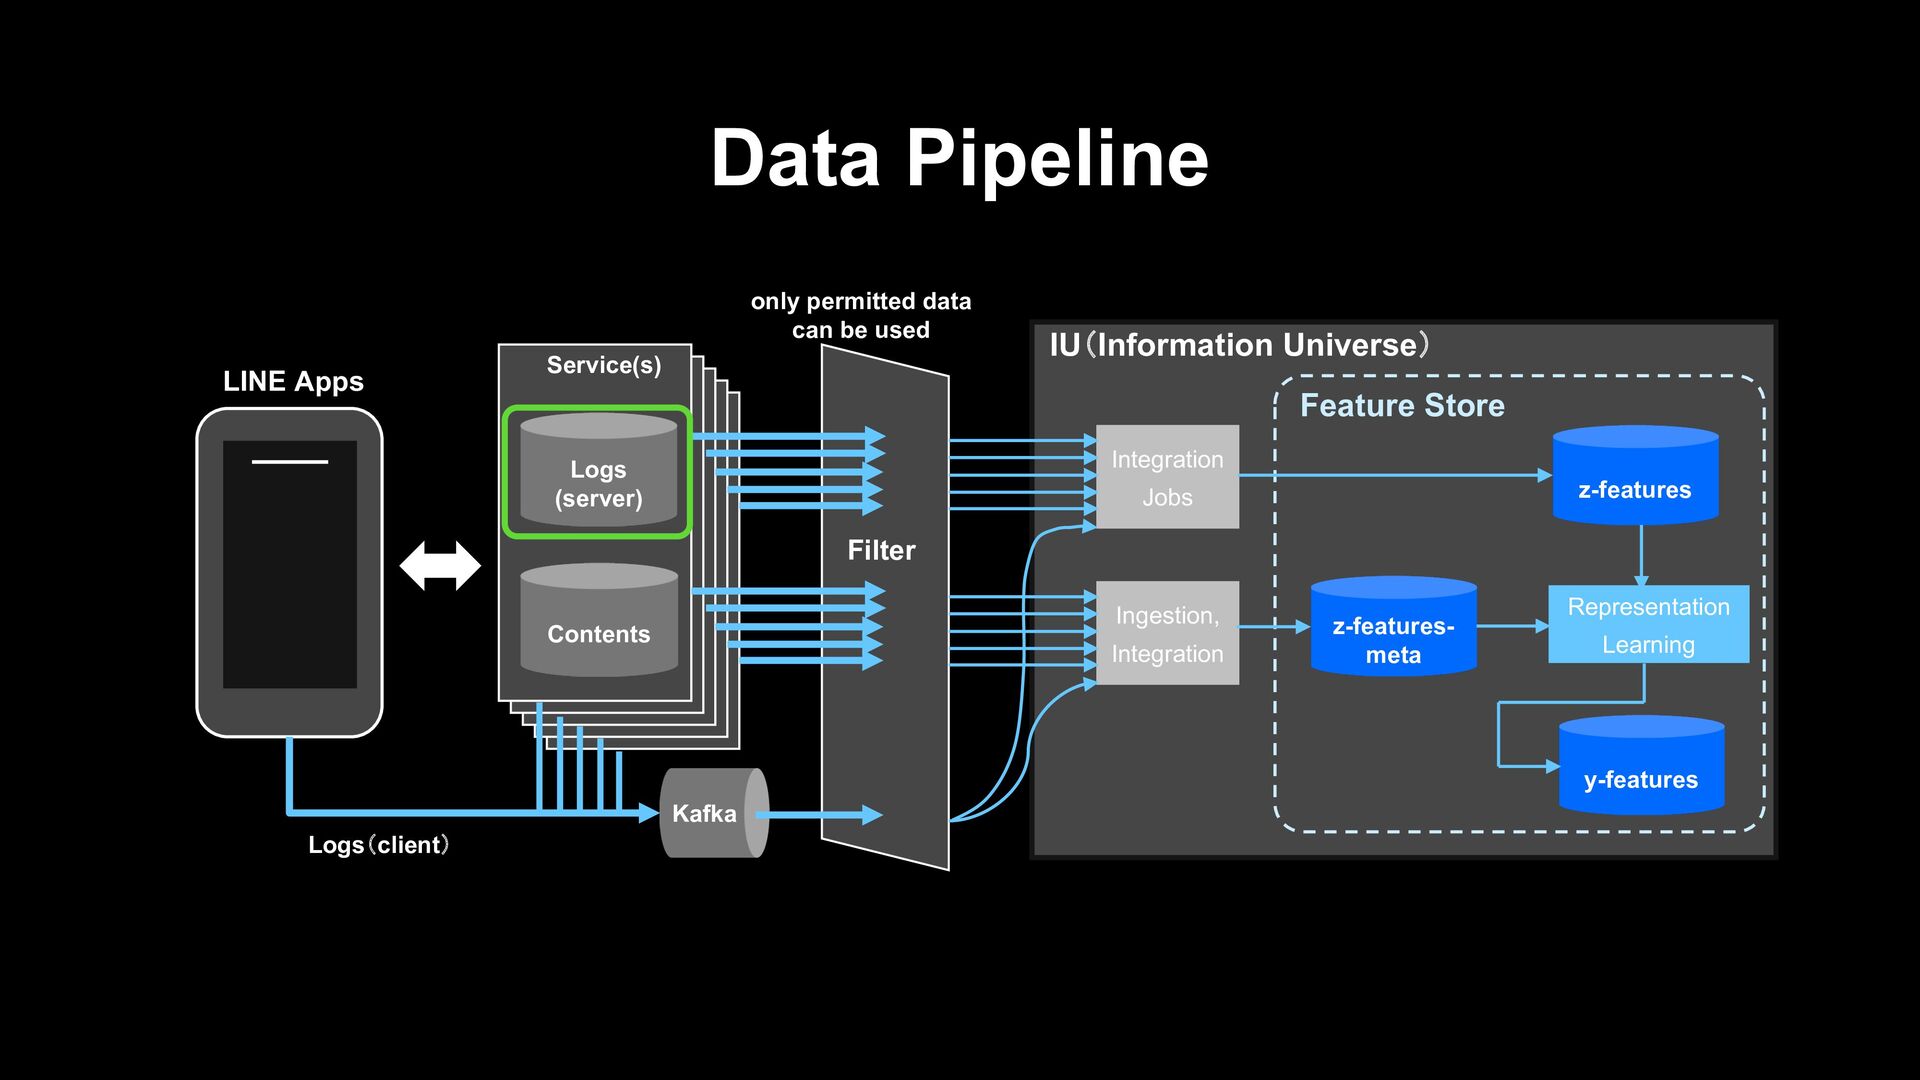
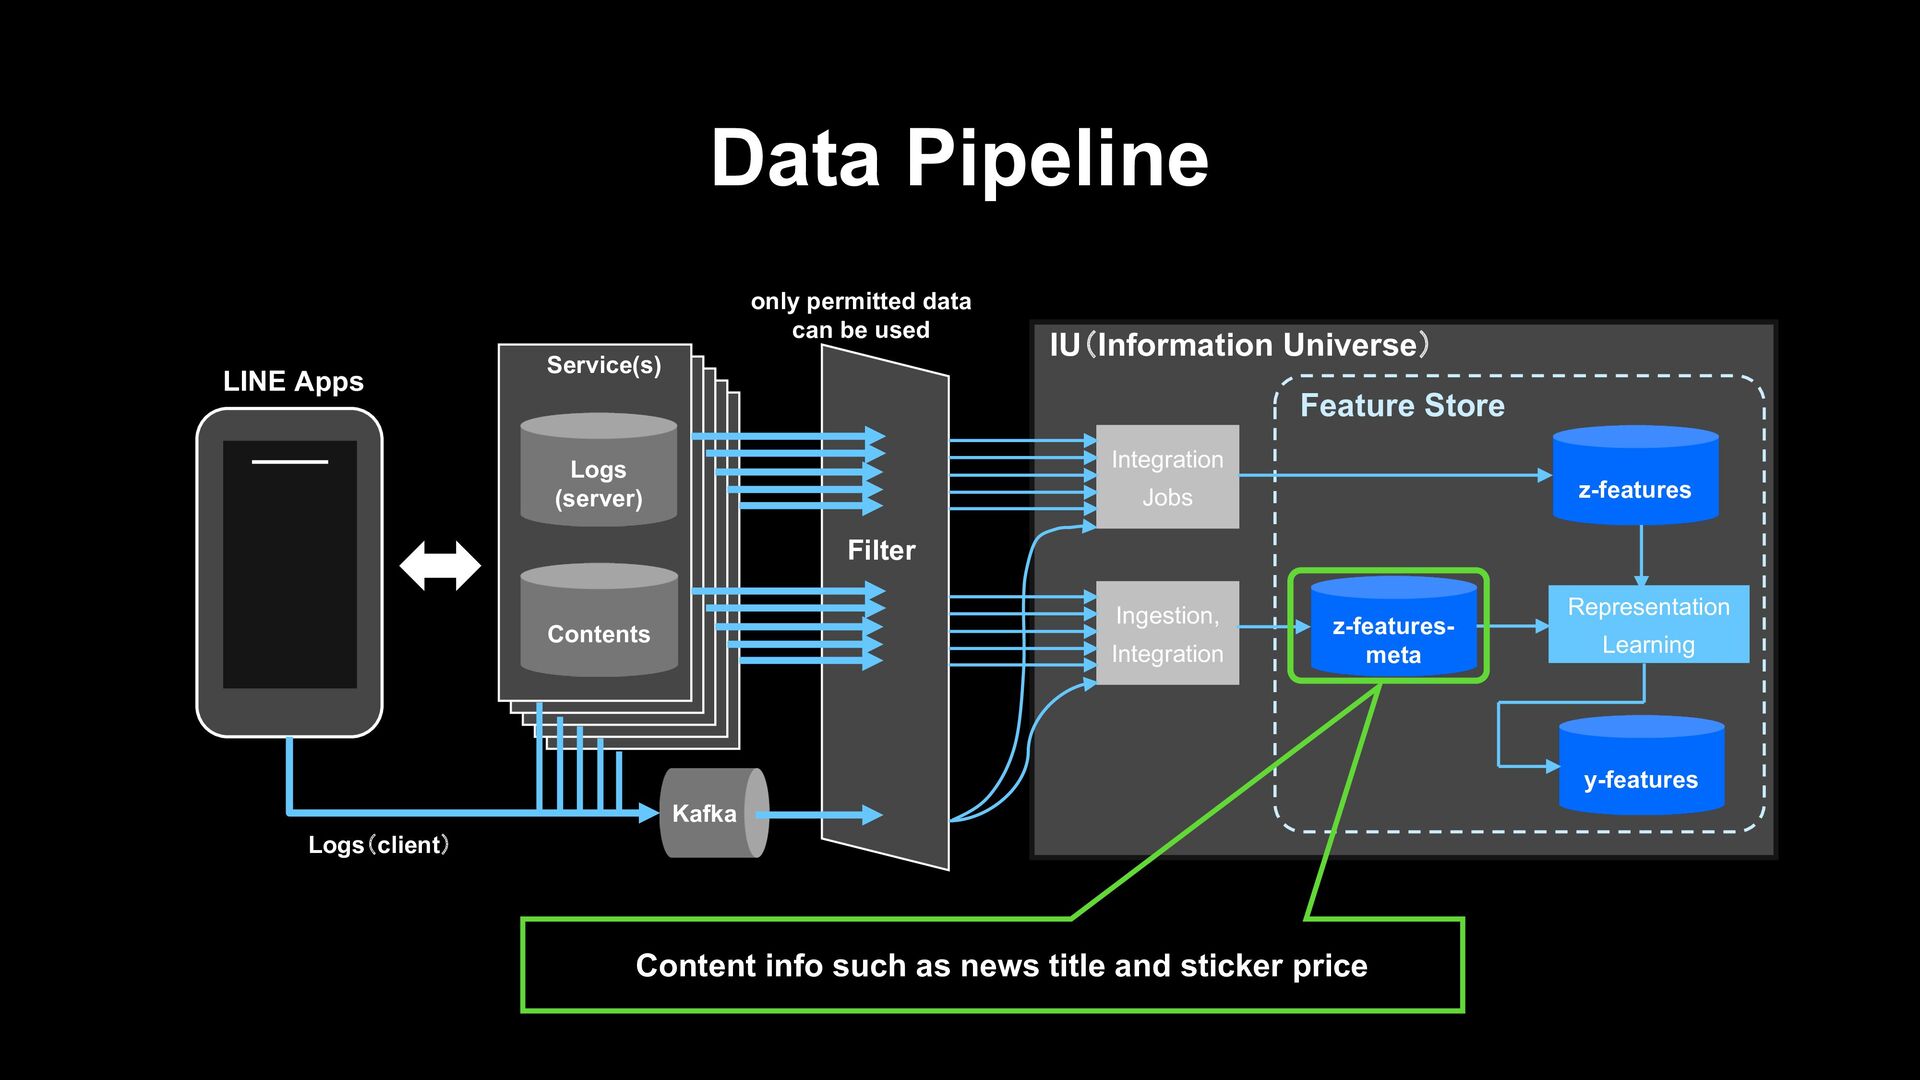
z-features y-features Representation Learning Feature Store Contents Logs (server) Service(s) Kafka LINE Apps only permitted data can be used Logs(client) Filter
z-features y-features Representation Learning Feature Store Contents Logs (server) Service(s) Kafka LINE Apps only permitted data can be used Logs(client) Filter User logs of various services that are extremely sparse
z-features y-features Representation Learning Feature Store Contents Logs (server) Service(s) Kafka LINE Apps only permitted data can be used Logs(client) Filter
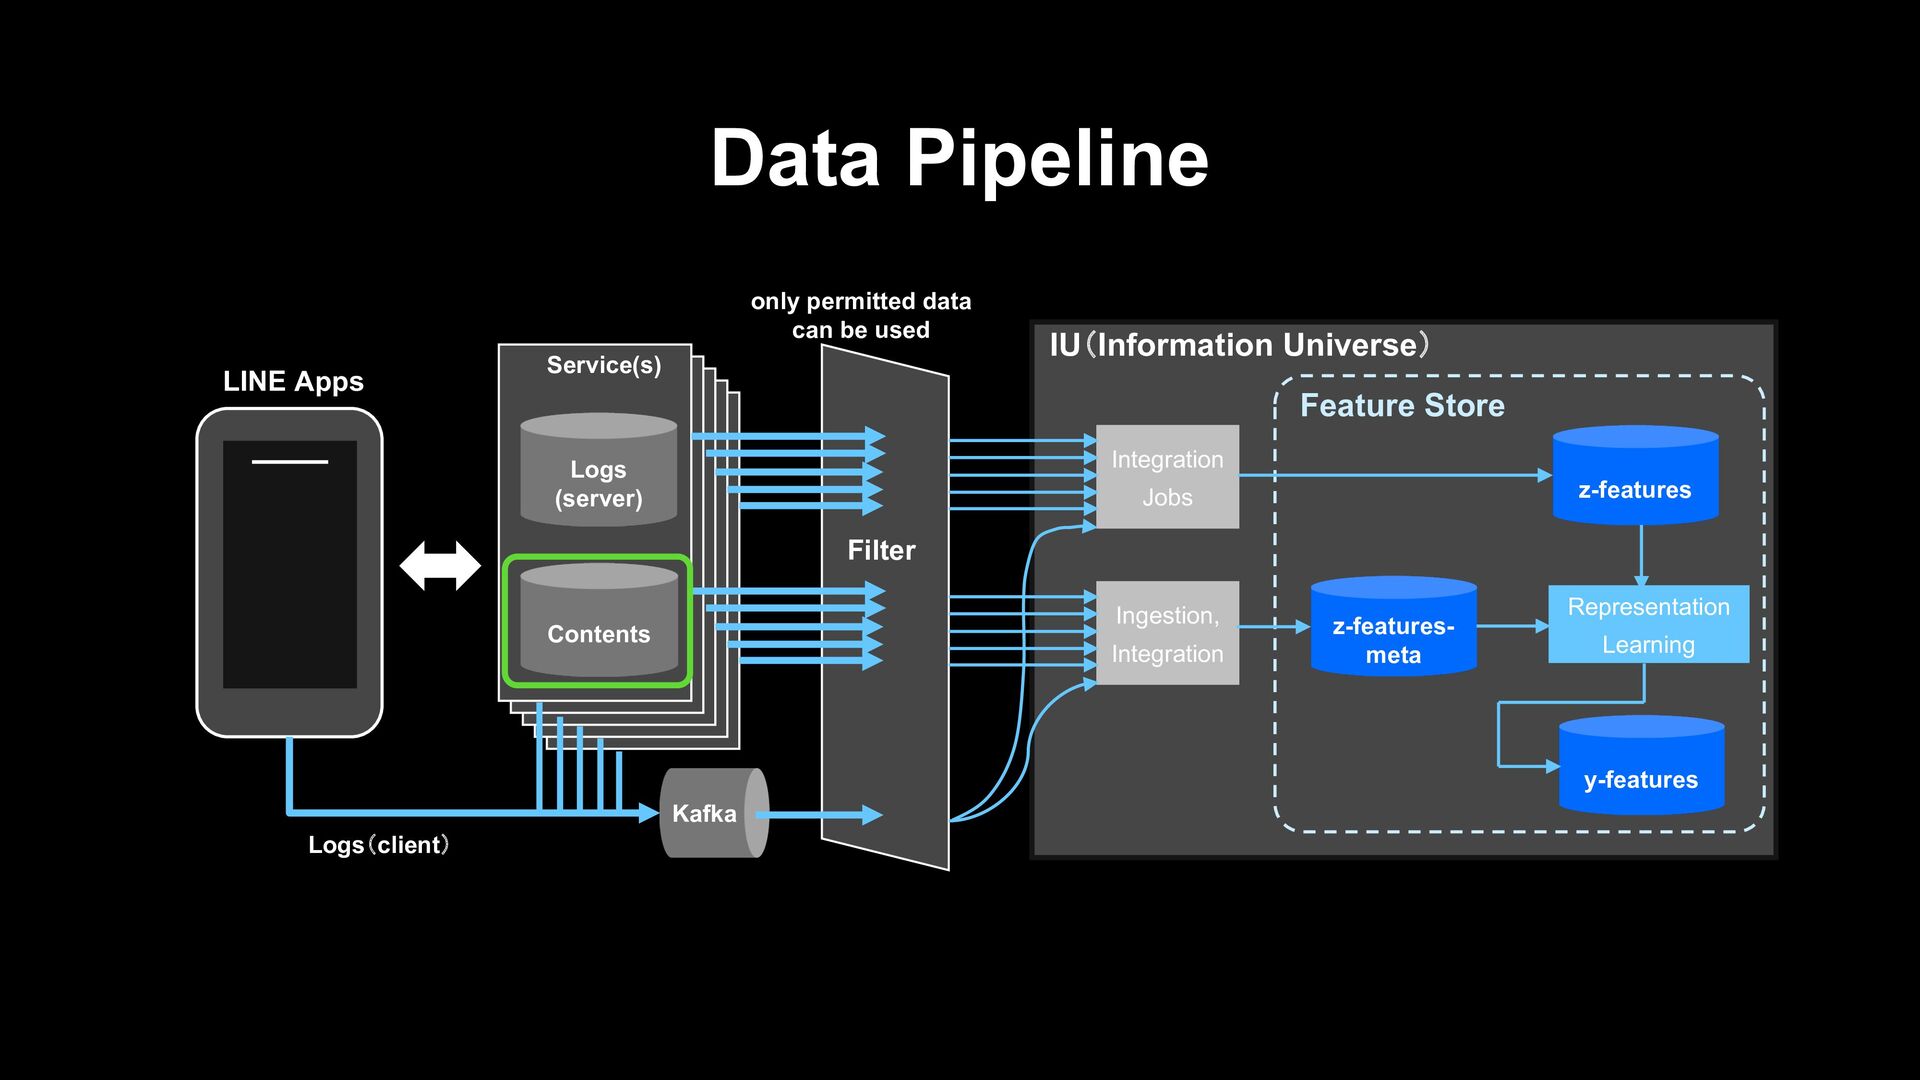
z-features y-features Representation Learning Feature Store Contents Logs (server) Service(s) Kafka LINE Apps only permitted data can be used Logs(client) Filter Content info such as news title and sticker price
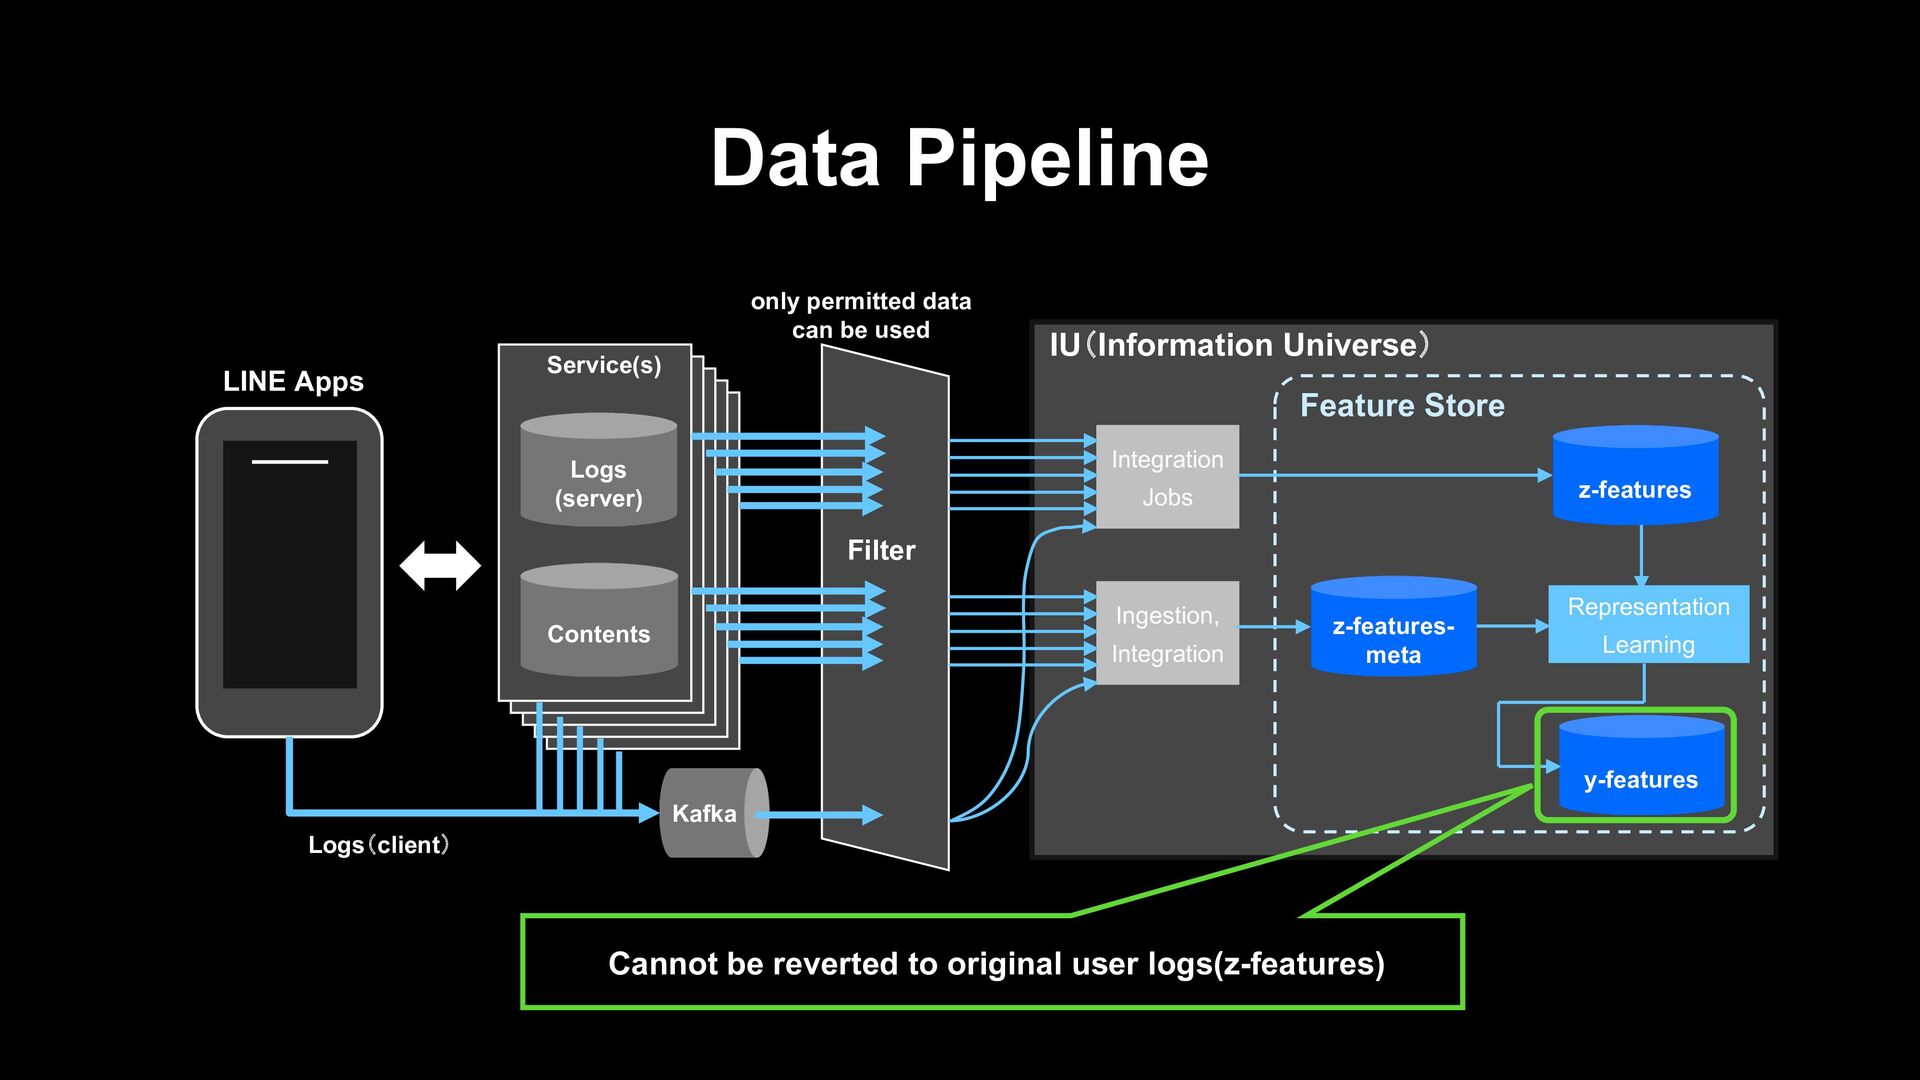
z-features y-features Representation Learning Feature Store Contents Logs (server) Service(s) Kafka LINE Apps only permitted data can be used Logs(client) Filter Dense vector of user log info is generated by GCN GCN: https://speakerdeck.com/line_devday2020/distributed-computing-library-for-big-data-ml-applications?slide=44
z-features y-features Representation Learning Feature Store Contents Logs (server) Service(s) Kafka LINE Apps only permitted data can be used Logs(client) Filter Cannot be reverted to original user logs(z-features)
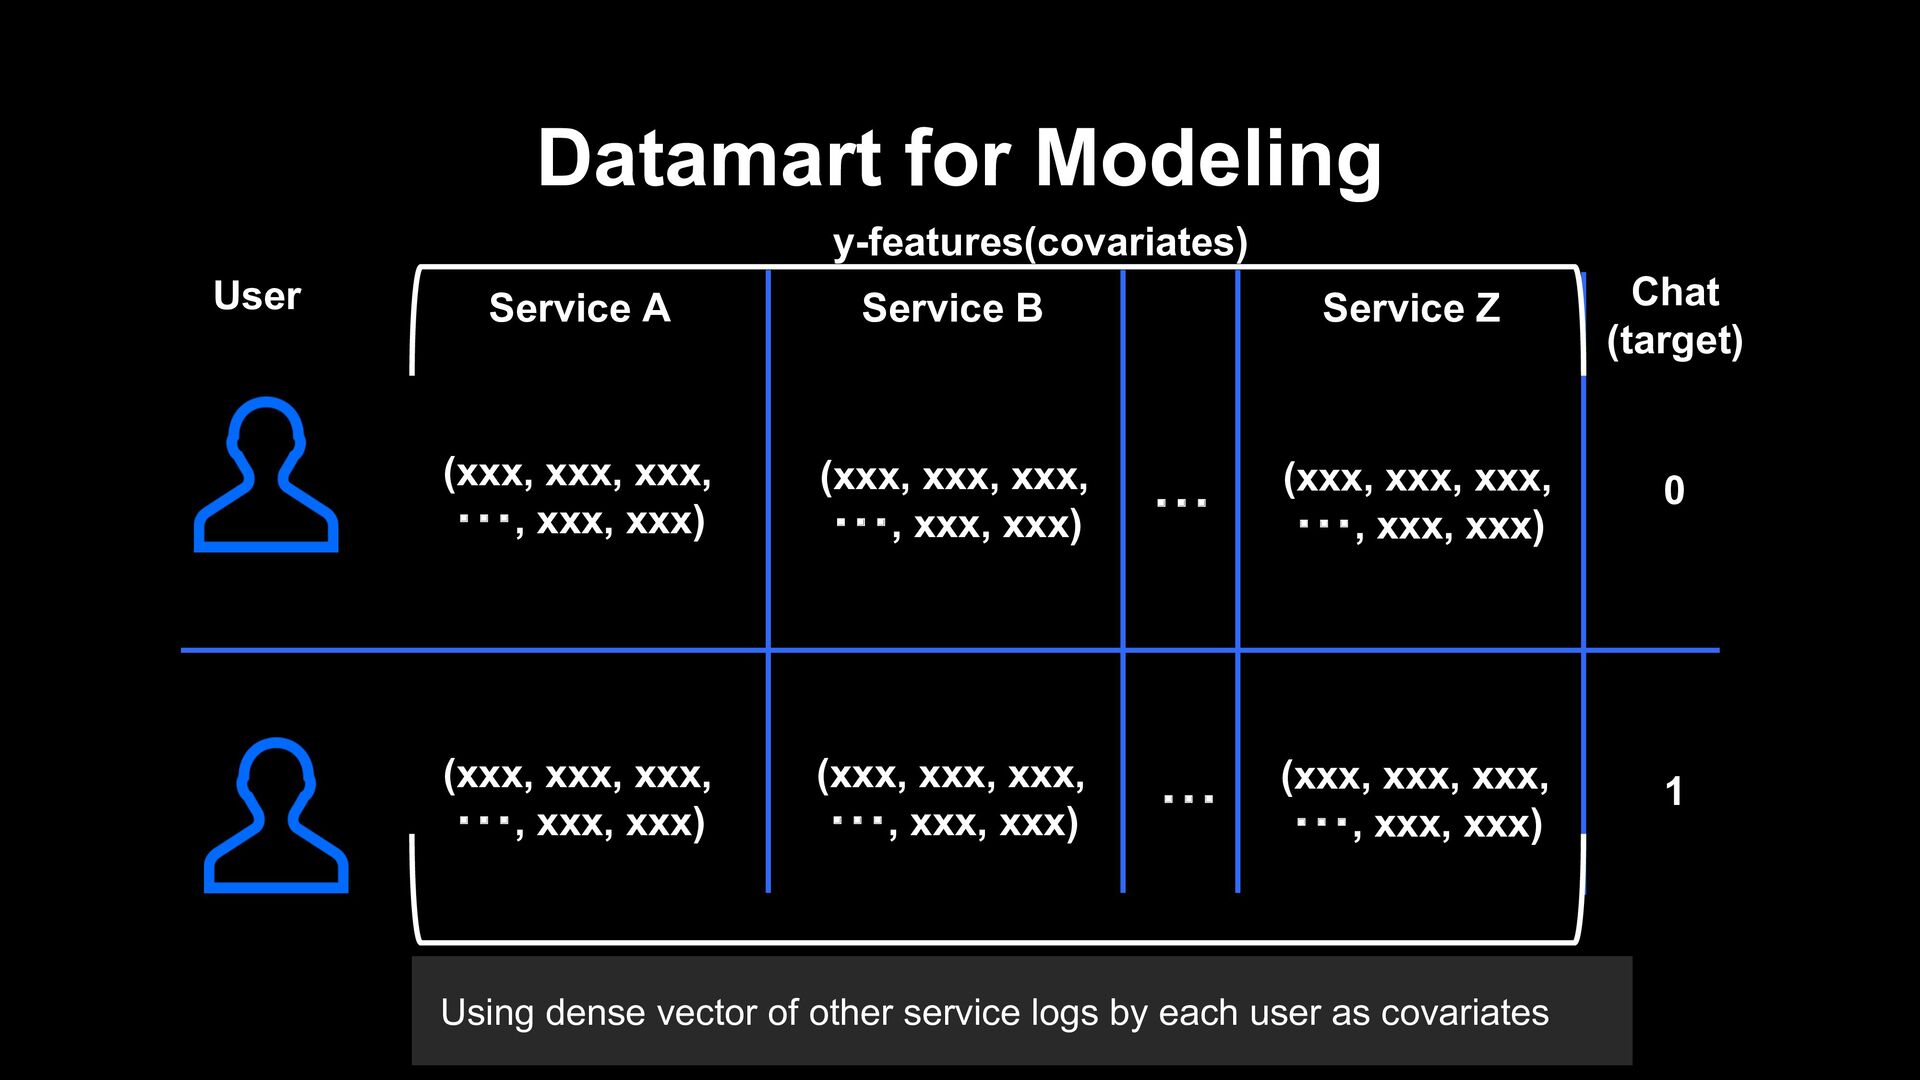
by each user as covariates Service Z (xxx, xxx, xxx, ・・・, xxx, xxx) (xxx, xxx, xxx, ・・・, xxx, xxx) (xxx, xxx, xxx, ・・・, xxx, xxx) ・・・ ・・・ (xxx, xxx, xxx, ・・・, xxx, xxx) 0 1 Service B Service A Chat (target) User y-features(covariates) (xxx, xxx, xxx, ・・・, xxx, xxx) (xxx, xxx, xxx, ・・・, xxx, xxx)
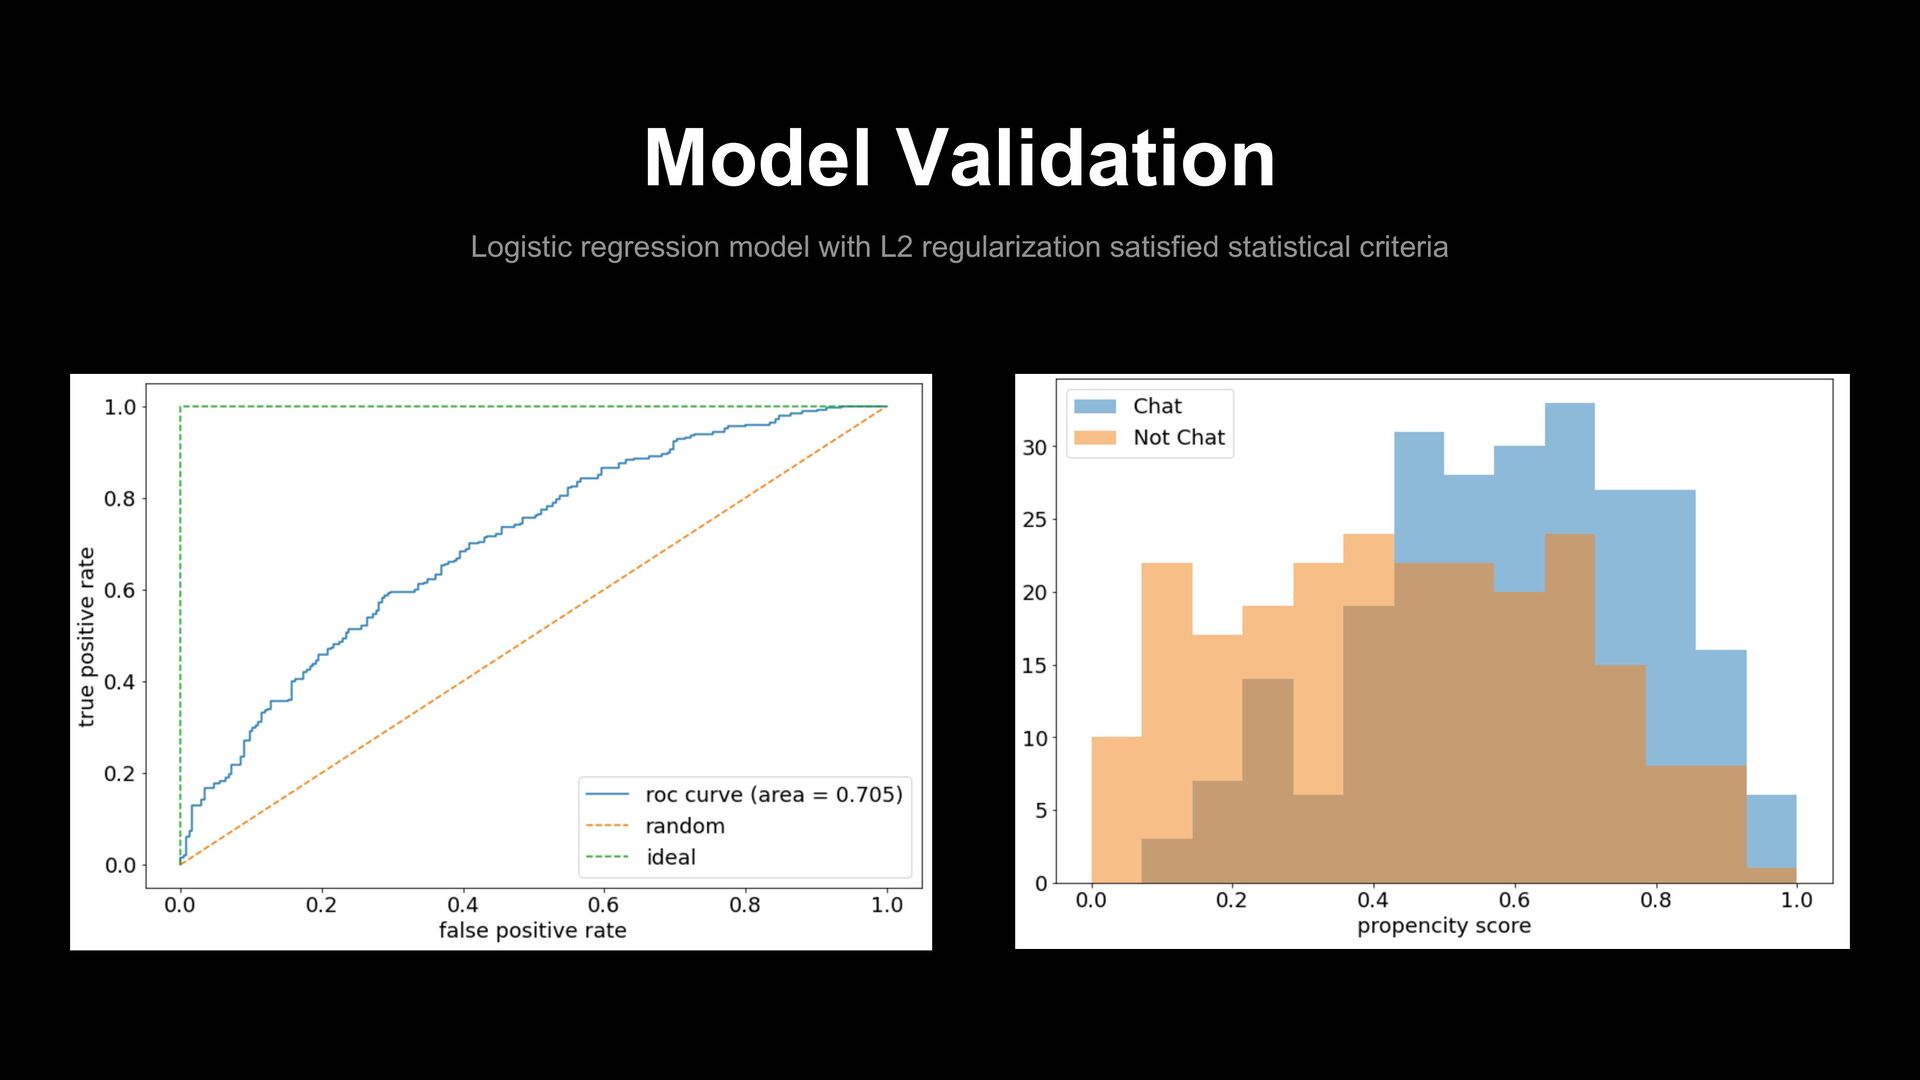
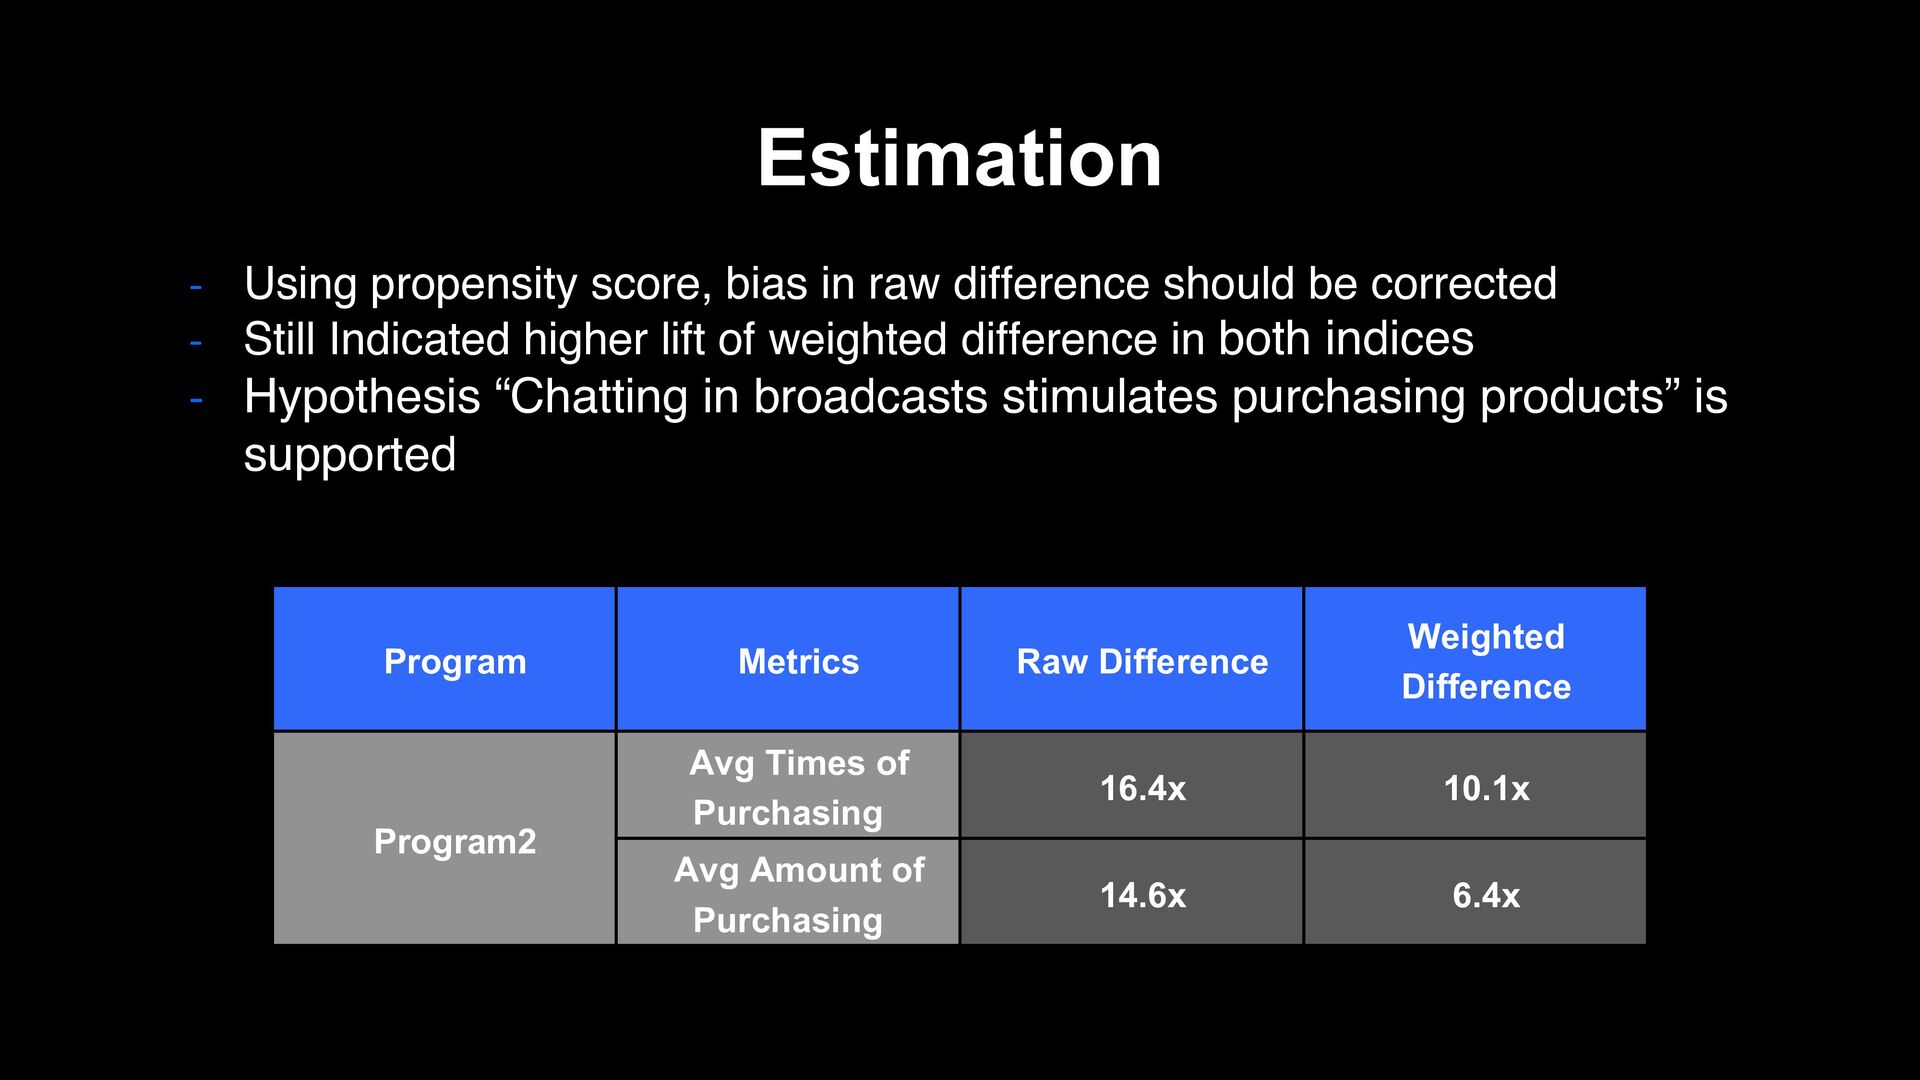
be corrected - Still Indicated higher lift of weighted difference in both indices - Hypothesis “Chatting in broadcasts stimulates purchasing products” is supported Program Metrics Raw Difference Weighted Difference Program2 Avg Times of Purchasing 16.4x 10.1x Avg Amount of Purchasing 14.6x 6.4x
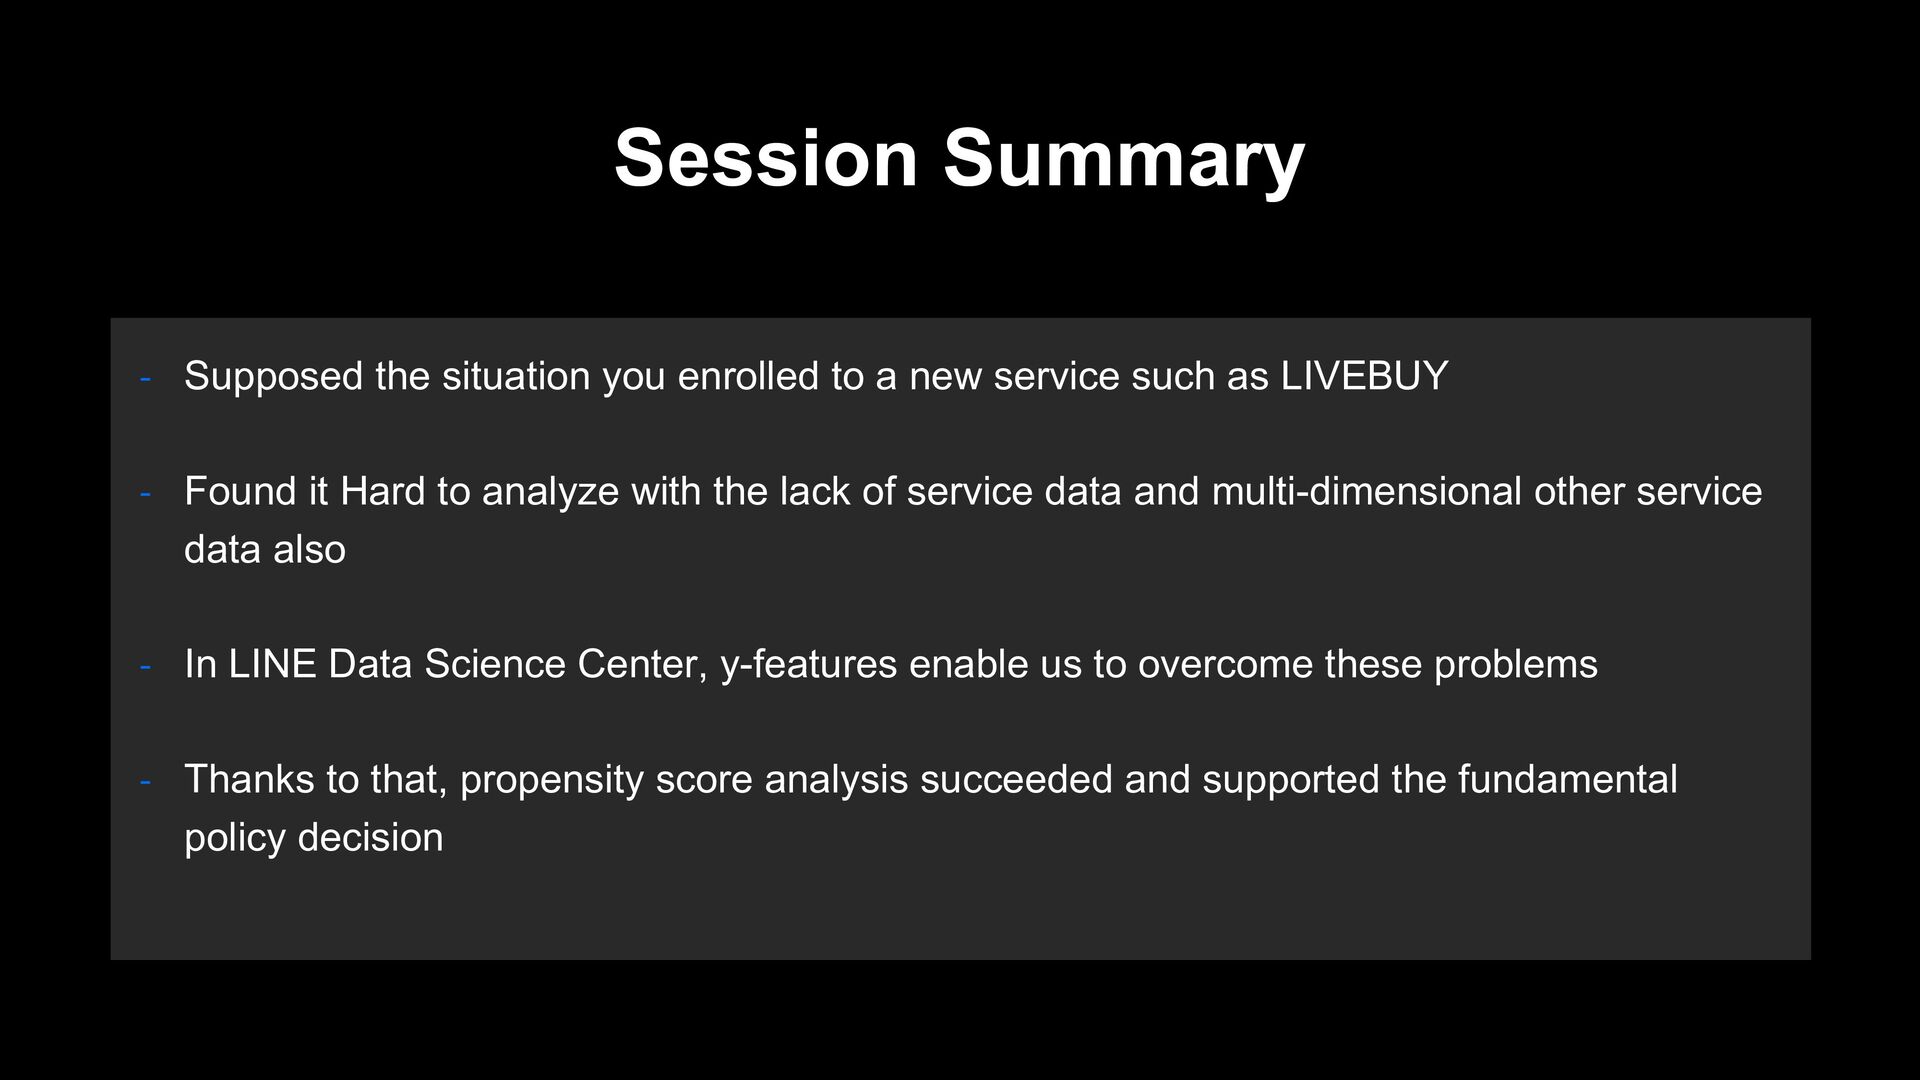
new service such as LIVEBUY - Found it Hard to analyze with the lack of service data and multi-dimensional other service data also - In LINE Data Science Center, y-features enable us to overcome these problems - Thanks to that, propensity score analysis succeeded and supported the fundamental policy decision