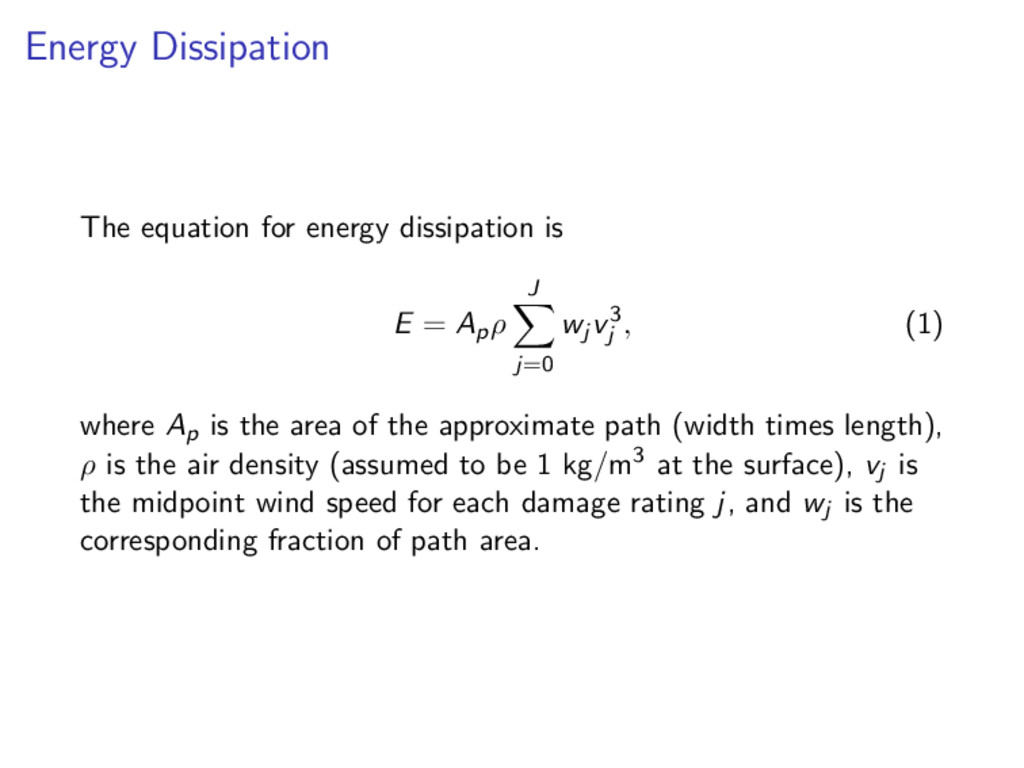
Apρ J j=0 wj v3 j , (1) where Ap is the area of the approximate path (width times length), ρ is the air density (assumed to be 1 kg/m3 at the surface), vj is the midpoint wind speed for each damage rating j, and wj is the corresponding fraction of path area.
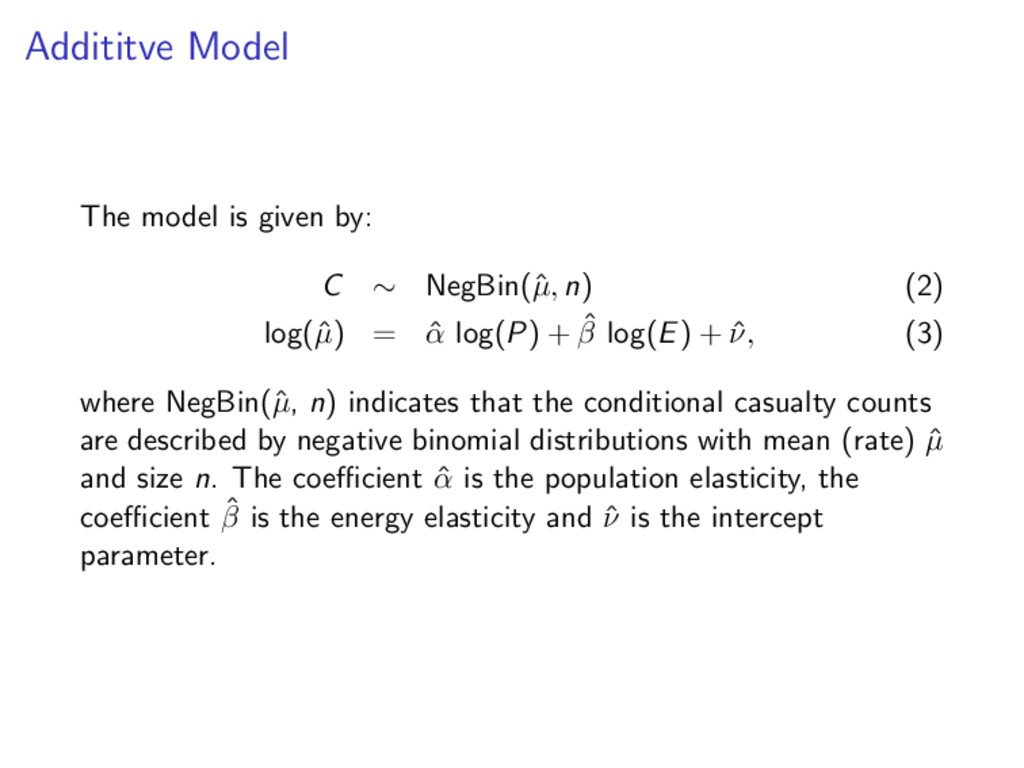
µ, n) (2) log(ˆ µ) = ˆ α log(P) + ˆ β log(E) + ˆ ν, (3) where NegBin(ˆ µ, n) indicates that the conditional casualty counts are described by negative binomial distributions with mean (rate) ˆ µ and size n. The coefficient ˆ α is the population elasticity, the coefficient ˆ β is the energy elasticity and ˆ ν is the intercept parameter.
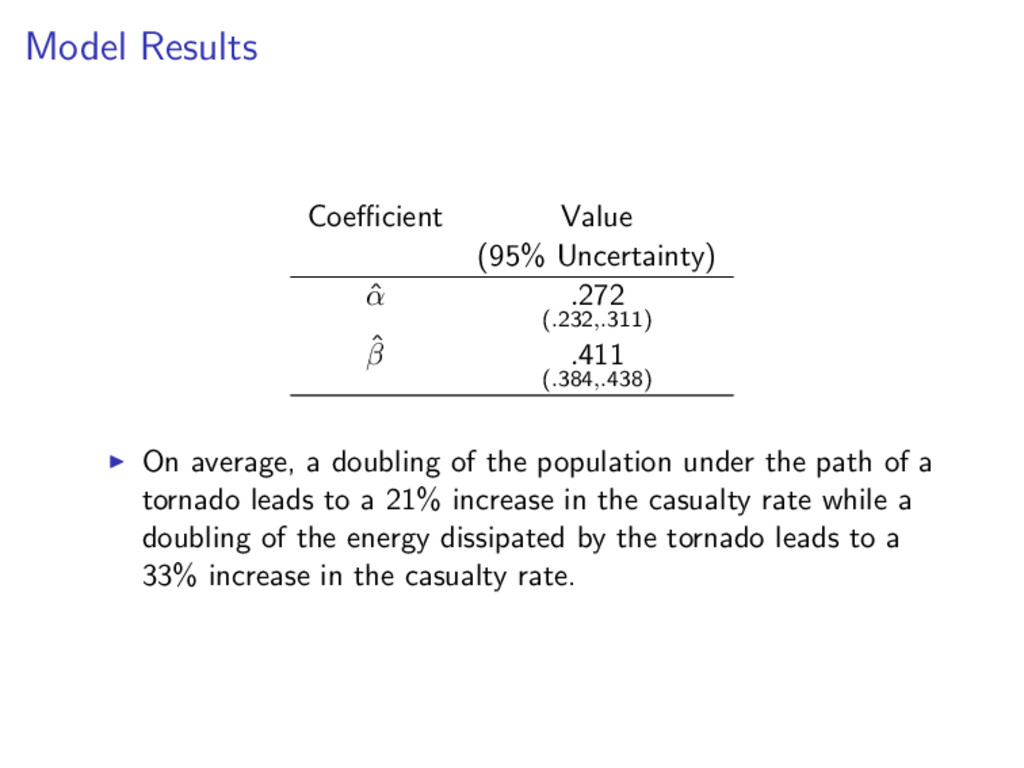
ˆ β .411 (.384,.438) On average, a doubling of the population under the path of a tornado leads to a 21% increase in the casualty rate while a doubling of the energy dissipated by the tornado leads to a 33% increase in the casualty rate.
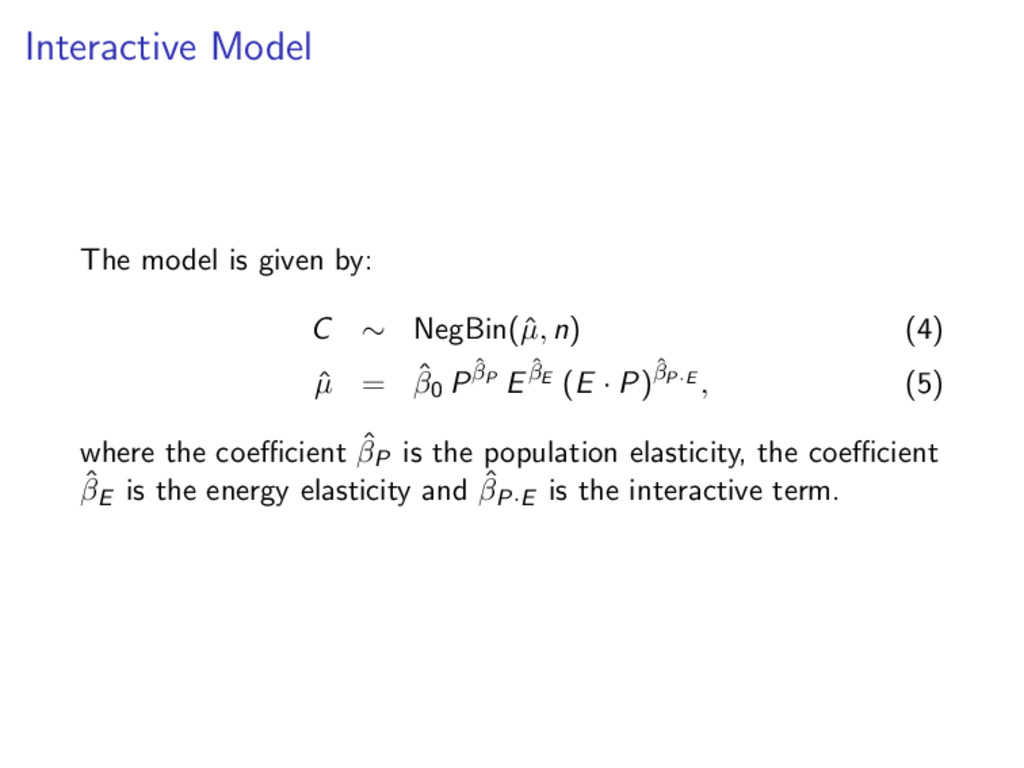
µ, n) (4) ˆ µ = ˆ β0 P ˆ βP E ˆ βE (E · P)ˆ βP·E , (5) where the coefficient ˆ βP is the population elasticity, the coefficient ˆ βE is the energy elasticity and ˆ βP·E is the interactive term.
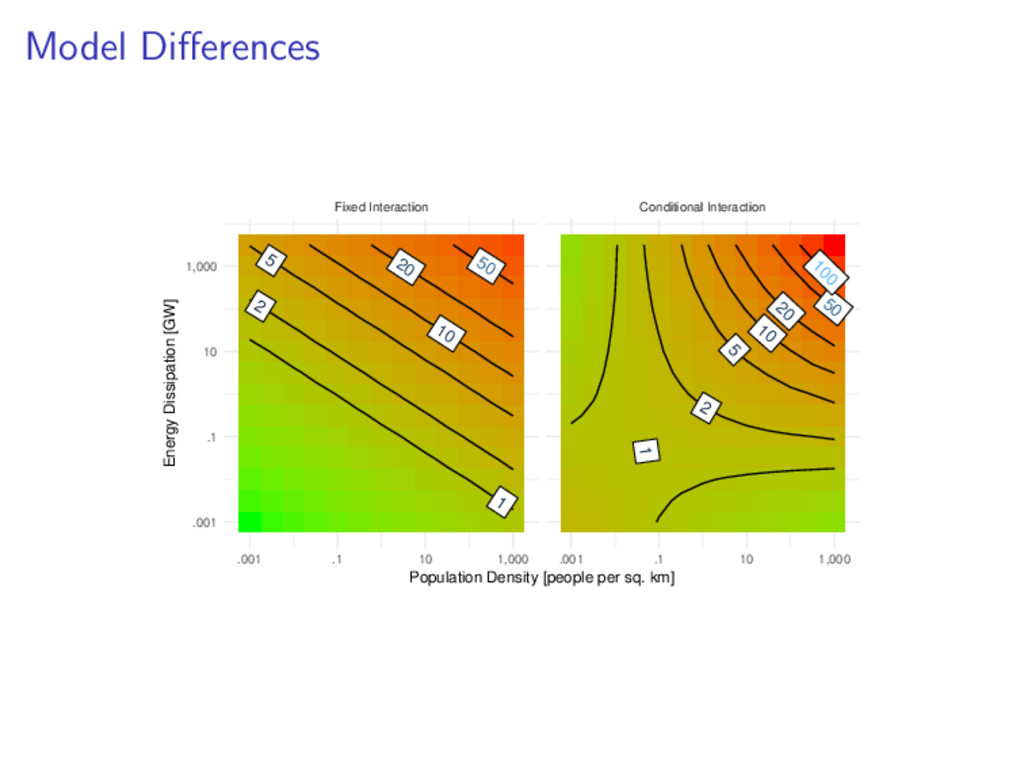
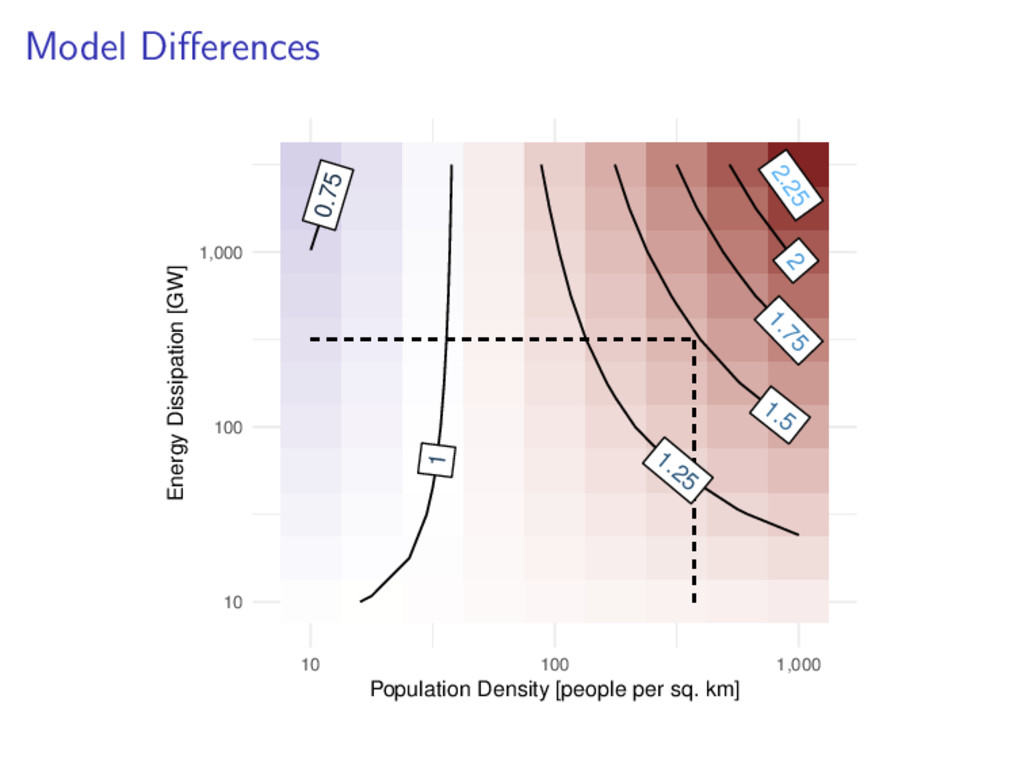
the population under the path of a tornado leads to a 21% increase in the casualty rate while a doubling of the energy dissipated by the tornado leads to a 33% increase in the casualty rate. Using an interactive model, the percentage increase in casualty rates with increasing energy dissipation increases with population density. Controlling for energy dissipation, casualty rates are substantially higher in more densely populated areas of the Mid South than in similarly populated areas elsewhere