Upgrade to Pro — share decks privately, control downloads, hide ads and more …

The Vulnerable: How Race, Age and Poverty Contribute to Tornado Casualties

Tyler Fricker
February 28, 2018

The Vulnerable: How Race, Age and Poverty Contribute to Tornado Casualties

Presented at the 2018 National Tornado Summit
Oklahoma City, OK

Tyler Fricker

February 28, 2018
Tweet

More Decks by Tyler Fricker

Other Decks in Science

Transcript

  1. The Vulnerable: How Race, Age and Poverty Contribute to Tornado

    Casualties Tyler Fricker Department of Geography, Florida State University February 28, 2018
  2. Take-Home Points A 10 mobile home increase under the path

    increases the casualty rate by 4.2% A 100 person increase in the population over 65 under the path increases the casualty rate by 1.4% A percentage increase in the white population under the path decreases the casualty rate by 25%
  3. Objectives Establish statistical estimates (and margins of error) on how

    sensitive casualties are to: Changes in population and, Changes in tornado strength Examine these sensitivities across space
  4. Population Density 0 50 100 150 200 −5 0 5

    10 Population Density Number of Tornadoes A
  5. Energy Dissipation The equation for energy dissipation is E =

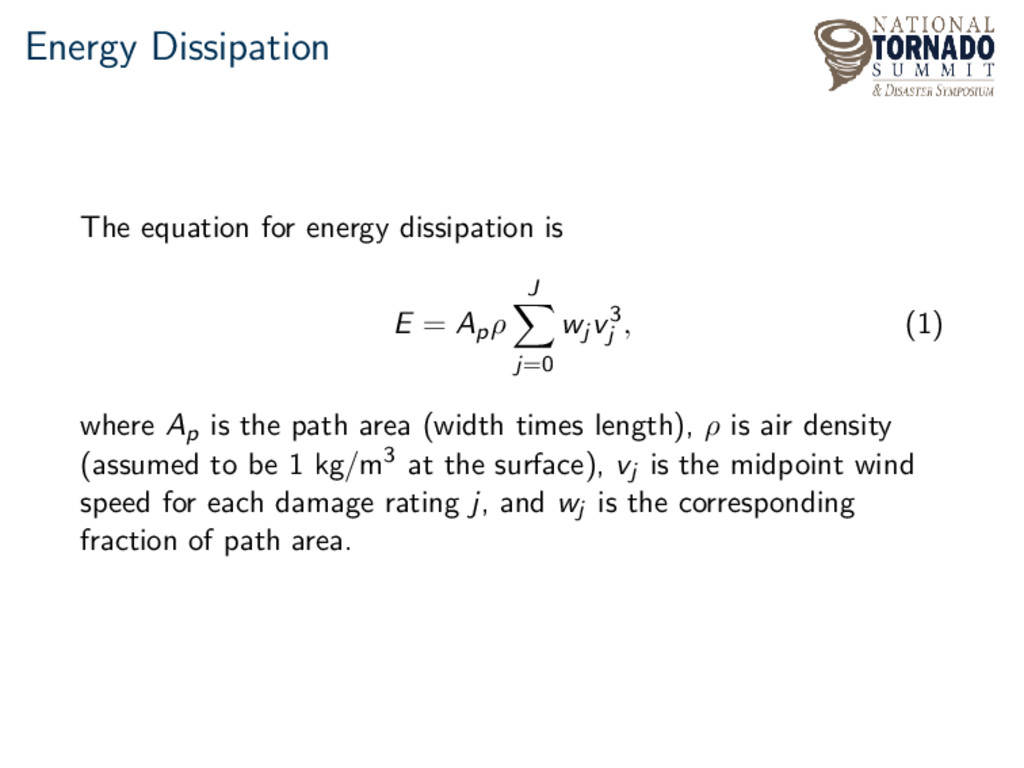
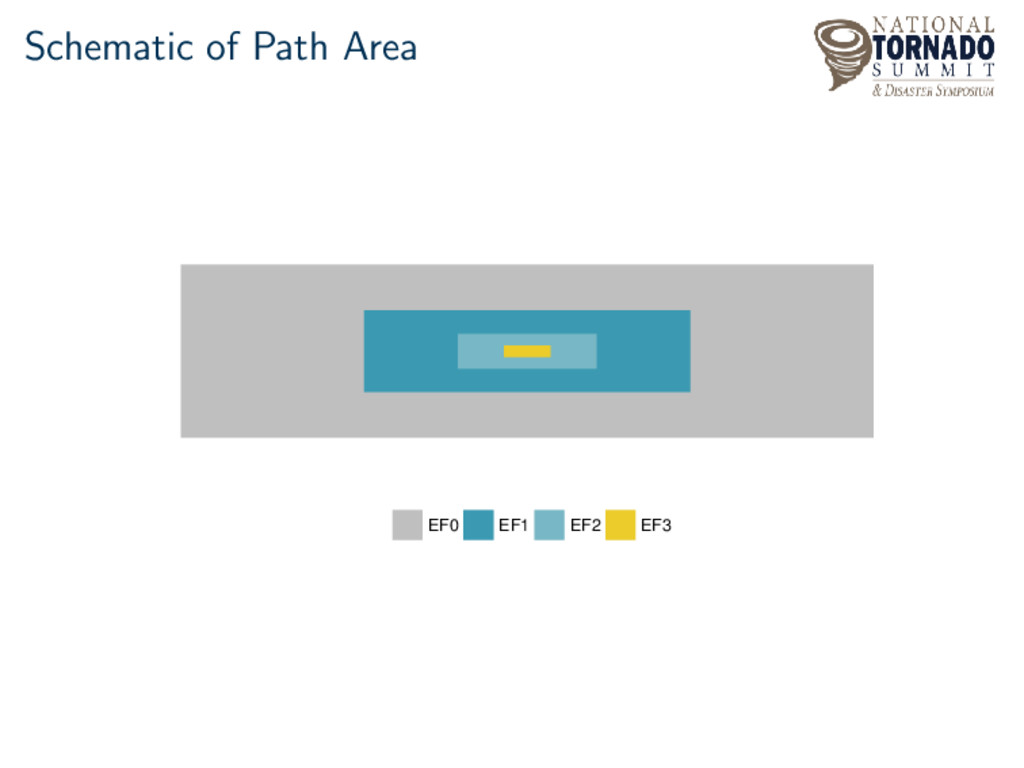
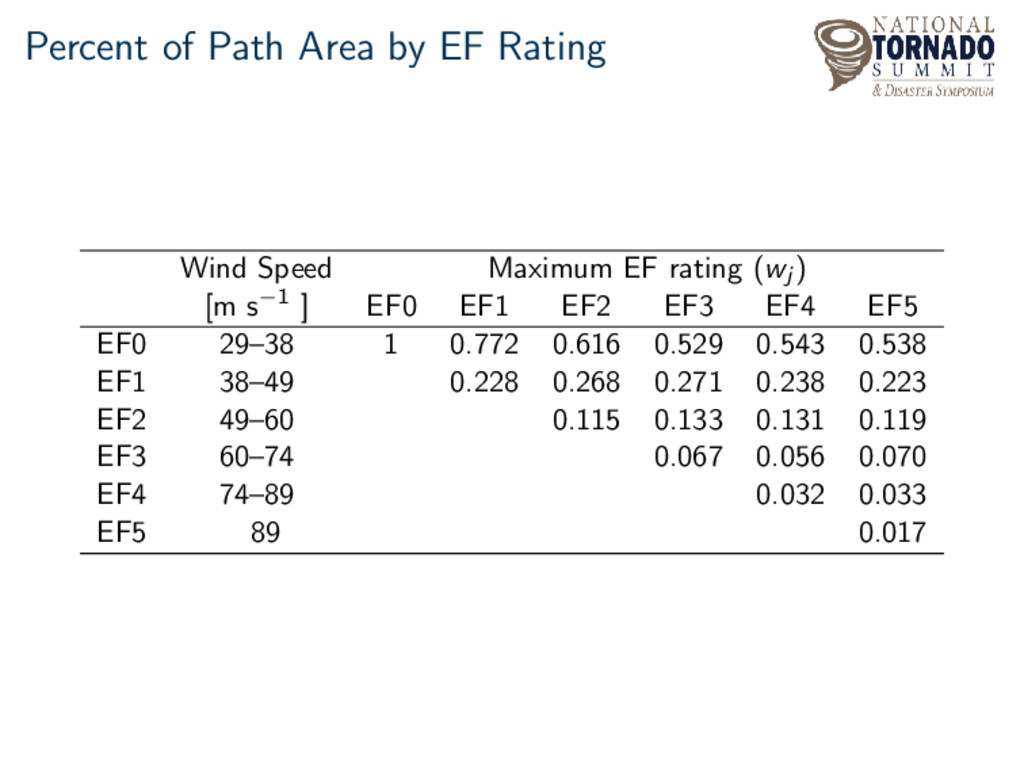
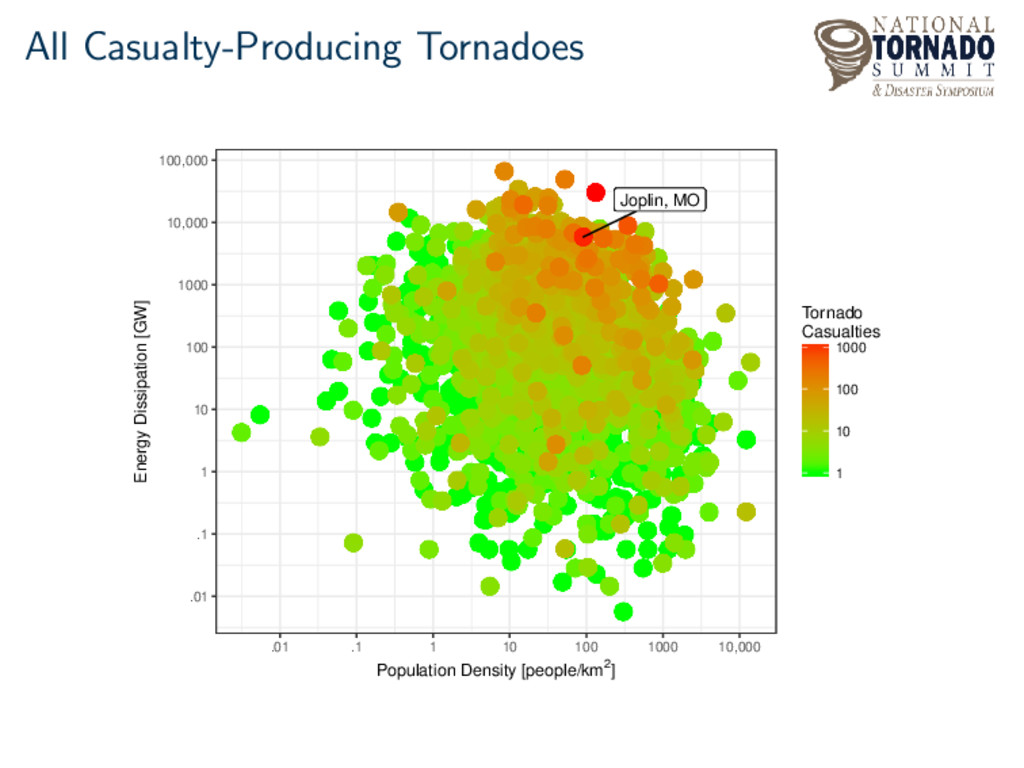
    Apρ J j=0 wj v3 j , (1) where Ap is the path area (width times length), ρ is air density (assumed to be 1 kg/m3 at the surface), vj is the midpoint wind speed for each damage rating j, and wj is the corresponding fraction of path area.
  6. Percent of Path Area by EF Rating Wind Speed Maximum

    EF rating (wj ) [m s−1 ] EF0 EF1 EF2 EF3 EF4 EF5 EF0 29–38 1 0.772 0.616 0.529 0.543 0.538 EF1 38–49 0.228 0.268 0.271 0.238 0.223 EF2 49–60 0.115 0.133 0.131 0.119 EF3 60–74 0.067 0.056 0.070 EF4 74–89 0.032 0.033 EF5 89 0.017
  7. Energy Dissipation 0 50 100 150 108 1010 1012 1014

    Energy Dissipation (W) Number of Tornadoes B
  8. May 22, 2011 Casualty-Producing Tornadoes Joplin, MO B B B

    B B B A A A A A A 10 100 1000 10 100 1000 Population Density [people/km2] Energy Dissipation [GW] 1 10 100 1000 Tornado Casualties
  9. 2011 Casualty-Producing Tornadoes Joplin, MO .1 1 10 100 1000

    10,000 100,000 1 10 100 1000 Population Density [people/km2] Energy Dissipation [GW] 1 10 100 1000 Tornado Casualties
  10. All Casualty-Producing Tornadoes Joplin, MO .01 .1 1 10 100

    1000 10,000 100,000 .01 .1 1 10 100 1000 10,000 Population Density [people/km2] Energy Dissipation [GW] 1 10 100 1000 Tornado Casualties
  11. Additive Model 1 2 5 10 20 50 .001 .1

    10 1,000 .001 .1 10 1,000 Population Density [people per sq. km] Energy Dissipation [GW]
  12. Additive Model 1 2 5 10 20 50 .001 .1

    10 1,000 .001 .1 10 1,000 Population Density [people per sq. km] Energy Dissipation [GW]
  13. Additive Model Results A doubling of the population under the

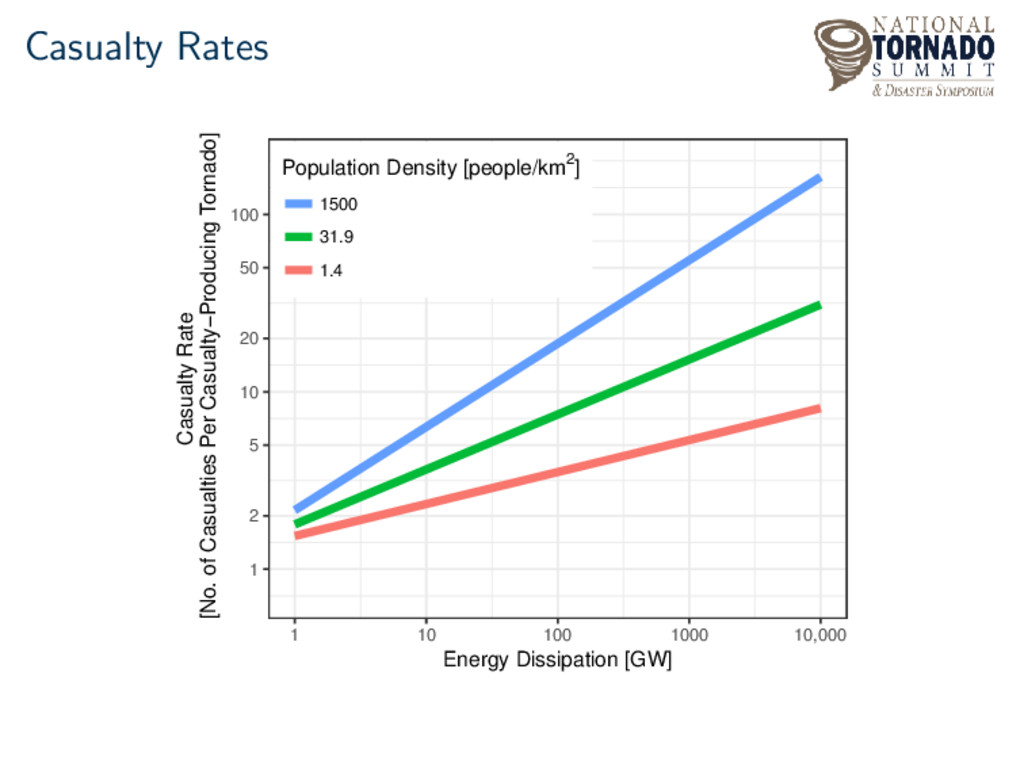
    path of a tornado leads to a 21% increase in the casualty rate A doubling of the energy dissipated by the tornado leads to a 33% increase in the casualty rate
  14. Interactive Model 1 2 5 10 20 50 .001 .1

    10 1,000 .001 .1 10 1,000 Population Density [people per sq. km] Energy Dissipation [GW]
  15. Casualty Rates 1 2 5 10 20 50 .001 .1

    10 1,000 .001 .1 10 1,000 Population Density [people per sq. km] Energy Dissipation [GW]
  16. Casualty Rates 1 2 5 10 20 50 100 1

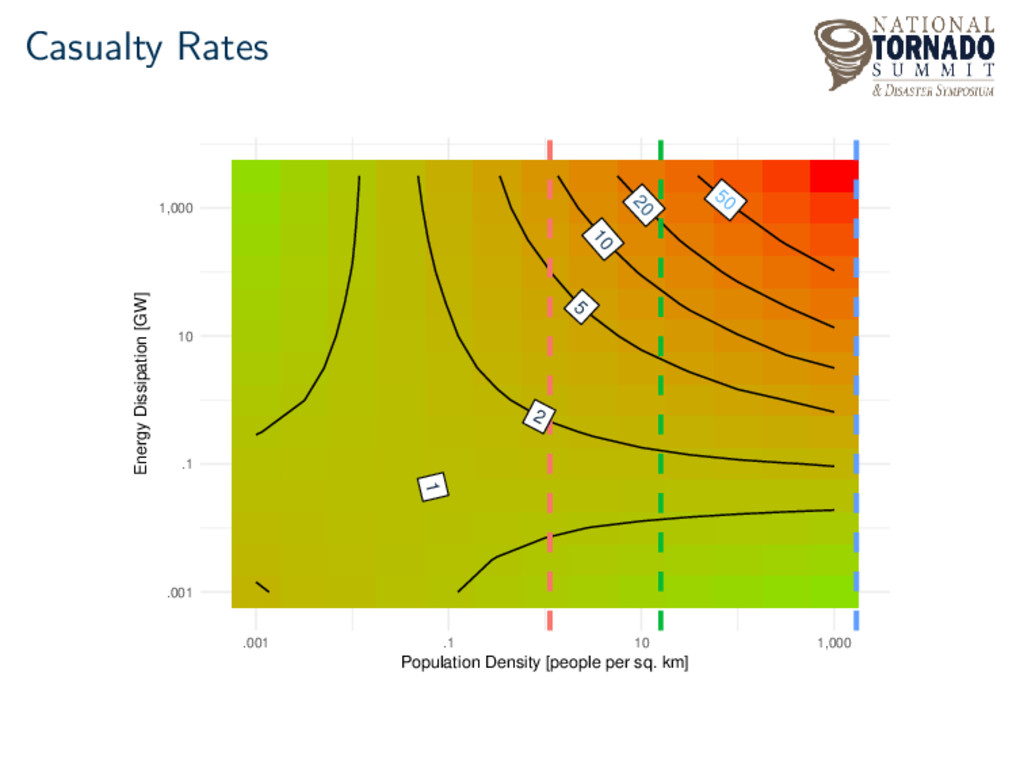
    10 100 1000 10,000 Energy Dissipation [GW] Casualty Rate [No. of Casualties Per Casualty−Producing Tornado] Population Density [people/km2] 1500 31.9 1.4
  17. Interactive Model Results The percentage increase in casualties with increasing

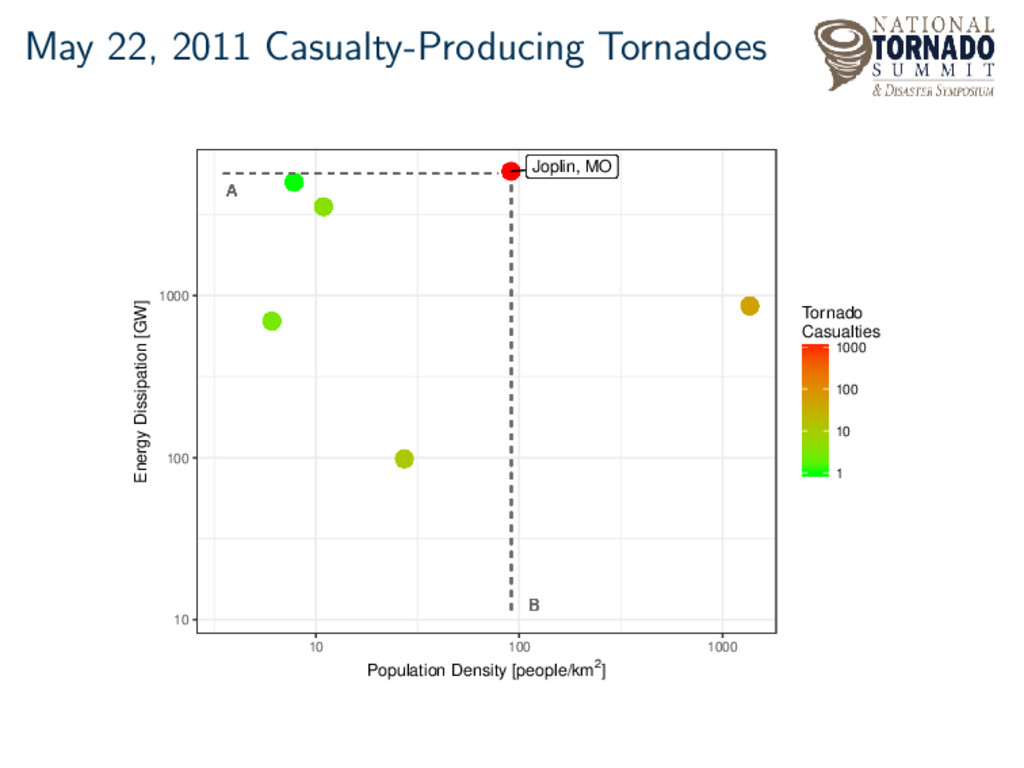
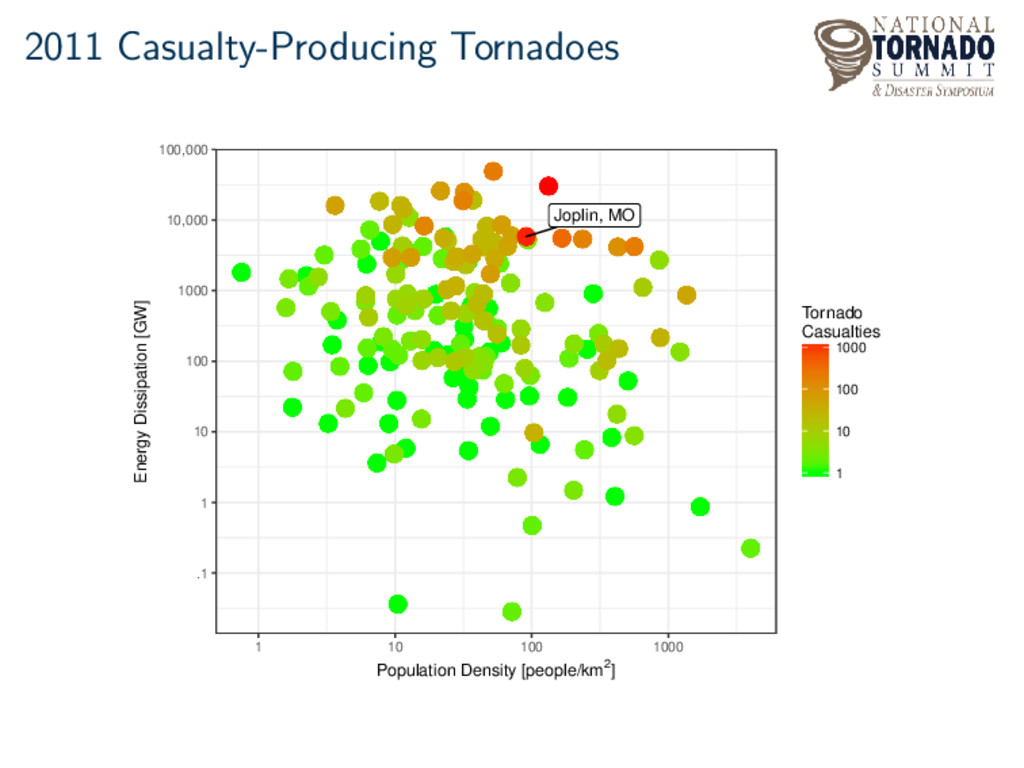
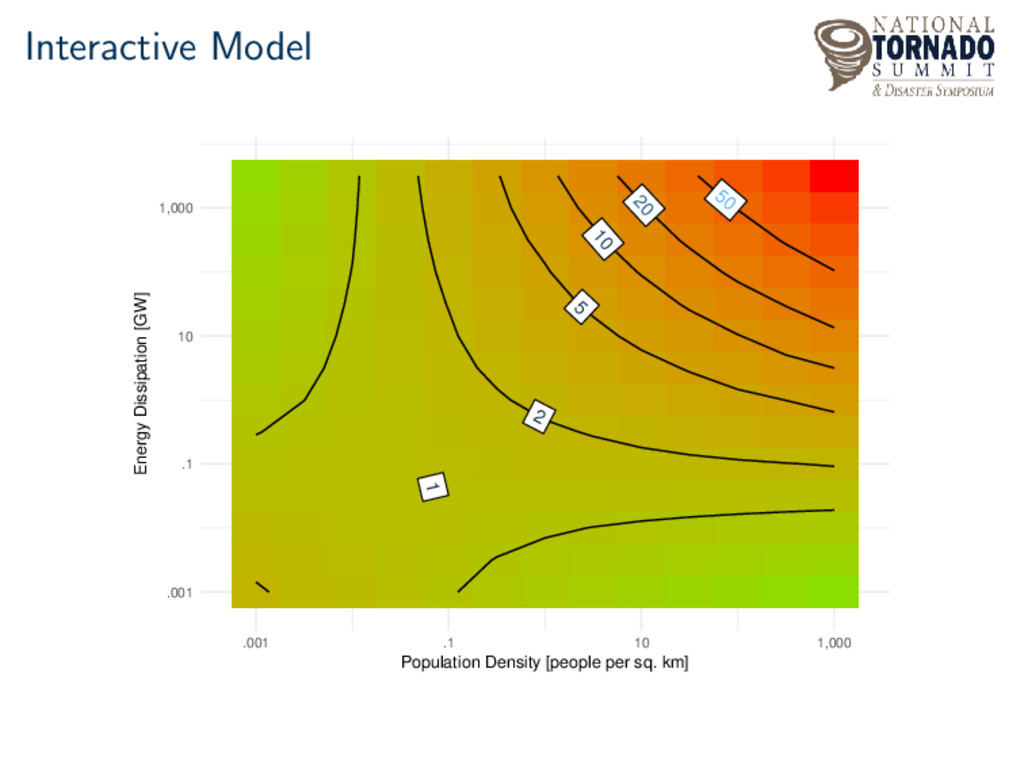
    energy dissipation increases with population density The percentage increase in casualties with increasing population density increases with energy dissipation
  18. Drilling-Down Establish estimates of socioeconomic and demographic variables at the

    tornado level Evaluate the relationship of socioeconomic and demographic variables between: Individual tornadoes Damage characteristics (casualties)
  19. Overlay Method Household Median Income (USD) < $10,000 $10,000 −

    $20,000 $20,001 − $30,000 $30,001 − $40,000 > $40,000
  20. Tornado-Level Estimates Date State Total Population Male Population Female Population

    1995-01-07 FL 972 471 501 1995-05-18 TN 1598 772 826 1999-05-03 OK 24061 11808 12253 2005-11-06 KY 4046 1949 2097 2011-04-27 AL 33729 16346 17383 2011-05-22 MO 3461 1636 1825 2011-06-01 MA 25266 12304 12962 2015-12-26 TX 5738 2813 2925
  21. Validation 0 25 50 75 0 25 50 75 Observed

    Male Deaths Estimated Male Deaths A
  22. Validation 0 25 50 75 0 25 50 75 Observed

    Female Deaths Estimated Female Deaths B
  23. Summary of Estimates Variable Mean 25th Percentile Median 75th Percentile

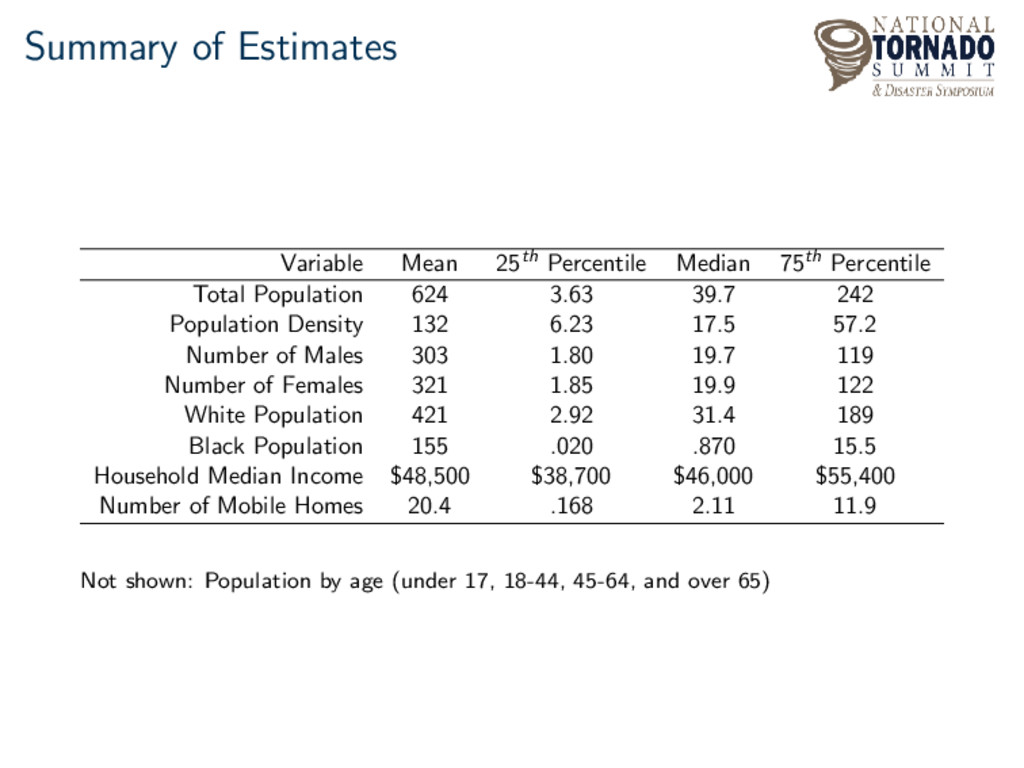
    Total Population 624 3.63 39.7 242 Population Density 132 6.23 17.5 57.2 Number of Males 303 1.80 19.7 119 Number of Females 321 1.85 19.9 122 White Population 421 2.92 31.4 189 Black Population 155 .020 .870 15.5 Household Median Income $48,500 $38,700 $46,000 $55,400 Number of Mobile Homes 20.4 .168 2.11 11.9 Not shown: Population by age (under 17, 18-44, 45-64, and over 65)
  24. Estimates: Total Population Location/Tornado Date Number of Casualties Total Population

    Detroit, MI 1997-07-02 90 116167 St. Louis, MO 2013-05-31 8 46902 Pittsburgh, PA 1998-06-02 50 34802 Tuscaloosa–Birmingham, AL 2011-04-27 1564 33729 Springfield, MA 2011-06-01 203 25266 Bridge Creek–Moore, OK 1999-05-03 619 24062 St. Louis, MO 2011-04-22 5 22617 Minneapolis, MN 2011-05-22 49 22497 Nashville, TN 1998-04-16 61 20821 Hackleburg–Phil Campbell, AL 2011-04-27 217 20471
  25. Estimates: Mobile Homes Location/Tornado Date Number of Casualties Mobile Homes

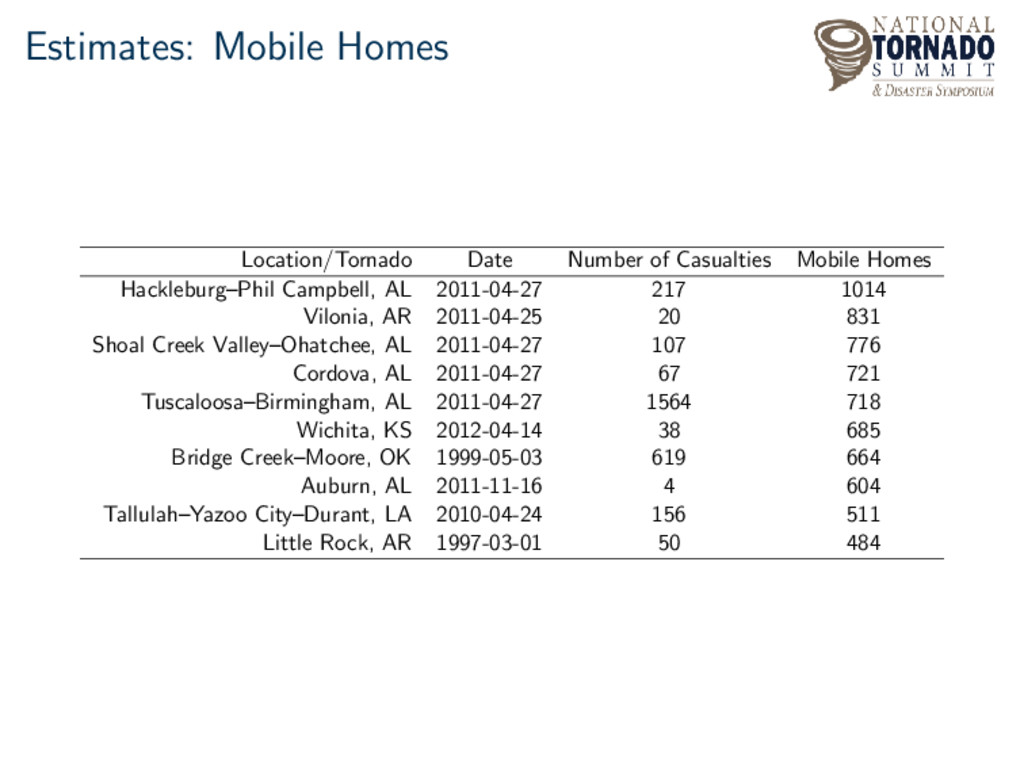
    Hackleburg–Phil Campbell, AL 2011-04-27 217 1014 Vilonia, AR 2011-04-25 20 831 Shoal Creek Valley–Ohatchee, AL 2011-04-27 107 776 Cordova, AL 2011-04-27 67 721 Tuscaloosa–Birmingham, AL 2011-04-27 1564 718 Wichita, KS 2012-04-14 38 685 Bridge Creek–Moore, OK 1999-05-03 619 664 Auburn, AL 2011-11-16 4 604 Tallulah–Yazoo City–Durant, LA 2010-04-24 156 511 Little Rock, AR 1997-03-01 50 484
  26. Estimates: Household Median Income Location/Tornado Date Number of Casualties Median

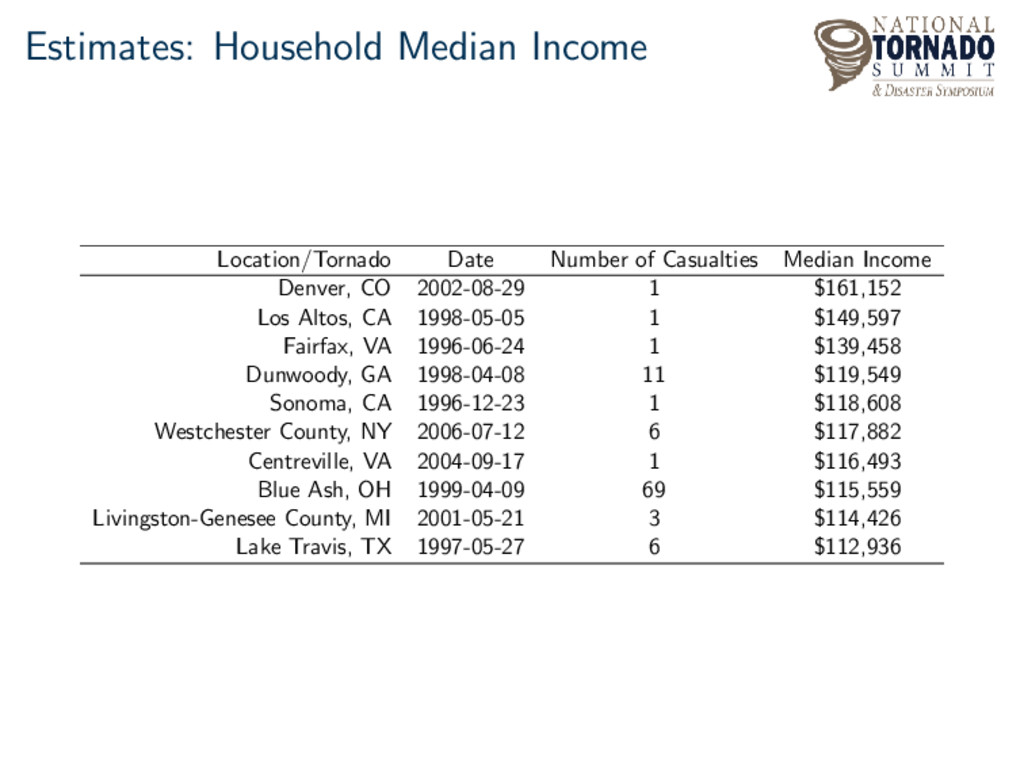
    Income Denver, CO 2002-08-29 1 $161,152 Los Altos, CA 1998-05-05 1 $149,597 Fairfax, VA 1996-06-24 1 $139,458 Dunwoody, GA 1998-04-08 11 $119,549 Sonoma, CA 1996-12-23 1 $118,608 Westchester County, NY 2006-07-12 6 $117,882 Centreville, VA 2004-09-17 1 $116,493 Blue Ash, OH 1999-04-09 69 $115,559 Livingston-Genesee County, MI 2001-05-21 3 $114,426 Lake Travis, TX 1997-05-27 6 $112,936
  27. Correlation Between Casualties and Estimates Variable Correlation Total Population .33

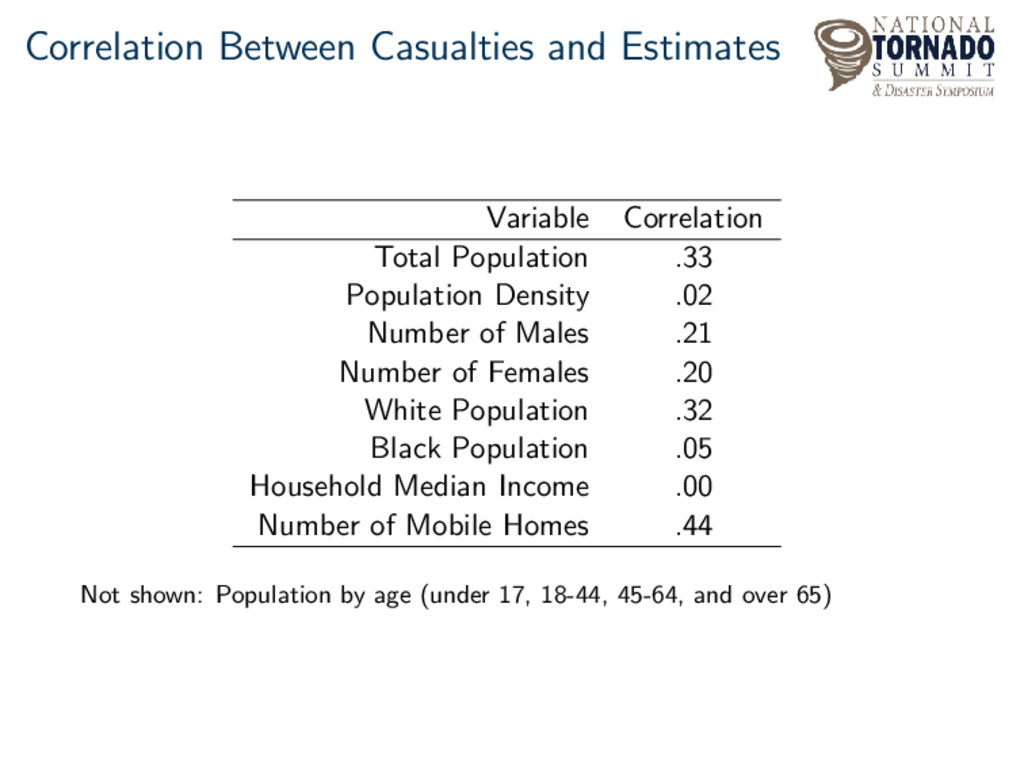
    Population Density .02 Number of Males .21 Number of Females .20 White Population .32 Black Population .05 Household Median Income .00 Number of Mobile Homes .44 Not shown: Population by age (under 17, 18-44, 45-64, and over 65)
  28. Casualty Model Estimates can be added to previous models (additive

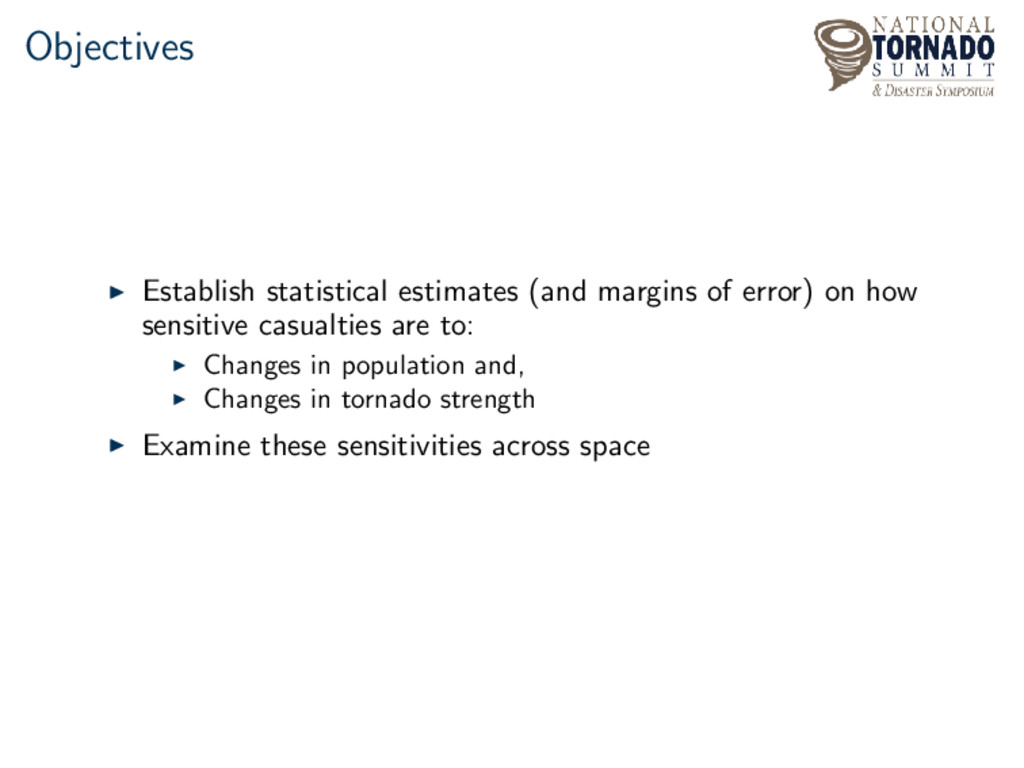
    or interactive) to better understand the impact demographic and socioeconomic variables have on tornado casualties Estimates of interest include: Young and old population White and black population Household median income Mobile homes
  29. Casualty Model Results A 10 mobile home increase under the

    path increases the casualty rate by 4.2% A 100 person increase in the population over 65 under the path increases the casualty rate by 1.4% A percentage increase in the white population under the path decreases the casualty rate by 25%
  30. Casualty Model Results When controlling for the number of mobile

    homes, household median income IS NOT a significant factor Older populations (over 65) are a stronger predictor than younger populations (under 17) White populations are a stronger predictor than black populations
  31. Future work The casualty model will improve with more variables

    Additional variables of interest include: Disability Educational attainment Ethnicity Language
  32. Addititve Model The model is given by: C ∼ NegBin(ˆ

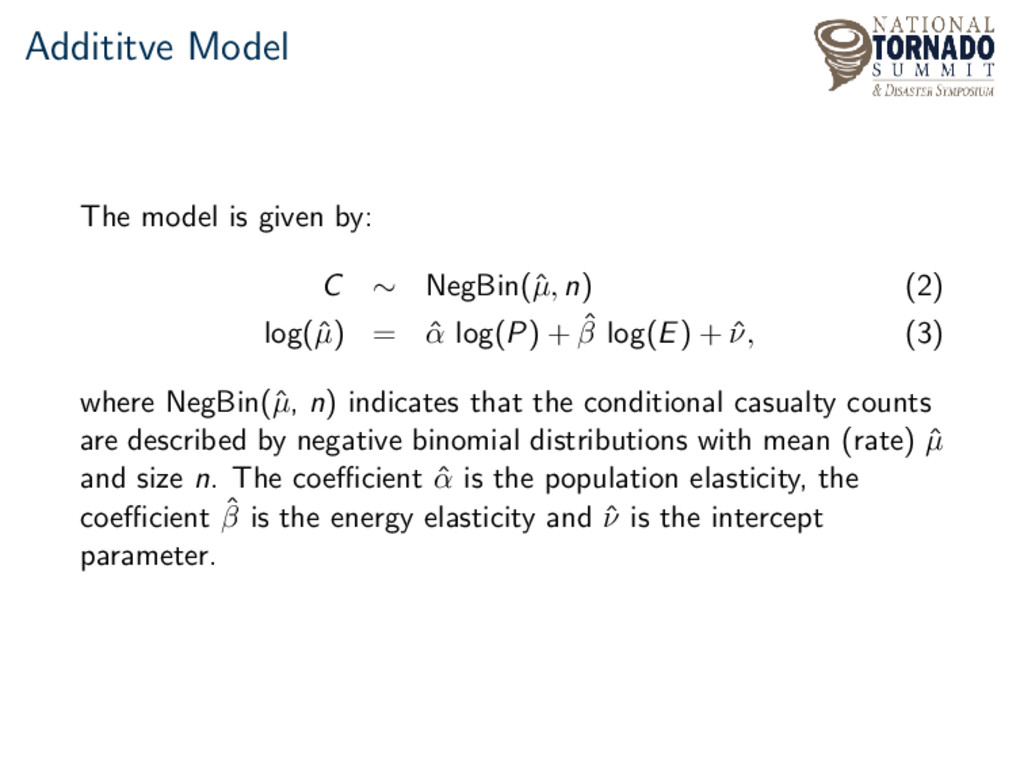
    µ, n) (2) log(ˆ µ) = ˆ α log(P) + ˆ β log(E) + ˆ ν, (3) where NegBin(ˆ µ, n) indicates that the conditional casualty counts are described by negative binomial distributions with mean (rate) ˆ µ and size n. The coefficient ˆ α is the population elasticity, the coefficient ˆ β is the energy elasticity and ˆ ν is the intercept parameter.
  33. Interactive Model The model is given by: C ∼ NegBin(ˆ

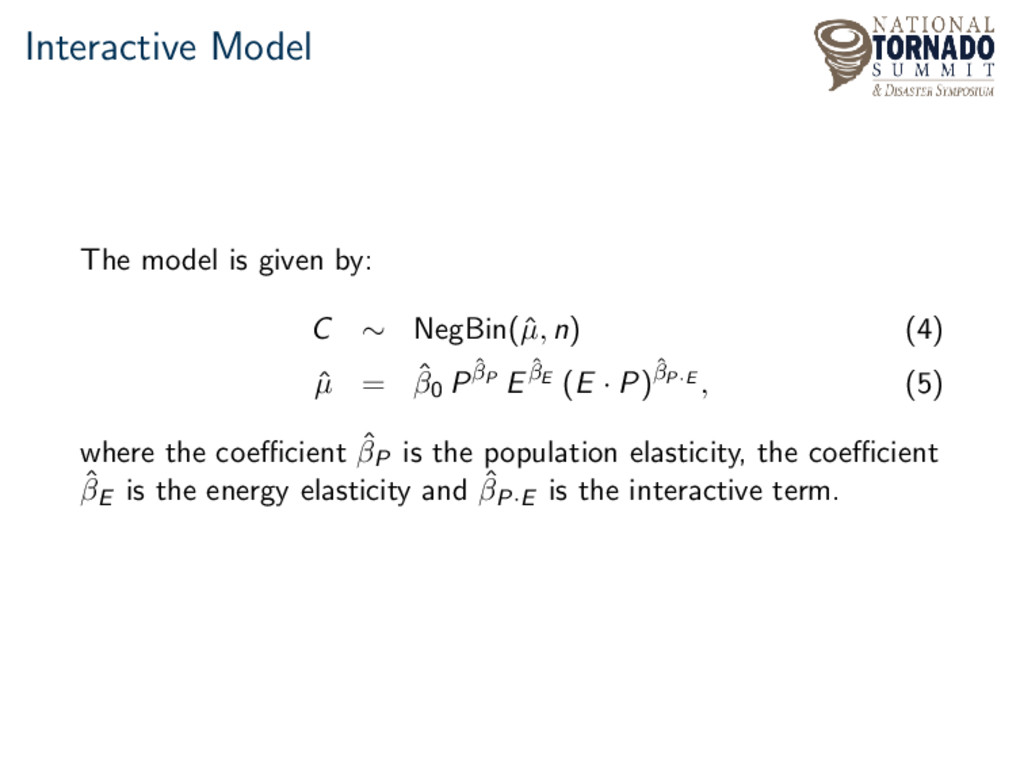
    µ, n) (4) ˆ µ = ˆ β0 P ˆ βP E ˆ βE (E · P)ˆ βP·E , (5) where the coefficient ˆ βP is the population elasticity, the coefficient ˆ βE is the energy elasticity and ˆ βP·E is the interactive term.
  34. Casualty Model The casualty model is given by: log( ˆ

    C) = ˆ β0 + ˆ β1 log(P) + ˆ β2 log(E) + ˆ β3 log(P) × log(E) + ˆ β4 (V1) + ˆ β5 (V2) + ˆ β6 (V3) + ... (6) where the coefficients ˆ β1, ˆ β2, and ˆ β3 are the population elasticity, energy elasticity, and interaction term, respectively. The coefficients ˆ β4, ˆ β5, and ˆ β6 are variable estimate terms, respectively.