Upgrade to Pro — share decks privately, control downloads, hide ads and more …

A Dasymetric Method to Estimate Tornado Casualties

A Dasymetric Method to Estimate Tornado Casualties

Paper presented at the 2016 Association of American Geographers Annual Meeting
San Francisco, CA

Tyler Fricker

March 29, 2016
Tweet

More Decks by Tyler Fricker

Other Decks in Science

Transcript

  1. A Dasymetric Method to Estimate Tornado Casualties Tyler Fricker (@TylerFricker)

    Department of Geography, Florida State University March 29, 2016 James B. Elsner, Victor Mesev, Thomas H. Jagger
  2. Problem We don’t know where tornado casualties occur geographically Casualty

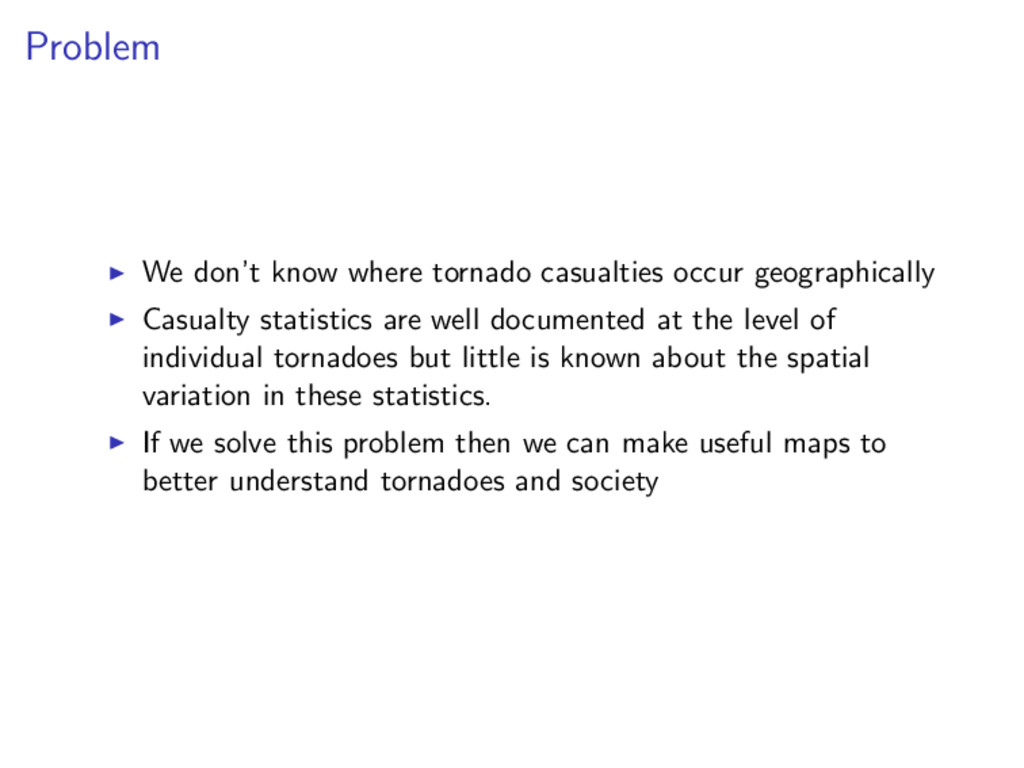
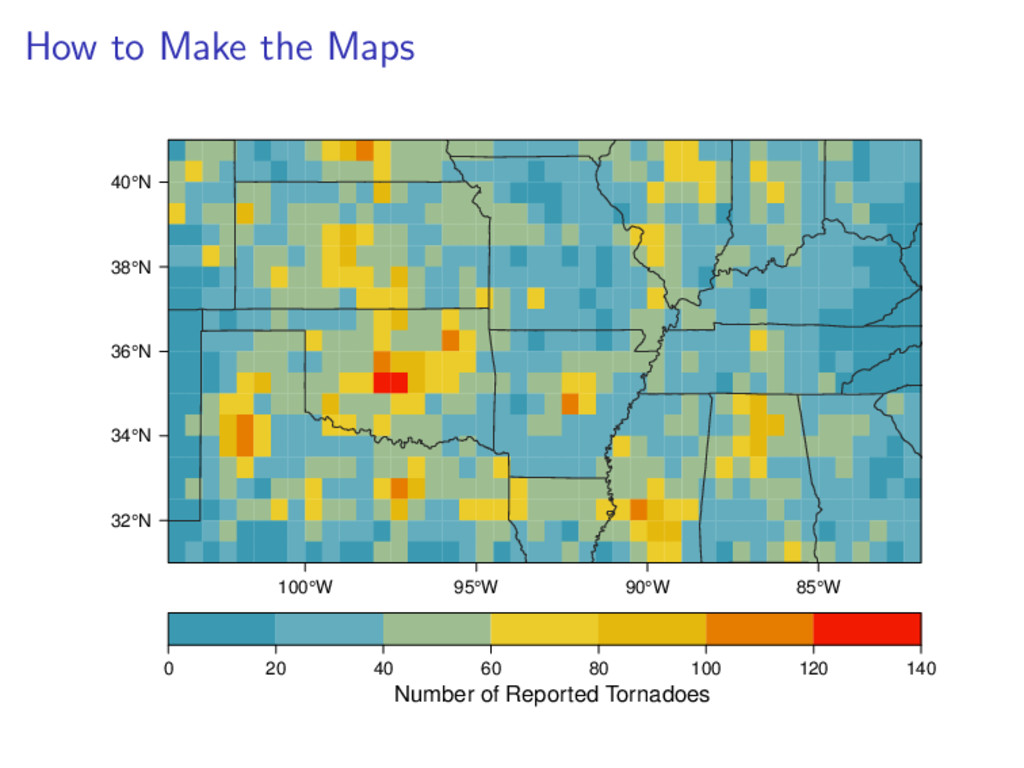
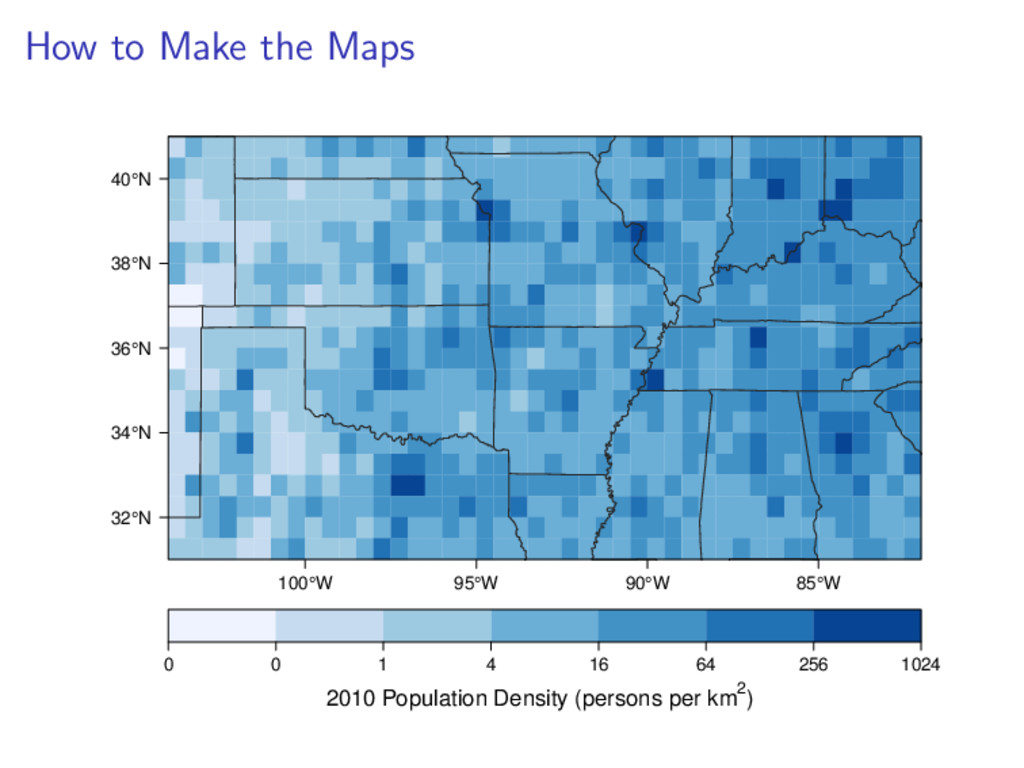
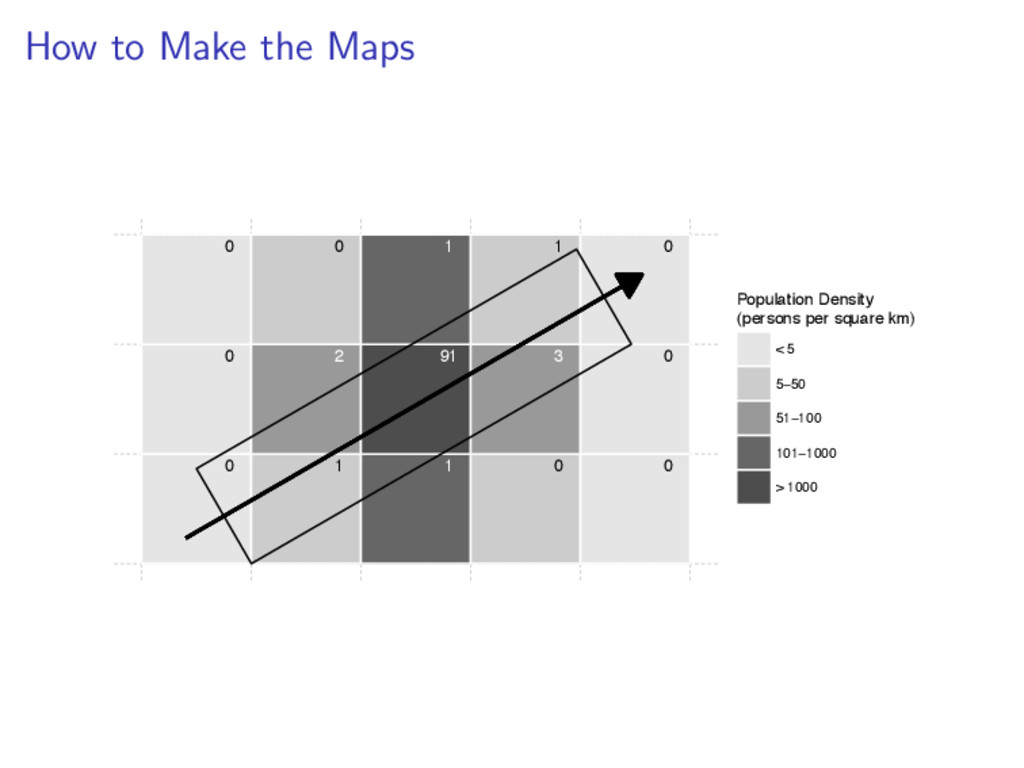
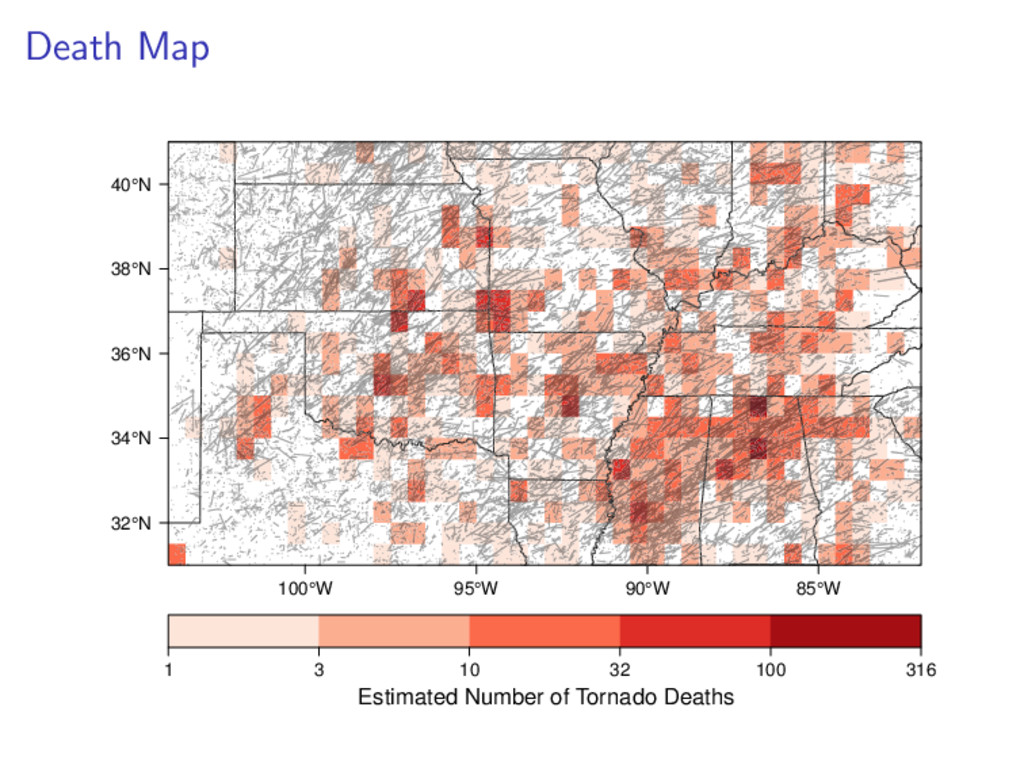
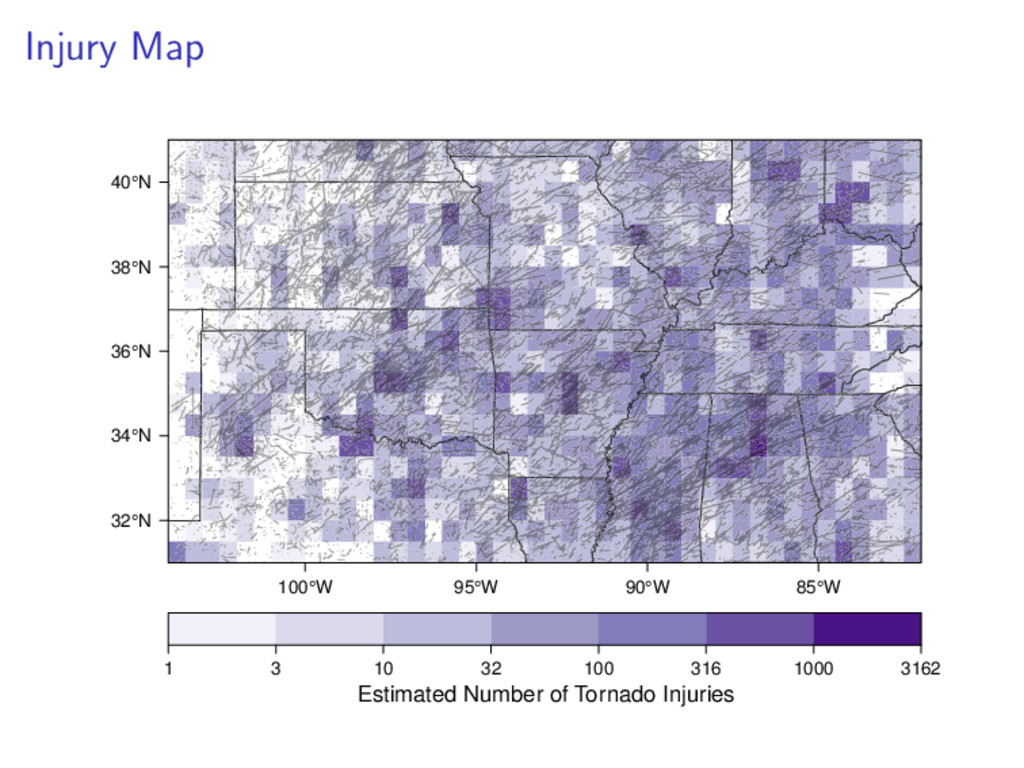
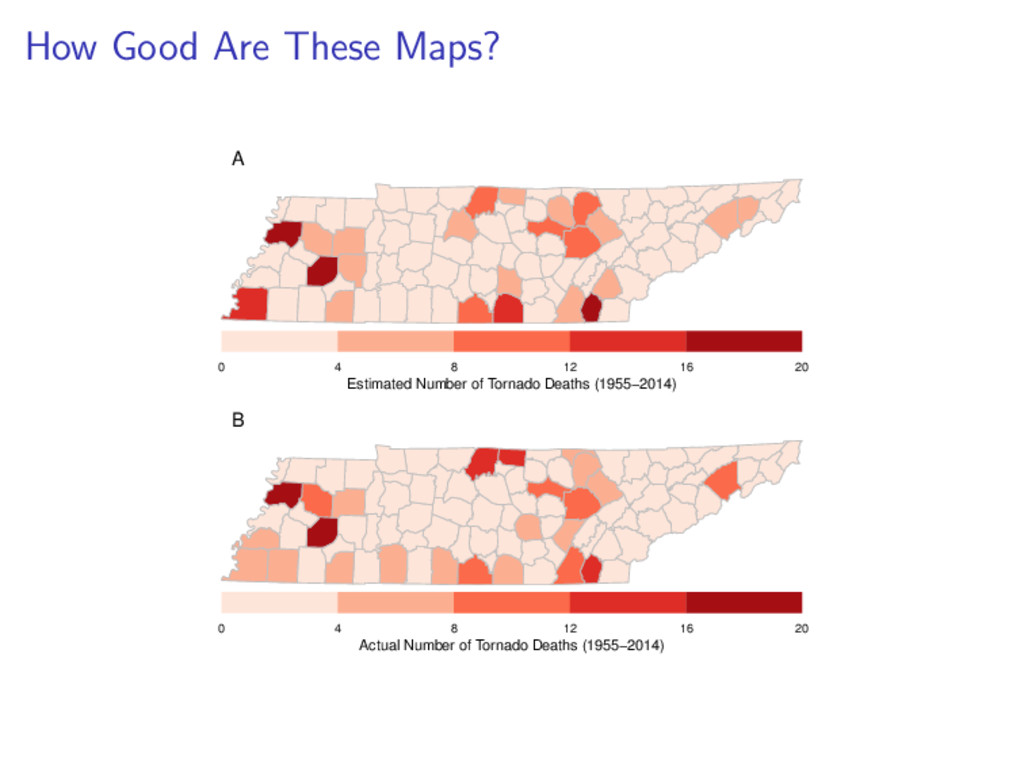
    statistics are well documented at the level of individual tornadoes but little is known about the spatial variation in these statistics. If we solve this problem then we can make useful maps to better understand tornadoes and society
  3. Problem Solved Estimated Number of Tornado Injuries 32°N 34°N 36°N

    38°N 40°N 100°W 95°W 90°W 85°W 1 3 10 32 100 316 1000 3162
  4. What Does the Data Look Like? 0 100 200 300

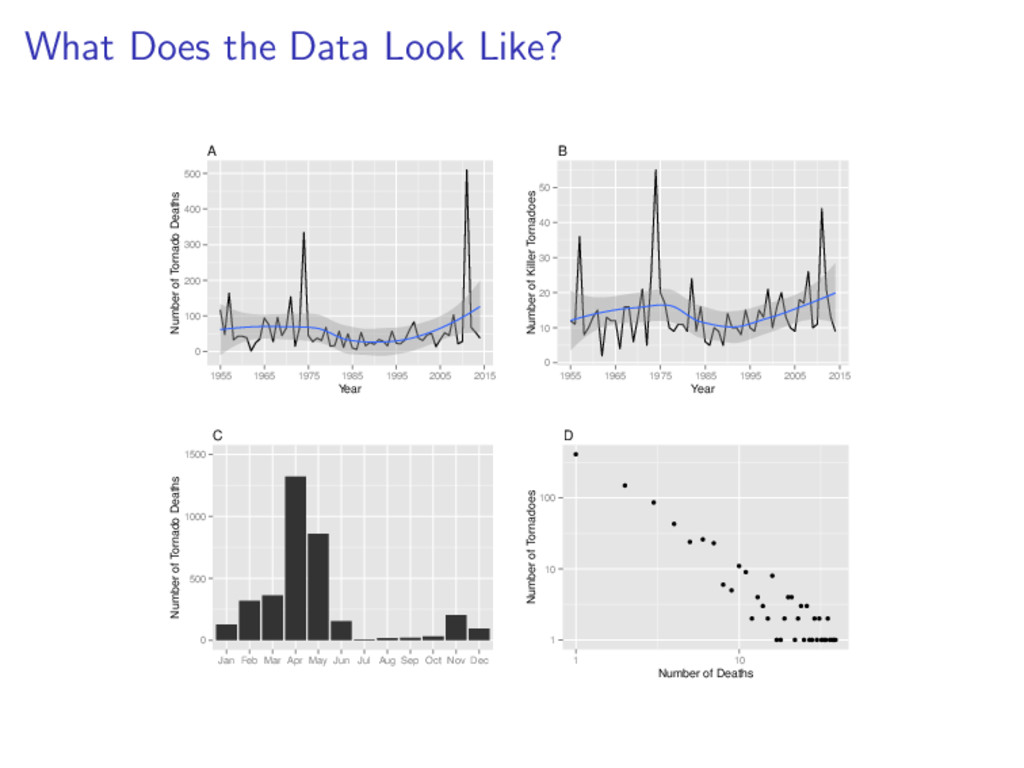
    400 500 1955 1965 1975 1985 1995 2005 2015 Year Number of Tornado Deaths A 0 10 20 30 40 50 1955 1965 1975 1985 1995 2005 2015 Year Number of Killer Tornadoes B 0 500 1000 1500 Jan Feb Mar Apr May Jun Jul Aug Sep Oct Nov Dec Number of Tornado Deaths C 1 10 100 1 10 Number of Deaths Number of Tornadoes D
  5. How to Make the Maps Number of Reported Tornadoes 32°N

    34°N 36°N 38°N 40°N 100°W 95°W 90°W 85°W 0 20 40 60 80 100 120 140
  6. How to Make the Maps 2010 Population Density (persons per

    km2) 32°N 34°N 36°N 38°N 40°N 100°W 95°W 90°W 85°W 0 0 1 4 16 64 256 1024
  7. How to Make the Maps 0 0 0 1 2

    0 1 91 1 0 3 1 0 0 0 Population Density (persons per square km) < 5 5−50 51−100 101−1000 > 1000
  8. Death Map Estimated Number of Tornado Deaths 32°N 34°N 36°N

    38°N 40°N 100°W 95°W 90°W 85°W 1 3 10 32 100 316
  9. Injury Map Estimated Number of Tornado Injuries 32°N 34°N 36°N

    38°N 40°N 100°W 95°W 90°W 85°W 1 3 10 32 100 316 1000 3162
  10. Cluster Maps A Local Moran's I [Deaths] 32°N 34°N 36°N

    38°N 40°N 100°W 95°W 90°W 85°W −1 −0.75 −0.5 −0.25 0 0.25 0.5 0.75 >1 B Local Moran's I [Injuries] 32°N 34°N 36°N 38°N 40°N 100°W 95°W 90°W 85°W −1 −0.75 −0.5 −0.25 0 0.25 0.5 0.75 >1
  11. Injuries and Clusters Through Time A Estimated Number of Tornado

    Injuries 32°N 34°N 36°N 38°N 40°N 1955−1964 1965−1974 1975−1984 1985−1994 32°N 34°N 36°N 38°N 40°N 100°W 95°W 90°W 85°W 1995−2004 2005−2014 1 3 10 32 100 316 1000 B Local Moran's I [Injuries] 32°N 34°N 36°N 38°N 40°N 1955−1964 1965−1974 1975−1984 1985−1994 32°N 34°N 36°N 38°N 40°N 100°W 95°W 90°W 85°W 1995−2004 2005−2014 −1 −0.75 −0.5 −0.25 0 0.25 0.5 0.75 >1
  12. How Good Are These Maps? A Estimated Number of Tornado

    Deaths (1955−2014) 0 4 8 12 16 20 B Actual Number of Tornado Deaths (1955−2014) 0 4 8 12 16 20
  13. How Good Are These Maps? 0 5 10 15 20

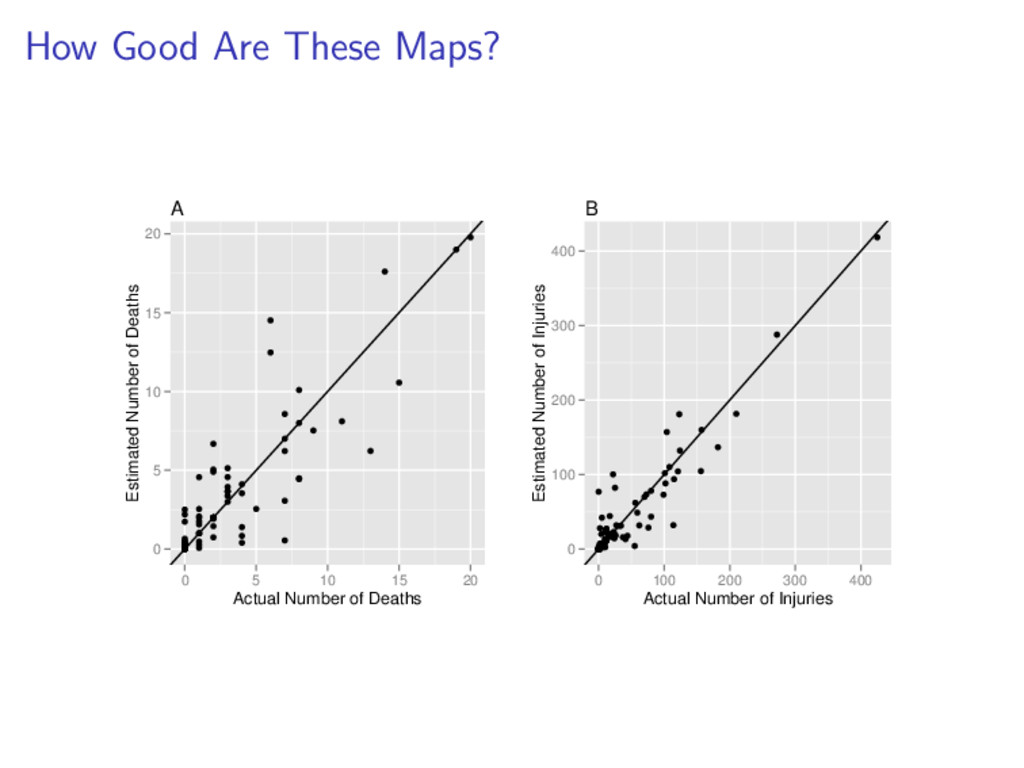
    0 5 10 15 20 Actual Number of Deaths Estimated Number of Deaths A 0 100 200 300 400 0 100 200 300 400 Actual Number of Injuries Estimated Number of Injuries B
  14. How Good Are These Maps? State rd (e, a) ri

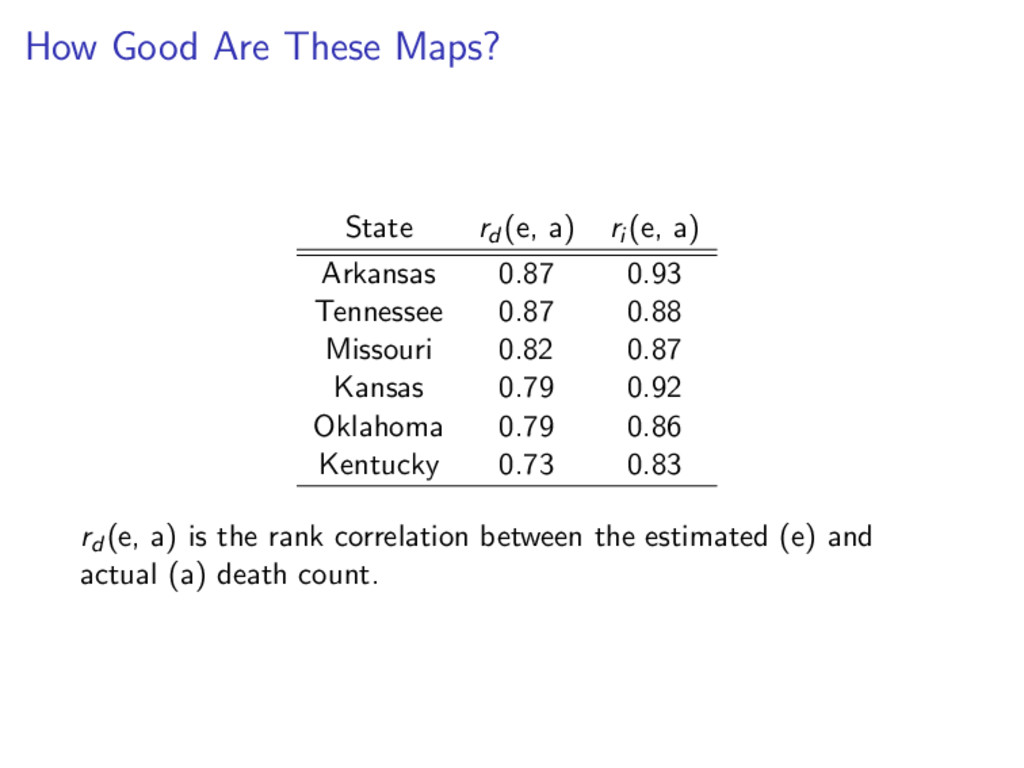
    (e, a) Arkansas 0.87 0.93 Tennessee 0.87 0.88 Missouri 0.82 0.87 Kansas 0.79 0.92 Oklahoma 0.79 0.86 Kentucky 0.73 0.83 rd (e, a) is the rank correlation between the estimated (e) and actual (a) death count.
  15. What Good Are These Maps? Move beyond the tornado-centric concept

    of tornado casualties into a geographic concept of tornado casualties Better understand societal impacts of tornado activity
  16. Can I Change the Grid Size? A Estimated Number of

    Tornado Deaths 32°N 34°N 36°N 38°N 40°N 100°W 95°W 90°W 85°W 1 3 6 16 40 100 B Estimated Number of Tornado Injuries 32°N 34°N 36°N 38°N 40°N 100°W 95°W 90°W 85°W 1 3 10 32 100 316 1000 3162 C Estimated Number of Tornado Deaths 32°N 34°N 36°N 38°N 40°N 100°W 95°W 90°W 85°W 1 3 10 32 100 316 D Estimated Number of Tornado Injuries 32°N 34°N 36°N 38°N 40°N 100°W 95°W 90°W 85°W 1 3 10 32 100 316 1000 3162