Department of Geography, Florida State University April 14, 2018 Tyler Fricker Tornado-level estimates of socioeconomic and demographic variables 1 / 21
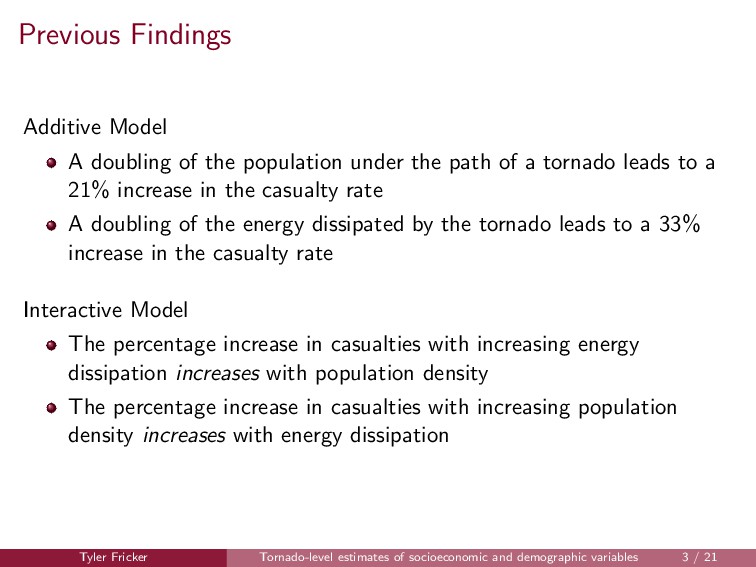
the path of a tornado leads to a 21% increase in the casualty rate A doubling of the energy dissipated by the tornado leads to a 33% increase in the casualty rate Interactive Model The percentage increase in casualties with increasing energy dissipation increases with population density The percentage increase in casualties with increasing population density increases with energy dissipation Tyler Fricker Tornado-level estimates of socioeconomic and demographic variables 3 / 21
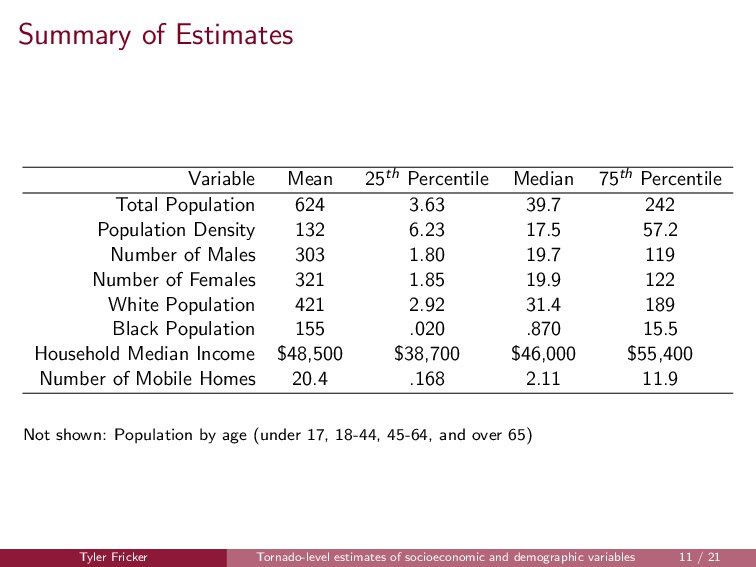
Total Population 624 3.63 39.7 242 Population Density 132 6.23 17.5 57.2 Number of Males 303 1.80 19.7 119 Number of Females 321 1.85 19.9 122 White Population 421 2.92 31.4 189 Black Population 155 .020 .870 15.5 Household Median Income $48,500 $38,700 $46,000 $55,400 Number of Mobile Homes 20.4 .168 2.11 11.9 Not shown: Population by age (under 17, 18-44, 45-64, and over 65) Tyler Fricker Tornado-level estimates of socioeconomic and demographic variables 11 / 21
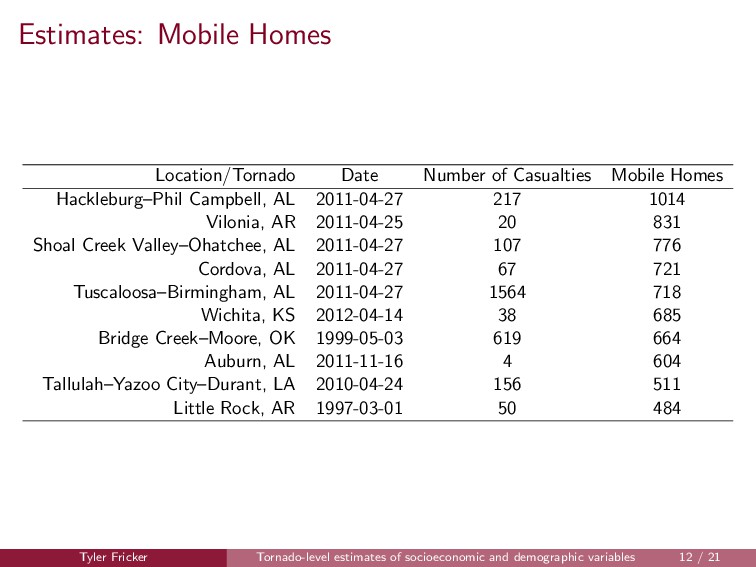
Hackleburg–Phil Campbell, AL 2011-04-27 217 1014 Vilonia, AR 2011-04-25 20 831 Shoal Creek Valley–Ohatchee, AL 2011-04-27 107 776 Cordova, AL 2011-04-27 67 721 Tuscaloosa–Birmingham, AL 2011-04-27 1564 718 Wichita, KS 2012-04-14 38 685 Bridge Creek–Moore, OK 1999-05-03 619 664 Auburn, AL 2011-11-16 4 604 Tallulah–Yazoo City–Durant, LA 2010-04-24 156 511 Little Rock, AR 1997-03-01 50 484 Tyler Fricker Tornado-level estimates of socioeconomic and demographic variables 12 / 21
Income Denver, CO 2002-08-29 1 $161,152 Los Altos, CA 1998-05-05 1 $149,597 Fairfax, VA 1996-06-24 1 $139,458 Dunwoody, GA 1998-04-08 11 $119,549 Sonoma, CA 1996-12-23 1 $118,608 Westchester County, NY 2006-07-12 6 $117,882 Centreville, VA 2004-09-17 1 $116,493 Blue Ash, OH 1999-04-09 69 $115,559 Livingston-Genesee County, MI 2001-05-21 3 $114,426 Lake Travis, TX 1997-05-27 6 $112,936 Tyler Fricker Tornado-level estimates of socioeconomic and demographic variables 13 / 21
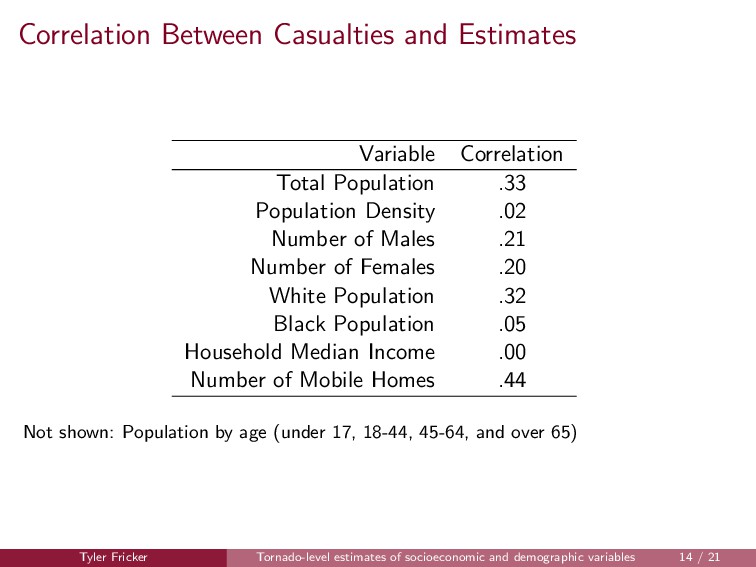
Population Density .02 Number of Males .21 Number of Females .20 White Population .32 Black Population .05 Household Median Income .00 Number of Mobile Homes .44 Not shown: Population by age (under 17, 18-44, 45-64, and over 65) Tyler Fricker Tornado-level estimates of socioeconomic and demographic variables 14 / 21
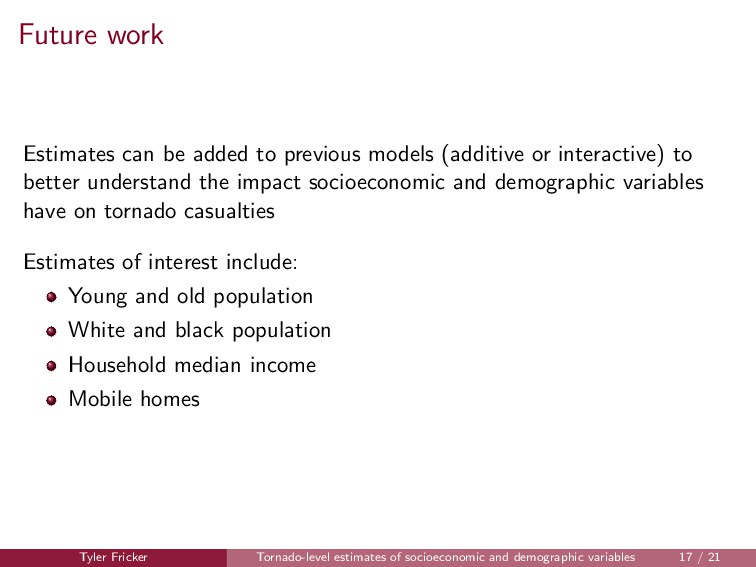
or interactive) to better understand the impact socioeconomic and demographic variables have on tornado casualties Estimates of interest include: Young and old population White and black population Household median income Mobile homes Tyler Fricker Tornado-level estimates of socioeconomic and demographic variables 17 / 21
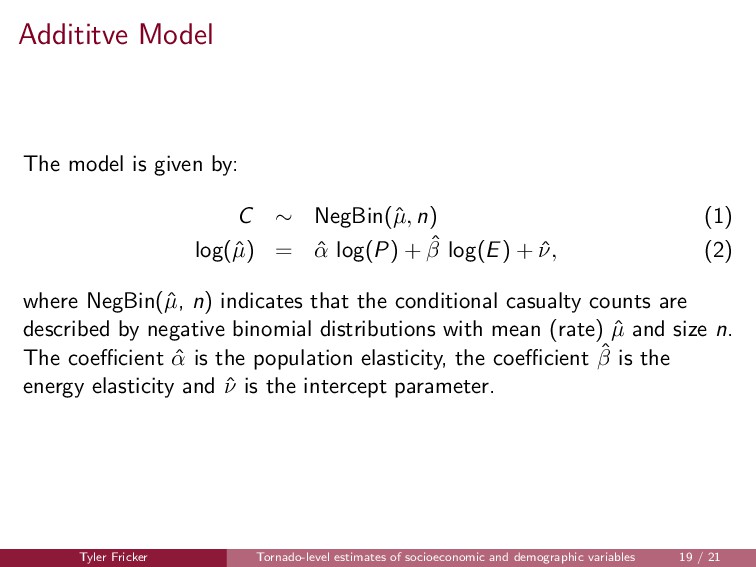
µ, n) (1) log(ˆ µ) = ˆ α log(P) + ˆ β log(E) + ˆ ν, (2) where NegBin(ˆ µ, n) indicates that the conditional casualty counts are described by negative binomial distributions with mean (rate) ˆ µ and size n. The coefficient ˆ α is the population elasticity, the coefficient ˆ β is the energy elasticity and ˆ ν is the intercept parameter. Tyler Fricker Tornado-level estimates of socioeconomic and demographic variables 19 / 21
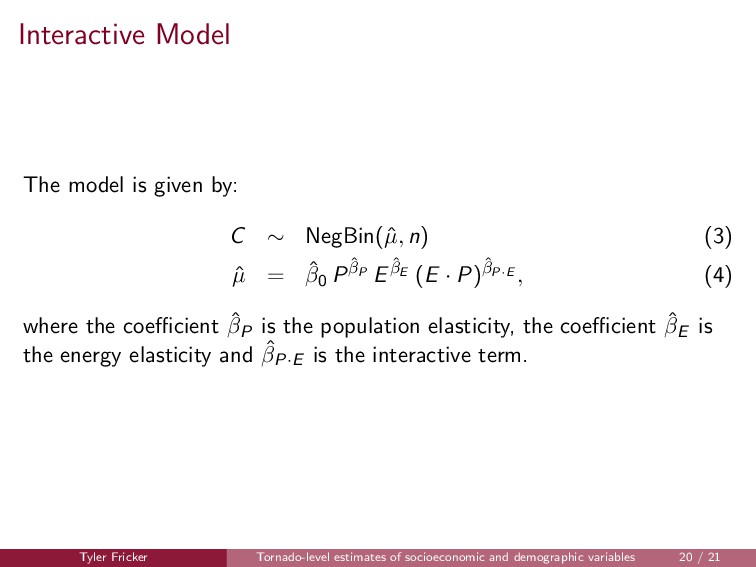
µ, n) (3) ˆ µ = ˆ β0 P ˆ βP E ˆ βE (E · P)ˆ βP·E , (4) where the coefficient ˆ βP is the population elasticity, the coefficient ˆ βE is the energy elasticity and ˆ βP·E is the interactive term. Tyler Fricker Tornado-level estimates of socioeconomic and demographic variables 20 / 21