overview of our current understanding of tornado casualties and the potential connection between tornado casualties, climate, and society. More specifically: Describe the rate of tornado casualties as a function of tornado strength and population Investigate future rates of tornado casualties in conjunction with projected changes in tornado behavior and community structure Tornado casualties
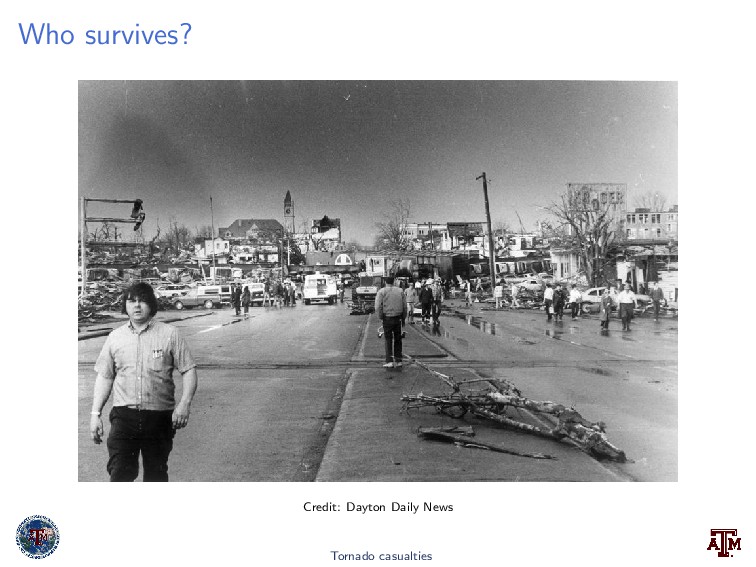
directly attributable to the tornado event itself: A direct fatality is any death attributed to the tornado A direct injury is any injury that requires treatment by a first-responder or subsequent treatment at a medical facility Tornado casualties
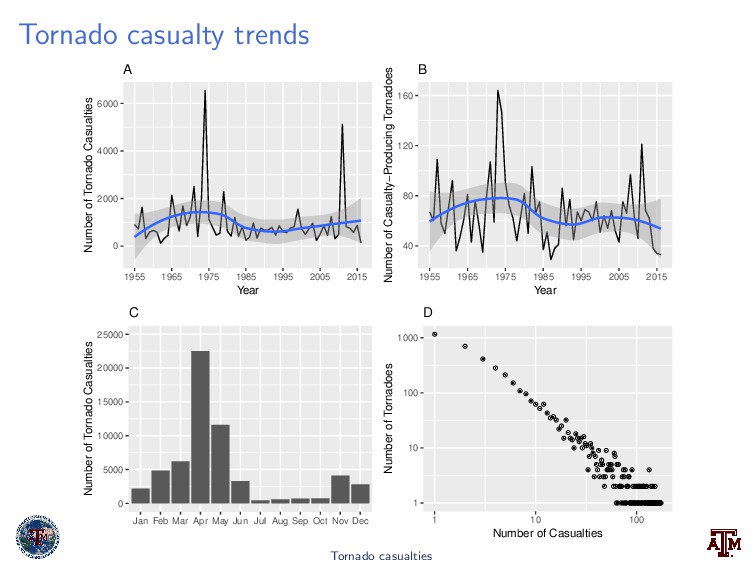
1985 1995 2005 2015 Year Number of Tornado Casualties A 40 80 120 160 1955 1965 1975 1985 1995 2005 2015 Year Number of Casualty−Producing Tornadoes B 0 5000 10000 15000 20000 25000 Jan Feb Mar Apr May Jun Jul Aug Sep Oct Nov Dec Number of Tornado Casualties C 1 10 100 1000 1 10 100 Number of Casualties Number of Tornadoes D Tornado casualties
to changes in population and how sensitive casualties are to changes in tornado strength. These statistical models are evaluated through: An additive model An interactive model Tornado casualties
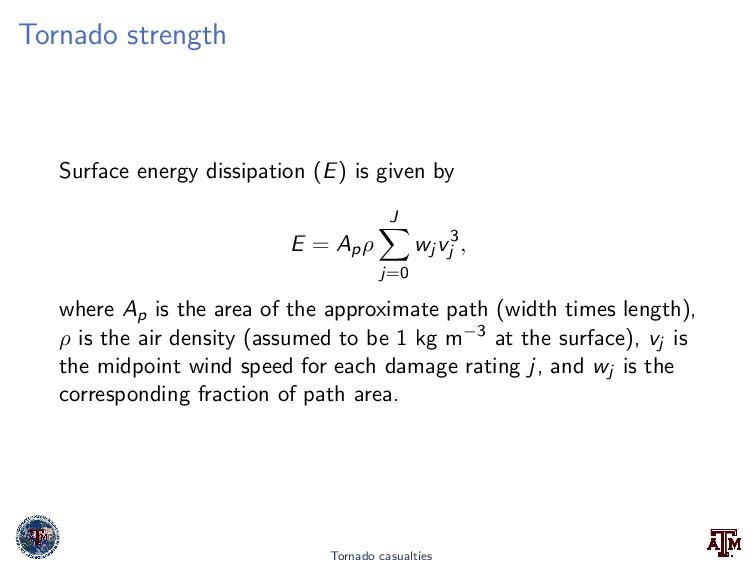
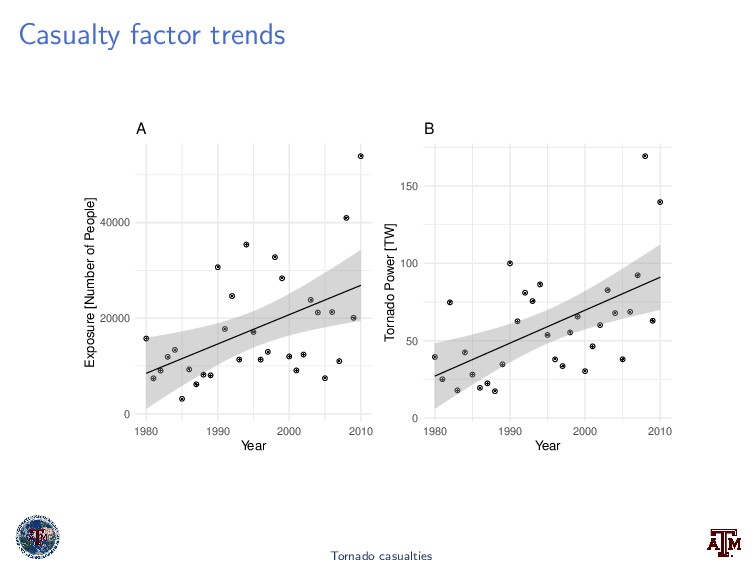
= Apρ J j=0 wj v3 j , where Ap is the area of the approximate path (width times length), ρ is the air density (assumed to be 1 kg m−3 at the surface), vj is the midpoint wind speed for each damage rating j, and wj is the corresponding fraction of path area. Tornado casualties
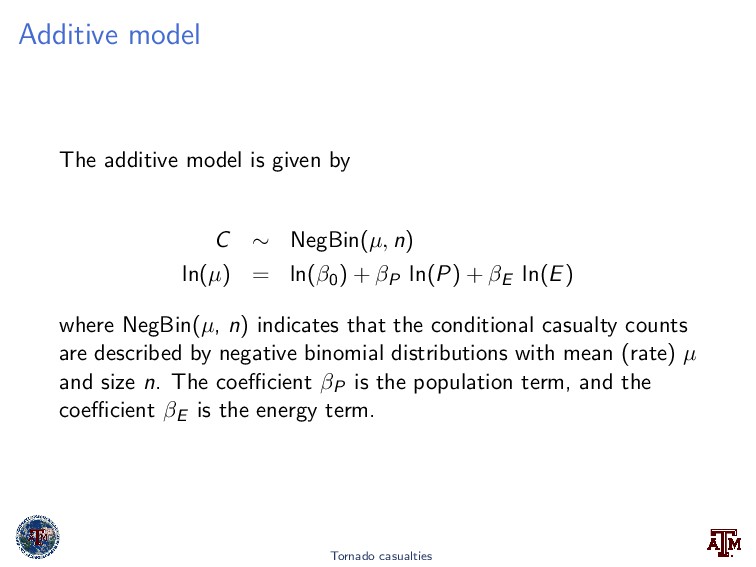
NegBin(µ, n) ln(µ) = ln(β0) + βP ln(P) + βE ln(E) where NegBin(µ, n) indicates that the conditional casualty counts are described by negative binomial distributions with mean (rate) µ and size n. The coefficient βP is the population term, and the coefficient βE is the energy term. Tornado casualties
path of a tornado leads to a 21% increase in the casualty rate A doubling of the energy dissipated by the tornado leads to a 33% increase in the casualty rate Tornado casualties
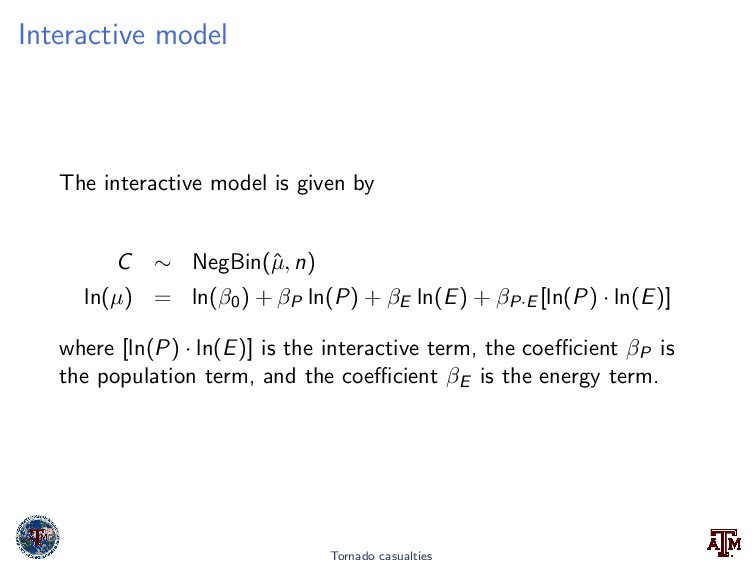
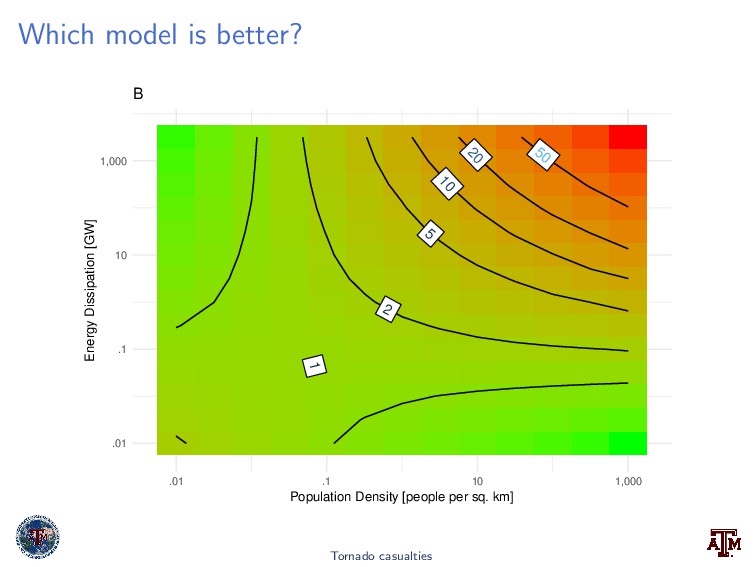
NegBin(ˆ µ, n) ln(µ) = ln(β0) + βP ln(P) + βE ln(E) + βP·E [ln(P) · ln(E)] where [ln(P) · ln(E)] is the interactive term, the coefficient βP is the population term, and the coefficient βE is the energy term. Tornado casualties
energy dissipation increases with population density The percentage increase in casualties with increasing population density increases with energy dissipation Tornado casualties
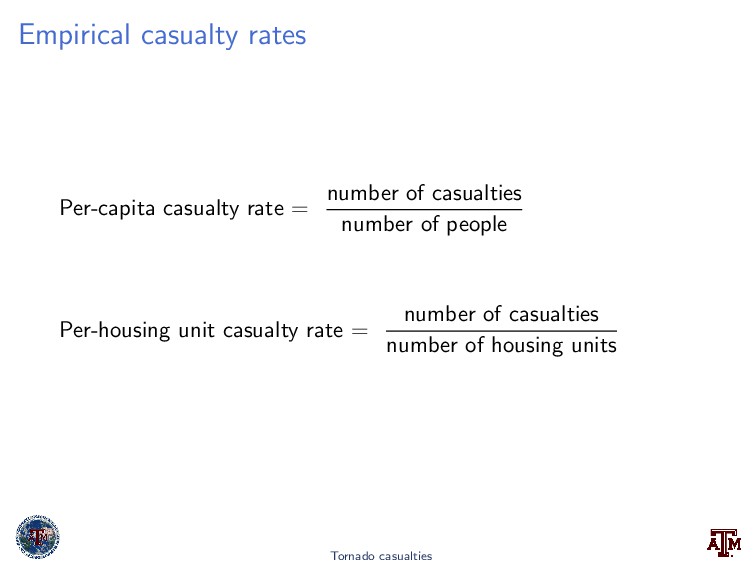
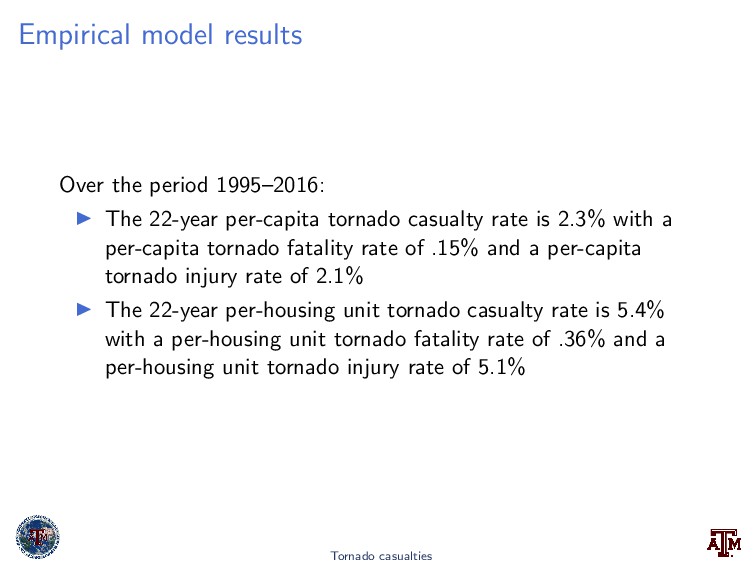
tornado casualty rate is 2.3% with a per-capita tornado fatality rate of .15% and a per-capita tornado injury rate of 2.1% The 22-year per-housing unit tornado casualty rate is 5.4% with a per-housing unit tornado fatality rate of .36% and a per-housing unit tornado injury rate of 5.1% Tornado casualties
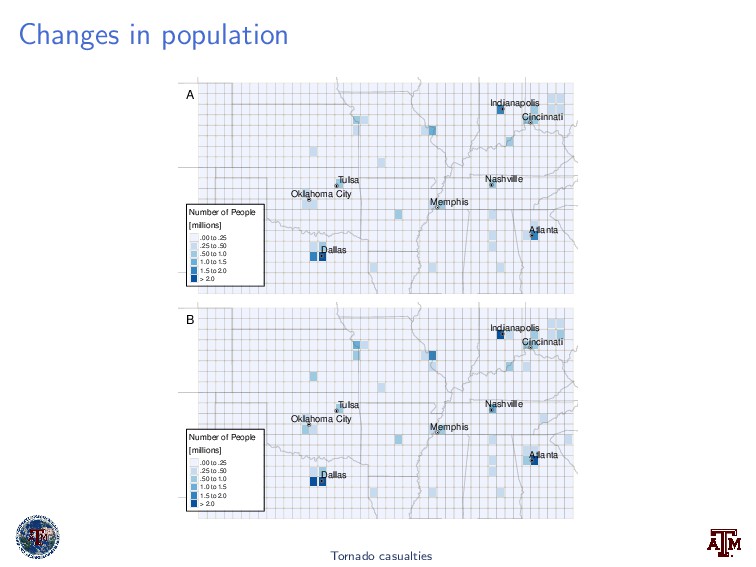
Nashville Austin Corpus Christi Dallas Houston San Antonio A Number of People [millions] .00 to .25 .25 to .50 .50 to 1.0 1.0 to 1.5 1.5 to 2.0 > 2.0 Atlanta Indianapolis Cincinnati Cleveland Toledo Oklahoma City Tulsa Memphis Nashville Dallas B Number of People [millions] .00 to .25 .25 to .50 .50 to 1.0 1.0 to 1.5 1.5 to 2.0 > 2.0 Tornado casualties
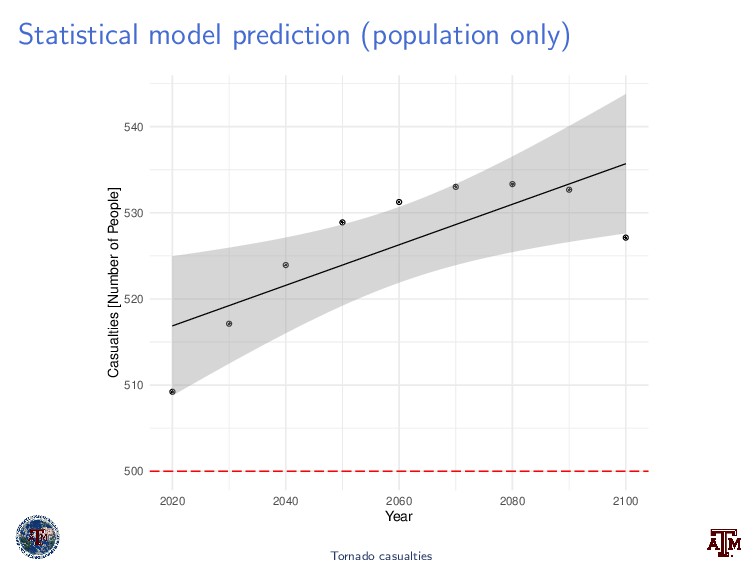
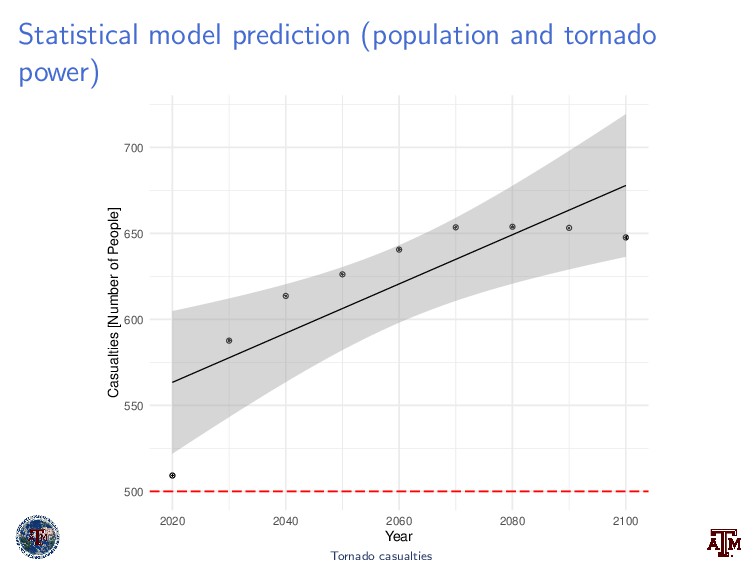
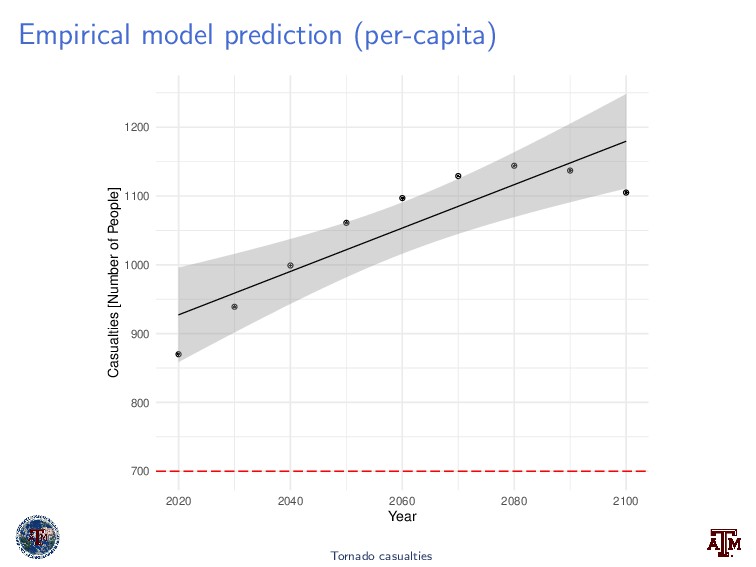
in the future under both increasing population and increasing population/tornado power scenarios The empirical model predicts higher-than-average casualty rates in the future as population increases Tornado casualties
predicts a percent change of 6% above present values under an increasing population scenario The statistical model predicts a percent change of 30% above present values under an increasing population/tornado power scenario The empirical model predicts a percent change of 30% above present average values as population increases Tornado casualties