tornado casualty problem in the United States. More specifically: Describe the rate of tornado casualties as a function of tornado strength and population Estimate socioeconomic and demographic factors at the tornado level to understand their impact on the rate of tornado casualties Identify what tornadoes were unusual in producing more casualties than expected based on where they hit Tyler Fricker Tornado Casualties in the United States 3 / 38
(2020). “Evaluating tornado casualty rates in the United States”. In: International Journal of Disaster Risk Reduction. Elsner, J.B, T. Fricker, and Z. Schroder (2019). “Increasingly Powerful Tornadoes in the United States”. In: Geophysical Research Letters. Tyler Fricker Tornado Casualties in the United States 5 / 38
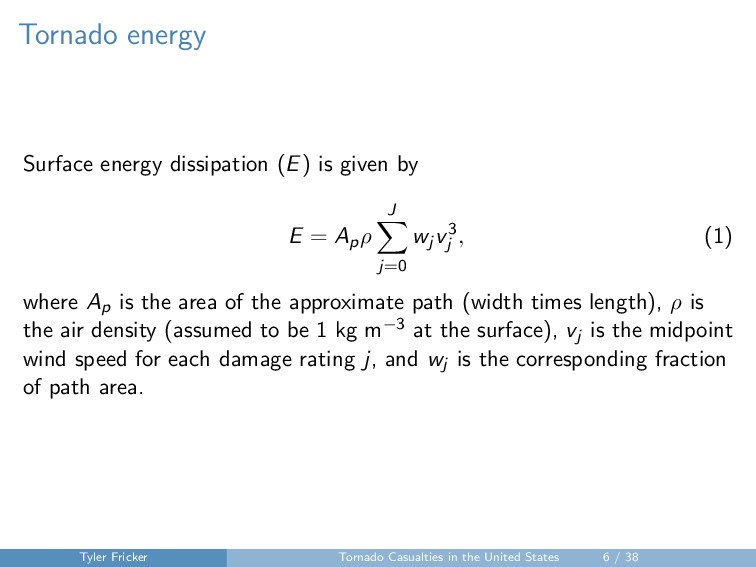
= Apρ J j=0 wj v3 j , (1) where Ap is the area of the approximate path (width times length), ρ is the air density (assumed to be 1 kg m−3 at the surface), vj is the midpoint wind speed for each damage rating j, and wj is the corresponding fraction of path area. Tyler Fricker Tornado Casualties in the United States 6 / 38
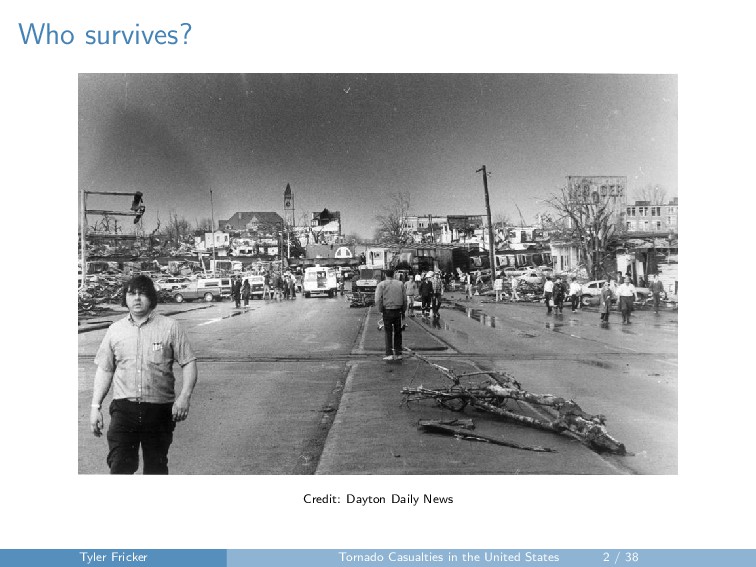
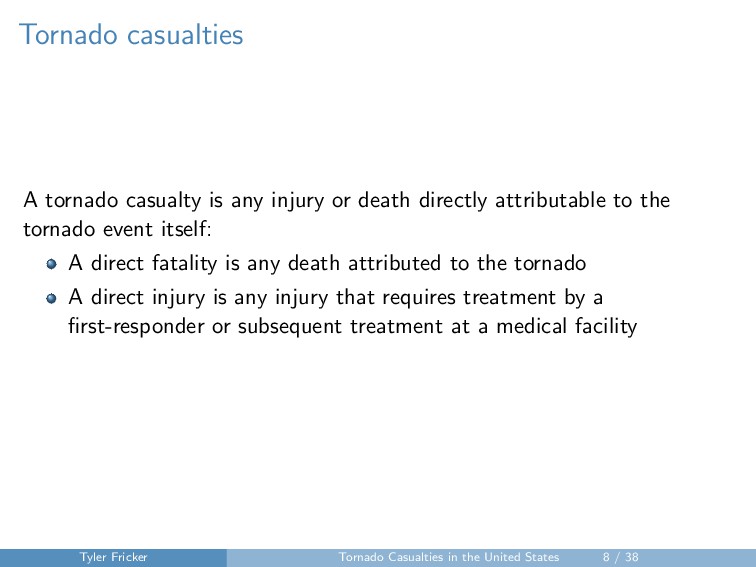
directly attributable to the tornado event itself: A direct fatality is any death attributed to the tornado A direct injury is any injury that requires treatment by a first-responder or subsequent treatment at a medical facility Tyler Fricker Tornado Casualties in the United States 8 / 38
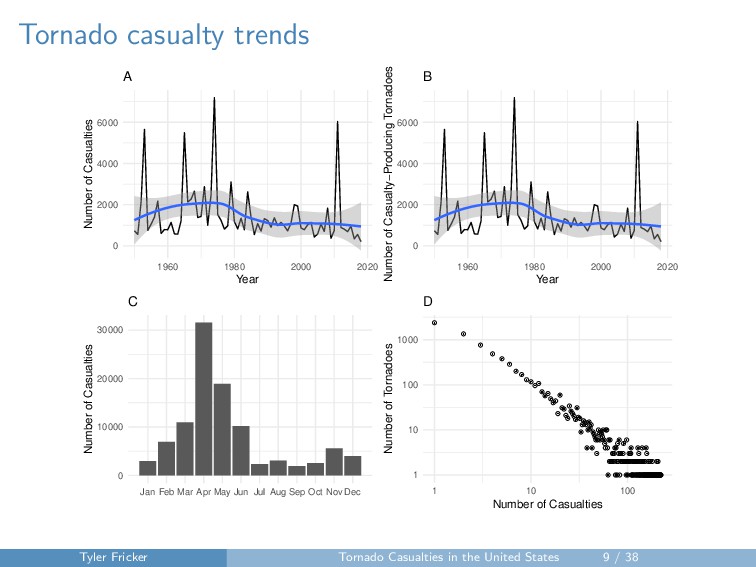
2020 Year Number of Casualties A 0 10000 20000 30000 Jan Feb Mar Apr May Jun Jul Aug Sep Oct Nov Dec Number of Casualties C 0 2000 4000 6000 1960 1980 2000 2020 Year Number of Casualty−Producing Tornadoes B 1 10 100 1000 1 10 100 Number of Casualties Number of Tornadoes D Tyler Fricker Tornado Casualties in the United States 9 / 38
B, T. Fricker, and W.D. Berry (2018). “A model for U.S. tornadoes casualties involving interaction between damage path estimates of population density and energy dissipation”. In: Journal of Applied Meteorology and Climatology. Fricker, T, J.B. Elsner, and T.H. Jagger (2017). “Population and energy elasticity of tornado casualties”. In: Geophysical Research Letters. Tyler Fricker Tornado Casualties in the United States 12 / 38
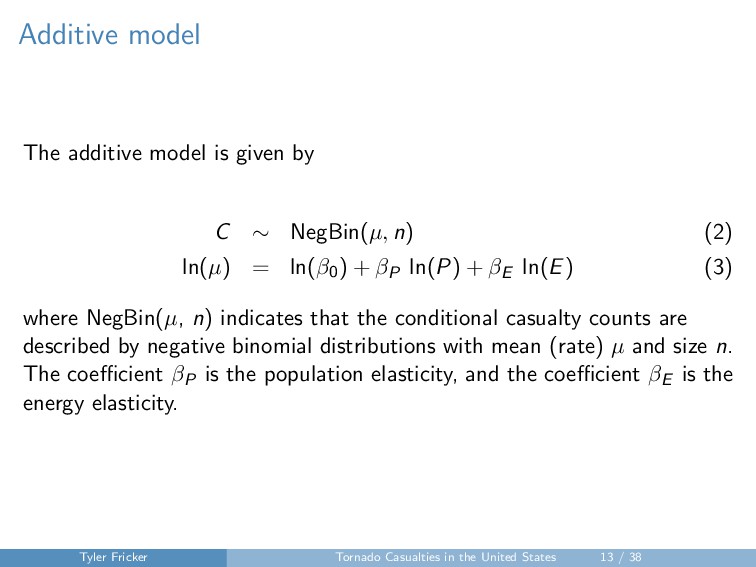
NegBin(µ, n) (2) ln(µ) = ln(β0) + βP ln(P) + βE ln(E) (3) where NegBin(µ, n) indicates that the conditional casualty counts are described by negative binomial distributions with mean (rate) µ and size n. The coefficient βP is the population elasticity, and the coefficient βE is the energy elasticity. Tyler Fricker Tornado Casualties in the United States 13 / 38
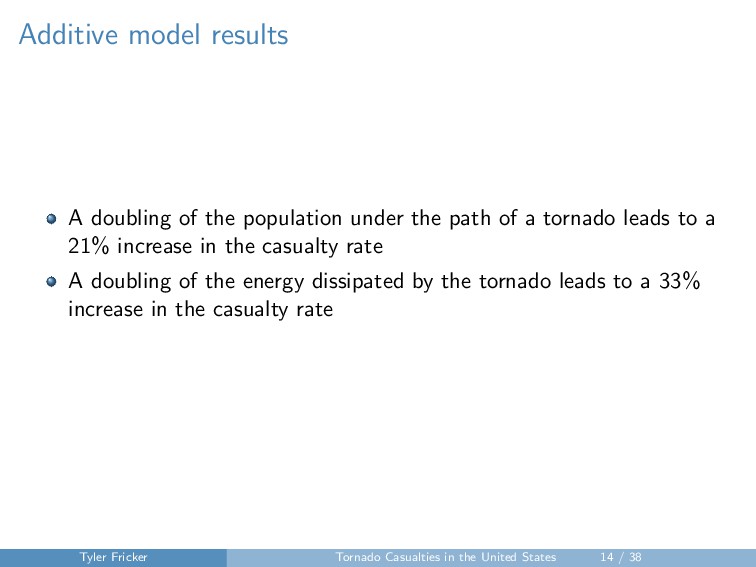
path of a tornado leads to a 21% increase in the casualty rate A doubling of the energy dissipated by the tornado leads to a 33% increase in the casualty rate Tyler Fricker Tornado Casualties in the United States 14 / 38
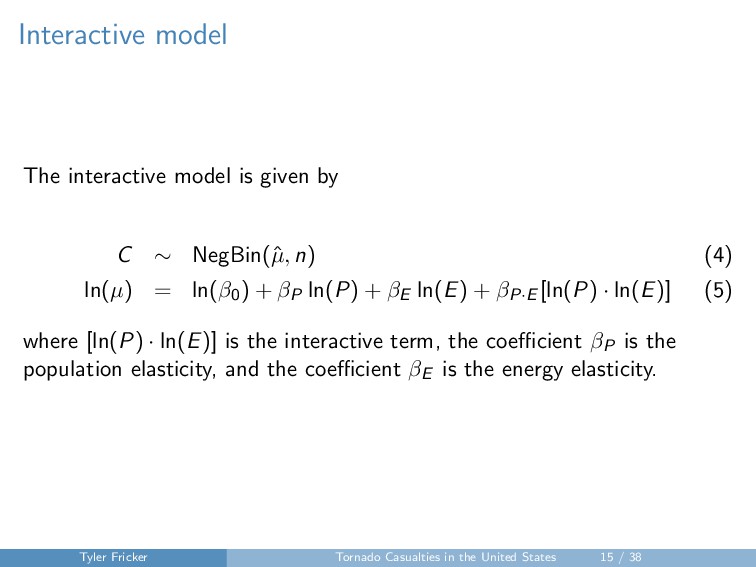
NegBin(ˆ µ, n) (4) ln(µ) = ln(β0) + βP ln(P) + βE ln(E) + βP·E [ln(P) · ln(E)] (5) where [ln(P) · ln(E)] is the interactive term, the coefficient βP is the population elasticity, and the coefficient βE is the energy elasticity. Tyler Fricker Tornado Casualties in the United States 15 / 38
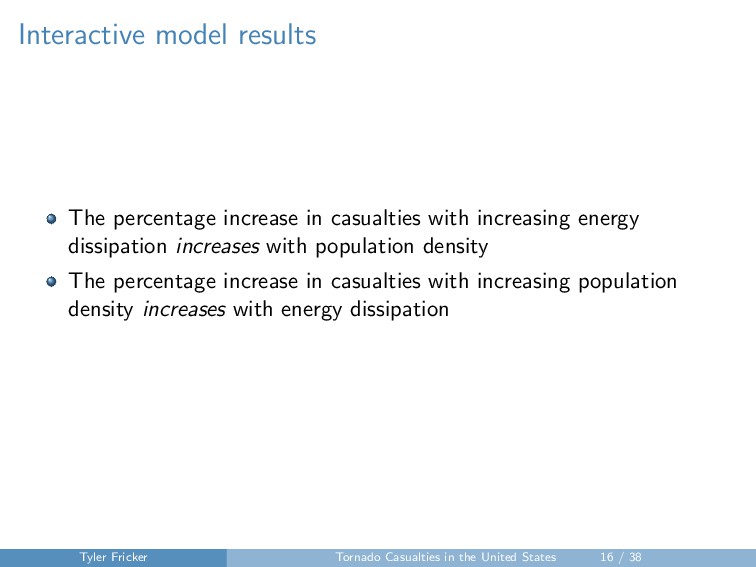
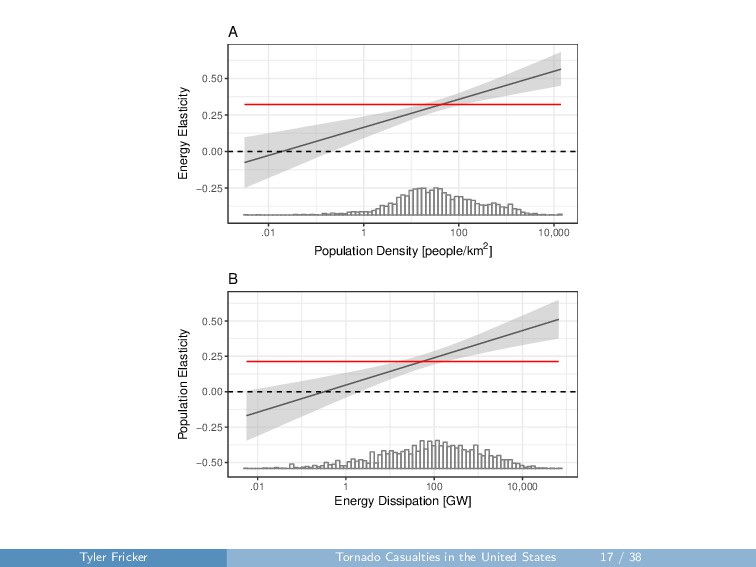
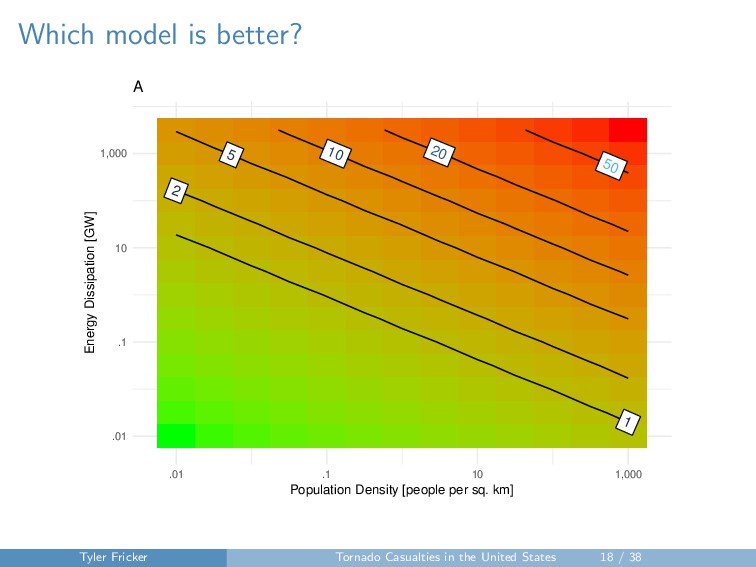
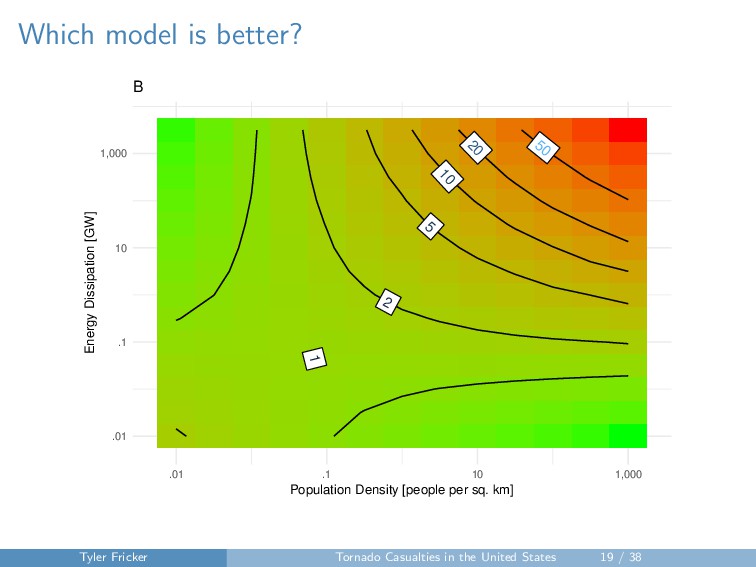
energy dissipation increases with population density The percentage increase in casualties with increasing population density increases with energy dissipation Tyler Fricker Tornado Casualties in the United States 16 / 38
[people/km2] Energy Elasticity A −0.50 −0.25 0.00 0.25 0.50 .01 1 100 10,000 Energy Dissipation [GW] Population Elasticity B Tyler Fricker Tornado Casualties in the United States 17 / 38
.01 .1 10 1,000 .01 .1 10 1,000 Population Density [people per sq. km] Energy Dissipation [GW] A Tyler Fricker Tornado Casualties in the United States 18 / 38
.01 .1 10 1,000 .01 .1 10 1,000 Population Density [people per sq. km] Energy Dissipation [GW] B Tyler Fricker Tornado Casualties in the United States 19 / 38
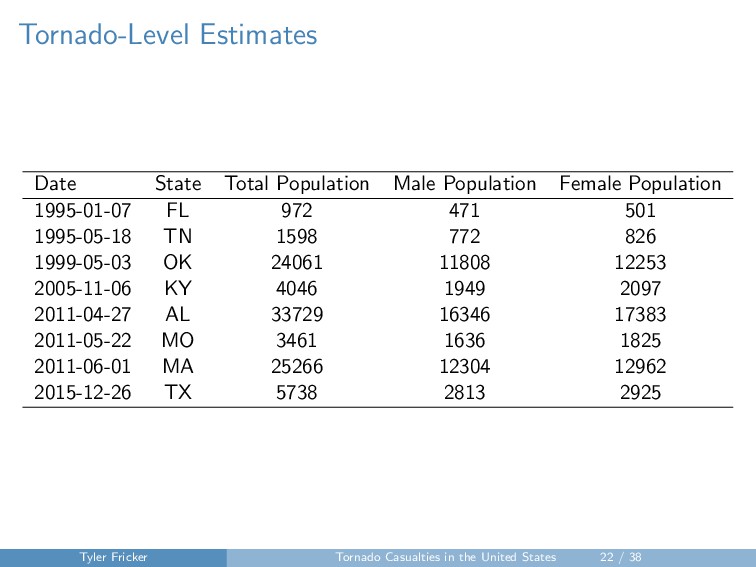
T (2020). “Tornado-Level Estimates of Socioeconomic and Demographic Variables”. In: Natural Hazards Review. Tyler Fricker Tornado Casualties in the United States 20 / 38
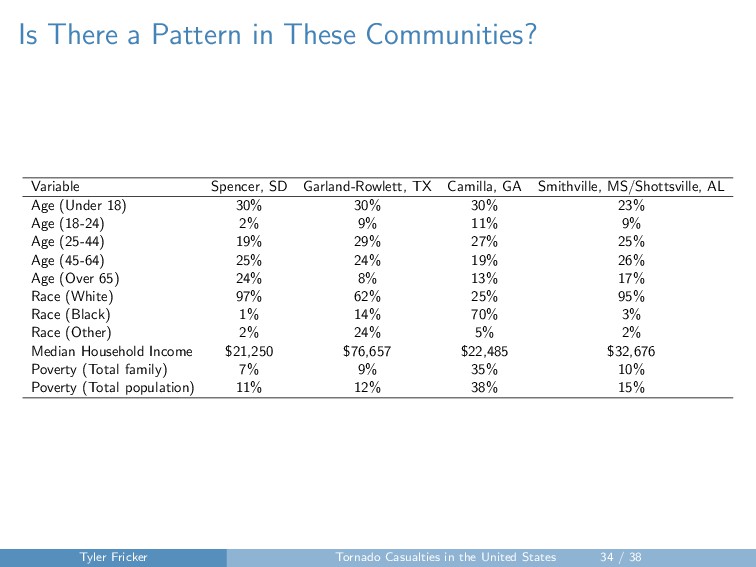
Total Population 624 3.63 39.7 242 Population Density 132 6.23 17.5 57.2 Number of Males 303 1.80 19.7 119 Number of Females 321 1.85 19.9 122 Population Under 17 158 .900 9.90 59.8 Population 18-44 240 1.24 13.3 85.8 Population 45-64 149 .931 9.98 60.0 Population Over 65 76.4 .481 5.50 33.5 White Population 421 2.92 31.4 189 Black Population 155 .020 .870 15.5 Household Median Income $48,500 $38,700 $46,000 $55,400 Number of Mobile Homes 20.4 .168 2.11 11.9 Tyler Fricker Tornado Casualties in the United States 23 / 38
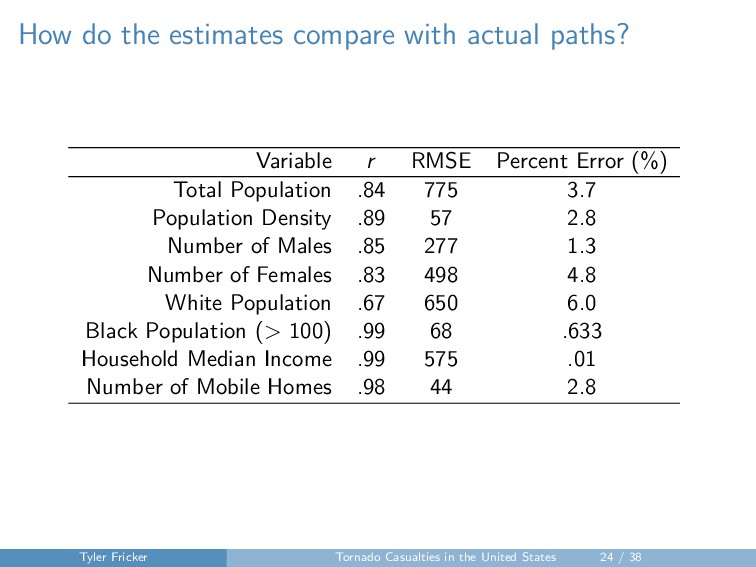
RMSE Percent Error (%) Total Population .84 775 3.7 Population Density .89 57 2.8 Number of Males .85 277 1.3 Number of Females .83 498 4.8 White Population .67 650 6.0 Black Population (> 100) .99 68 .633 Household Median Income .99 575 .01 Number of Mobile Homes .98 44 2.8 Tyler Fricker Tornado Casualties in the United States 24 / 38
Devastating Tornadoes in the United States: 1995–2016”. In: Annals of the American Association of Geographers. Tyler Fricker Tornado Casualties in the United States 25 / 38
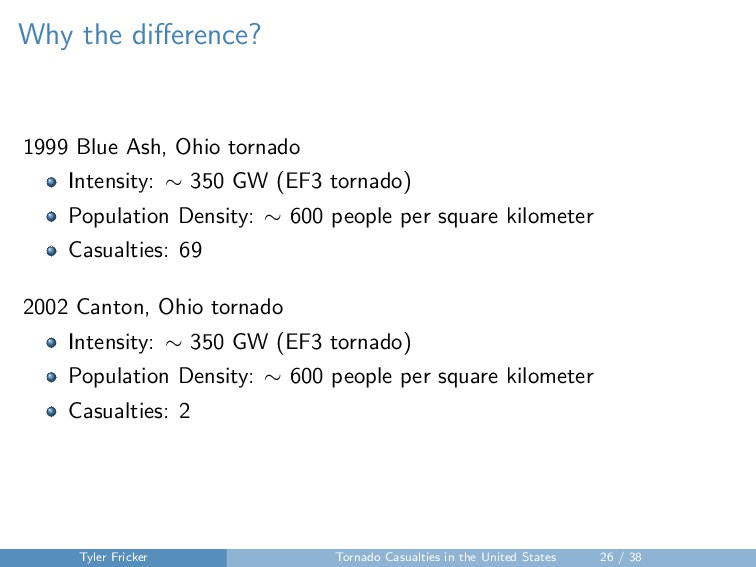
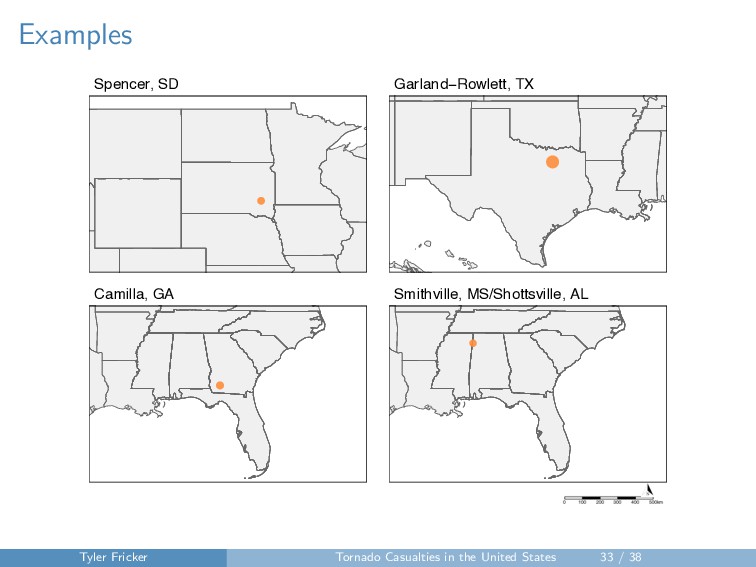
350 GW (EF3 tornado) Population Density: ∼ 600 people per square kilometer Casualties: 69 2002 Canton, Ohio tornado Intensity: ∼ 350 GW (EF3 tornado) Population Density: ∼ 600 people per square kilometer Casualties: 2 Tyler Fricker Tornado Casualties in the United States 26 / 38
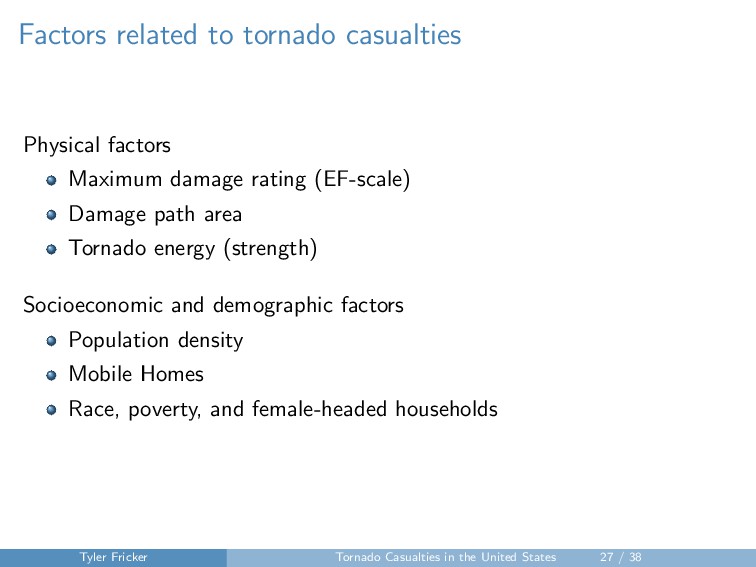
(EF-scale) Damage path area Tornado energy (strength) Socioeconomic and demographic factors Population density Mobile Homes Race, poverty, and female-headed households Tyler Fricker Tornado Casualties in the United States 27 / 38
to: Determine what factors are important in explaining the number or rate of tornado casualties Quantify the effect a single factor has on tornado casualties while controlling for the effect of the other factors Tyler Fricker Tornado Casualties in the United States 28 / 38
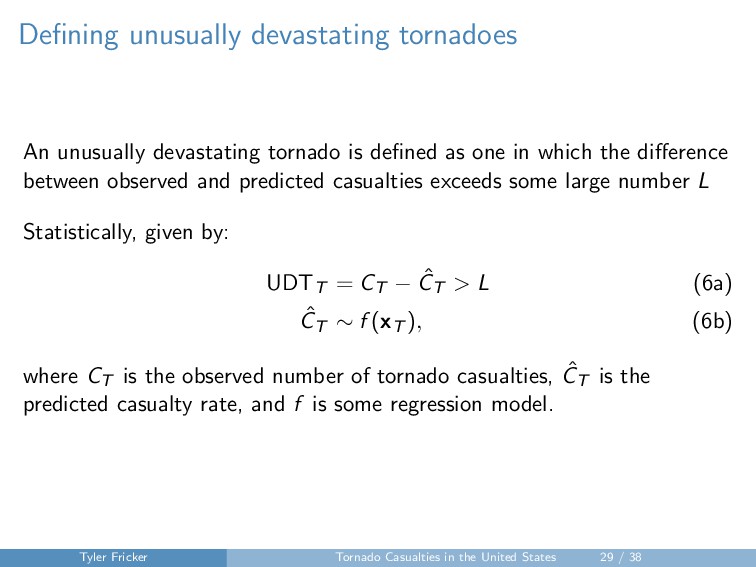
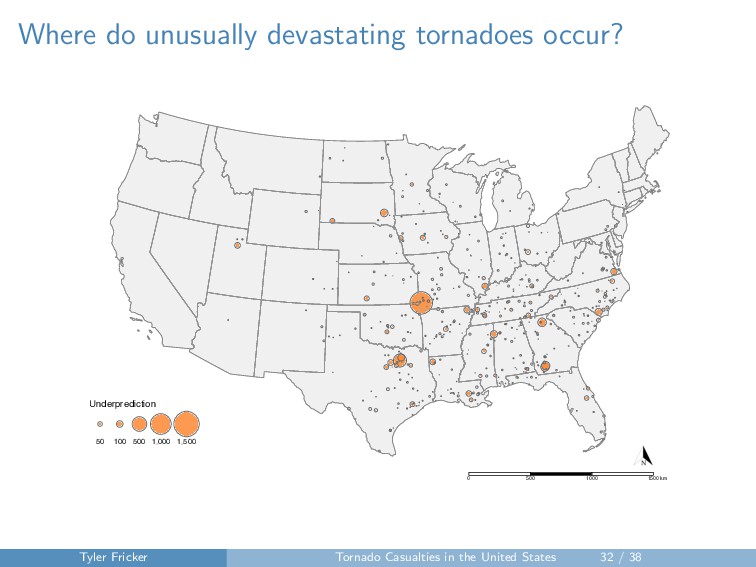
as one in which the difference between observed and predicted casualties exceeds some large number L Statistically, given by: UDTT = CT − ˆ CT > L (6a) ˆ CT ∼ f (xT ), (6b) where CT is the observed number of tornado casualties, ˆ CT is the predicted casualty rate, and f is some regression model. Tyler Fricker Tornado Casualties in the United States 29 / 38
socioeconomic, and demographic variables: Tornado energy (strength) Population density Mobile homes Year of occurrence Month of occurrence Hour of occurrence Tyler Fricker Tornado Casualties in the United States 30 / 38
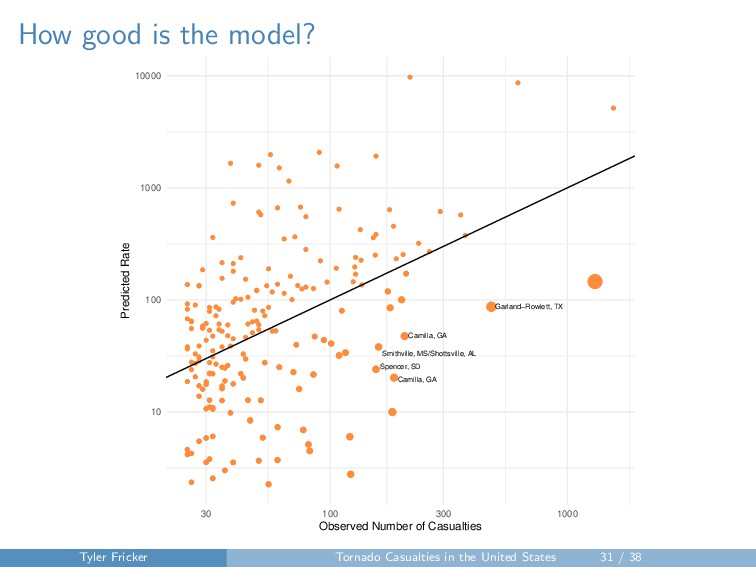
GA Smithville, MS/Shottsville, AL Garland−Rowlett, TX 10 100 1000 10000 30 100 300 1000 Observed Number of Casualties Predicted Rate Tyler Fricker Tornado Casualties in the United States 31 / 38
States, but are more consistent across portions of the Great Plains, Ohio Valley, and Southeast The use of an interactive model is preferred over the use of an additive model for tornado casualties Having estimates of socioeconomic and demographic variables at the individual tornado level can improve models for tornado casualties Examples of unusually devastating tornadoes can provide insight into communities at risk to high casualty counts Tyler Fricker Tornado Casualties in the United States 36 / 38
from a purely quantitative understanding of tornado casualties Place-based analysis should identify and investigate community-level causal relationships Complex, critical physical geography—grounded at the nexus of tornado characteristics and shared socioeconomic and historical contexts—may be the foundation for effective intervention strategies Tyler Fricker Tornado Casualties in the United States 37 / 38
![Tornado casualty rates Casualty Rate [per capita] 0% to 14%](https://files.speakerdeck.com/presentations/4bff4ee8575b4fd99a8517217741b9da/slide_10.jpg)