Upgrade to Pro
— share decks privately, control downloads, hide ads and more …
Speaker Deck
Features
Speaker Deck
PRO
Sign in
Sign up for free
Search
Search
d3.js
Search
Sponsored
·
Your Podcast. Everywhere. Effortlessly.
Share. Educate. Inspire. Entertain. You do you. We'll handle the rest.
→
tgolen
March 20, 2012
Education
200
0
Share
d3.js
An introduction to d3.js
tgolen
March 20, 2012
Other Decks in Education
See All in Education
計算物理におけるGitの使い方 / 01-c-compphys
kaityo256
PRO
2
600
Tangible, Embedded and Embodied Interaction - Lecture 7 - Next Generation User Interfaces (4018166FNR)
signer
PRO
0
2.2k
リモートリポジトリの操作 / 02-c-remote
kaityo256
PRO
0
160
SL AMIGOS 教育格差と私たちの取り組み - スリランカの支援学校への支援プロジェクト:リシンドゥ リオ 氏 (別府溝部学園短期大学 ビジネス観光コース 留学生):2720 Japan O.K. ロータリーEクラブ2026年4月6日卓話
2720japanoke
0
550
AI時代において英語学習は本当に必要? ~未経験からのバイリンガルキャリアの始め方を教えます~
kekekenta
0
130
0415
cbtlibrary
0
140
Data Physicalisation - Lecture 9 - Next Generation User Interfaces (4018166FNR)
signer
PRO
1
910
Fulbright DAI 2025 學人經驗分享
joannie
0
810
共感から、つくる: 変わり続ける自分と、誰かのための創造
micknerd
1
320
教育現場から見た Ruby on Rails
yasslab
PRO
0
120
Multimodal Interaction - Lecture 3 - Next Generation User Interfaces (4018166FNR)
signer
PRO
0
2.1k
青森県の人口減少について | | 下山学園高等学校
aomori6
0
130
Featured
See All Featured
Git: the NoSQL Database
bkeepers
PRO
432
67k
CSS Pre-Processors: Stylus, Less & Sass
bermonpainter
360
30k
Utilizing Notion as your number one productivity tool
mfonobong
4
290
How to Align SEO within the Product Triangle To Get Buy-In & Support - #RIMC
aleyda
2
1.5k
The agentic SEO stack - context over prompts
schlessera
0
760
Templates, Plugins, & Blocks: Oh My! Creating the theme that thinks of everything
marktimemedia
31
2.8k
Marketing Yourself as an Engineer | Alaka | Gurzu
gurzu
0
180
StorybookのUI Testing Handbookを読んだ
zakiyama
31
6.7k
Introduction to Domain-Driven Design and Collaborative software design
baasie
1
740
What does AI have to do with Human Rights?
axbom
PRO
1
2.1k
Un-Boring Meetings
codingconduct
0
270
Building a Modern Day E-commerce SEO Strategy
aleyda
45
9k
Transcript
d3.js an introduction
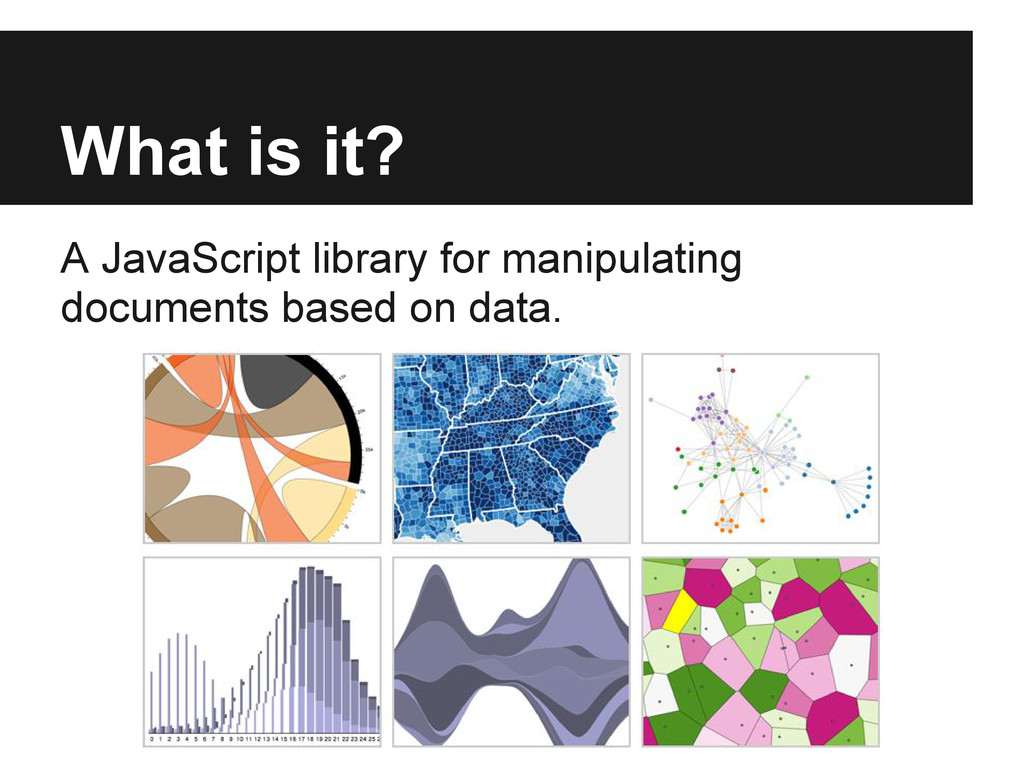
What is it? A JavaScript library for manipulating documents based
on data.
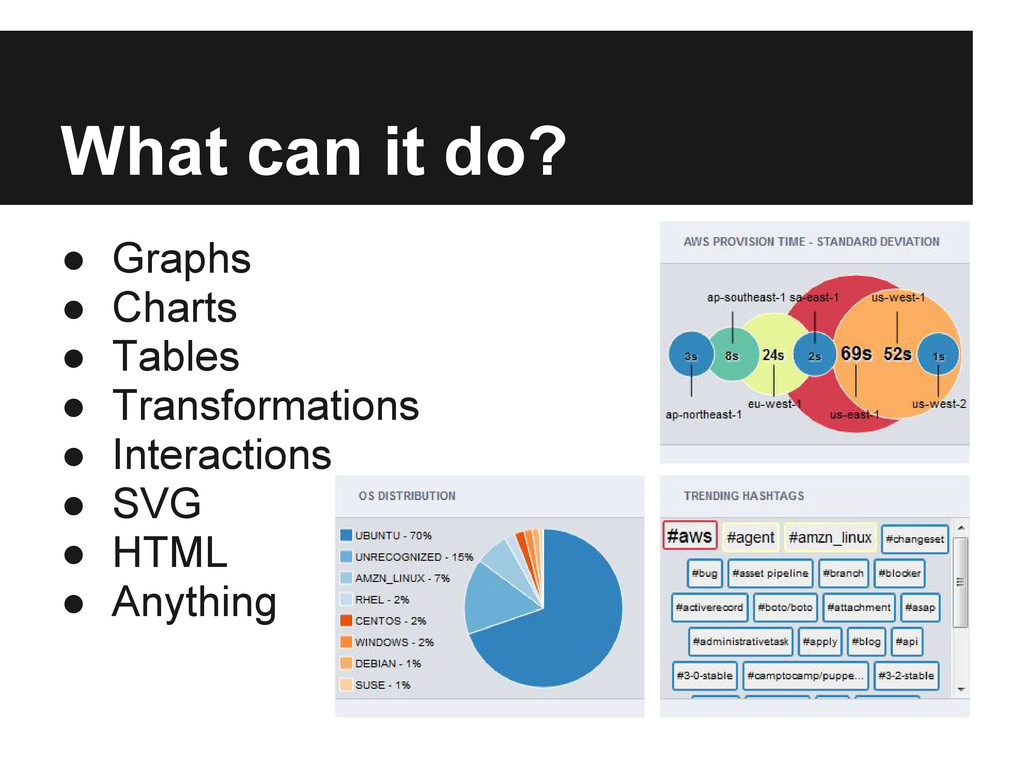
What can it do? • Graphs • Charts • Tables
• Transformations • Interactions • SVG • HTML • Anything
Examples • http://mbostock.github.com/d3/ex/calendar. html • http://mbostock.github.com/d3/ex/chord.html • http://www.visualizing. org/visualizations/urban-water-explorer/
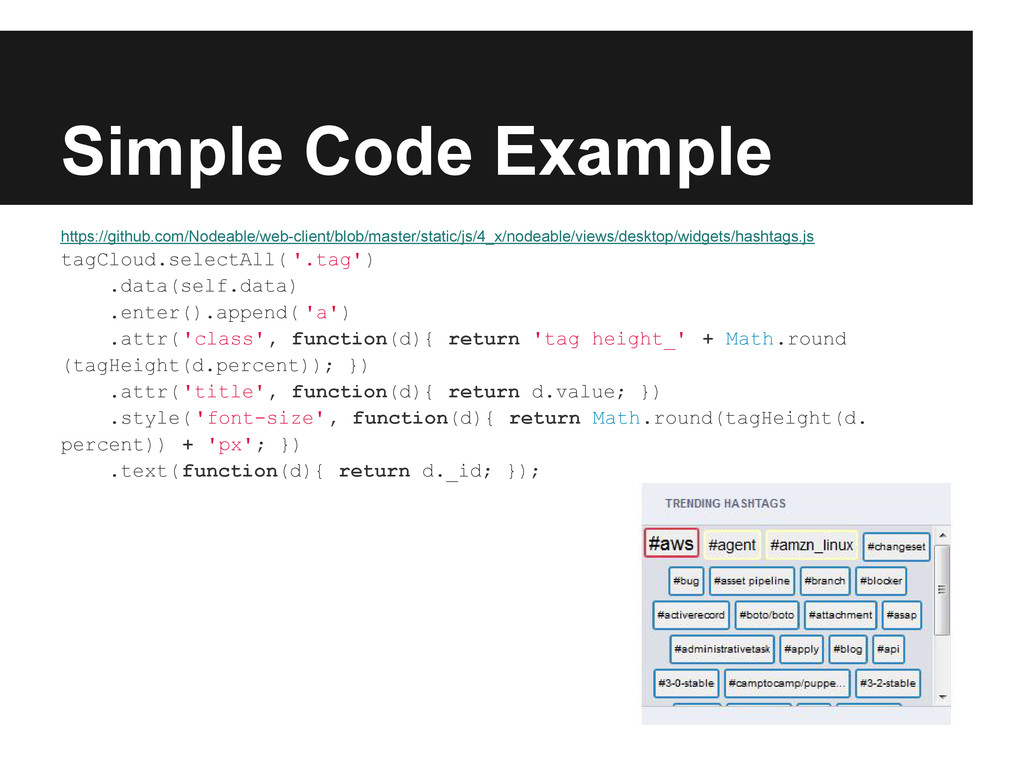
Simple Code Example https://github.com/Nodeable/web-client/blob/master/static/js/4_x/nodeable/views/desktop/widgets/hashtags.js tagCloud.selectAll( '.tag') .data(self.data) .enter().append( 'a') .attr('class',
function(d){ return 'tag height_' + Math.round (tagHeight(d.percent)); }) .attr('title', function(d){ return d.value; }) .style('font-size', function(d){ return Math.round(tagHeight(d. percent)) + 'px'; }) .text(function(d){ return d._id; });
Why should you use it? • You want to visualize
data in unique ways. • You thirst for adventure and challenge. • You don't want to use canned graphs.
Why shouldn't you use it? • It has an extremely
steep learning curve. • You can settle for more simple solutions (highcharts).
Resources d3.js - http://mbostock.github.com/d3/
Questions? Tim Golen Web Developer - Nodeable.com @tgolen http://www.golen.net