Upgrade to Pro — share decks privately, control downloads, hide ads and more …

Debugging PHP With XDebug

Debugging PHP With XDebug

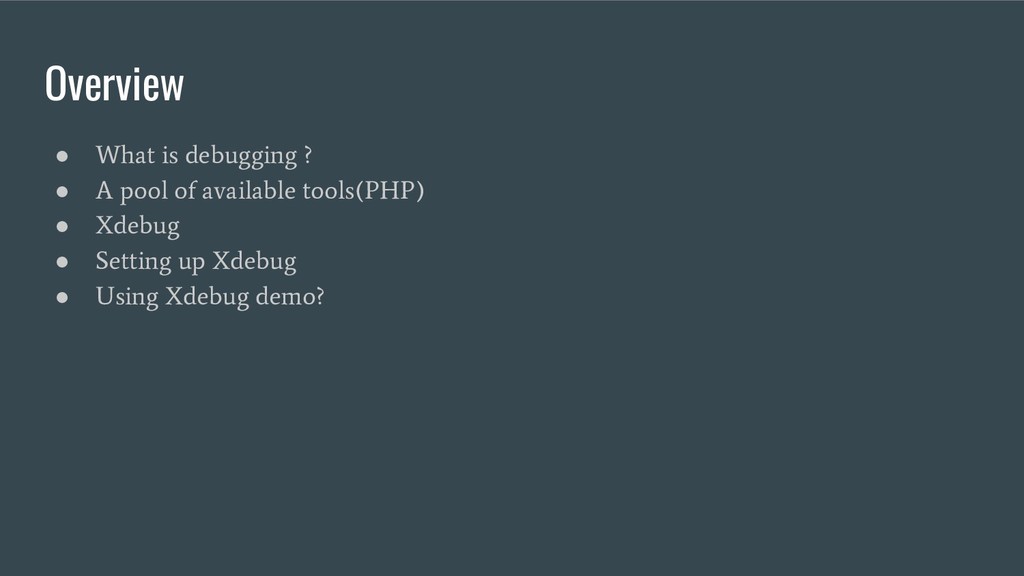
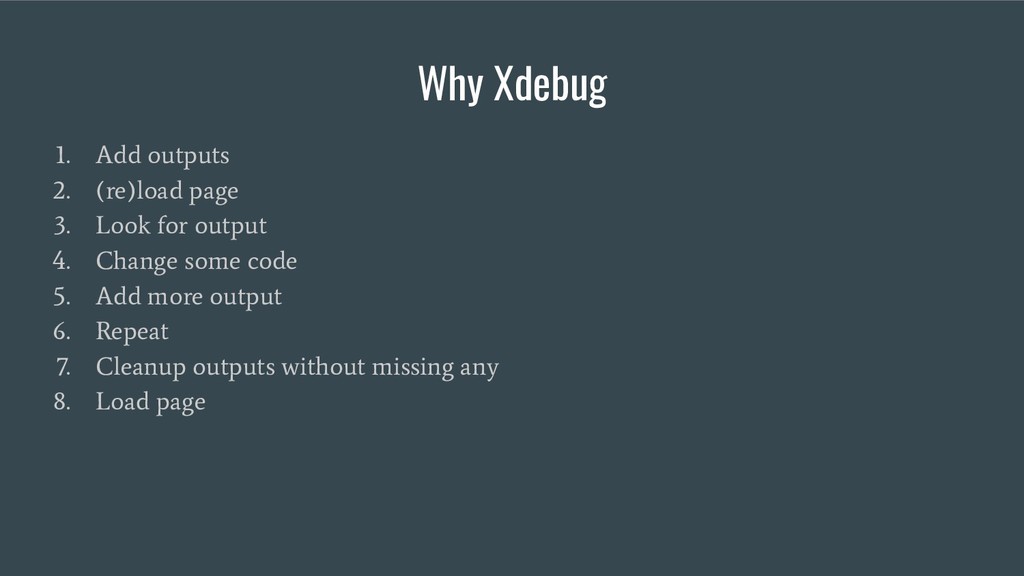
In this talk we will discuss how to debug more effectively and get a better insight into an application by using Xdebug, we will look into setting up Xdebug in Phpstorm and sublime. We will also look into enabling debugging on a browser and setting up Xdebug in Insomnia and Paw.

Avatar for Melvin

Melvin

May 15, 2019
Tweet

More Decks by Melvin

Other Decks in Programming

Transcript

  1. Ts’epo Melvin Thoabala • Software engineer at superbalist.com • Interests

    ◦ Clean code ◦ Design patterns ◦ Systems architecture and design ◦ Computer vision. • [email protected] • melvinthoabala on git* • #idonttweet
  2. Overview • What is debugging ? • A pool of

    available tools(PHP) • Xdebug • Setting up Xdebug • Using Xdebug demo?
  3. PHP Debugging tools • Xdebug ◦ Can add breakpoints and

    pause executions ◦ Support for morden IDEs • Firephp ◦ AJAX, JSON & XML • Kint • Whoops ◦ XMP & SOAP support ◦ JSON & AJAX support ◦ Code view for all frames in a stack trace with highlights • Krumo ◦ Prints out stack of variables using CSS and DHTML • PHP DebugBar ◦ Handles AJAX request
  4. • An extension for PHP for … ◦ Stack traces

    ◦ Execution traces ◦ Memory allocation ◦ Code profiling ◦ Code coverage ◦ Interactive debugging ◦ Contains single_step_debugger to use with IDEs. ◦ Provides code_covarage functionality to use with PHPUnit. ◦ Recording every function call and variable assignment.
  5. Why Xdebug Debugging without Xdebug • echo $foo; • var_dump($bar);

    • print_r($data); • error_log(__FILE__. ‘line’);
  6. Why Xdebug 1. Add outputs 2. (re)load page 3. Look

    for output 4. Change some code 5. Add more output 6. Repeat 7. Cleanup outputs without missing any 8. Load page
  7. Why use Xdebug Debugging with Xdebug 1. Turn on debugging

    2. Add breakpoint(s) 3. Load page 4. Step into code 5.
  8. Why use Xdebug • Live values • Follow actual code

    path • Full stack trace • Supported by most “modern” IDEs • Does not require code changes to interrogate values
  9. Setting up • PECL installation: ◦ pecl install xdebug ◦

    zend_extension="/usr/local/php/modules/xdebug.so • Install from source ◦ git clone git://github.com/xdebug/xdebug.git • Homebrew: ◦ brew install xdebug https://xdebug.org/docs/install
  10. Setting up • PHP_IDE_CONFIG - defines the server configuration associated

    with the application. • XDEBUG_CONFIG - allows to define some Xdebug configurations. ◦ "remote host" is the private ip of your host machine (the one your IDE is running). ◦ "remote_port" is the port that the IDE will be listening for incoming Xdebug connections.
  11. Summary • More efficient way to debug • Visibility into

    code • Watch Values change line by line • Better understanding of code path.