$30 off During Our Annual Pro Sale. View Details »

+97% of Time Reduction to Onboarding New Metrics

+97% of Time Reduction to Onboarding New Metrics

Geek Friday / HelloFresh

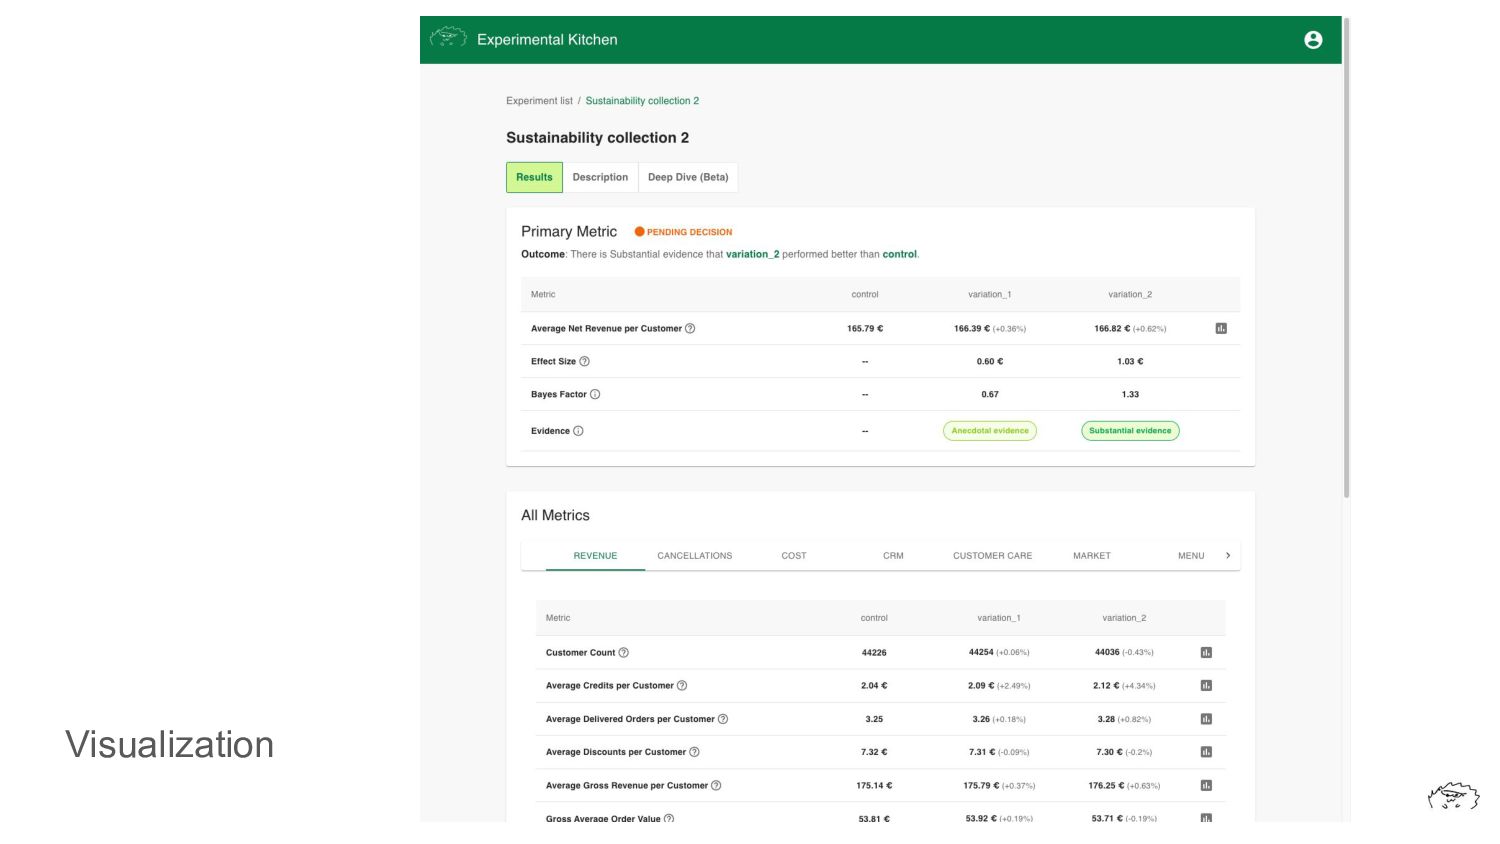
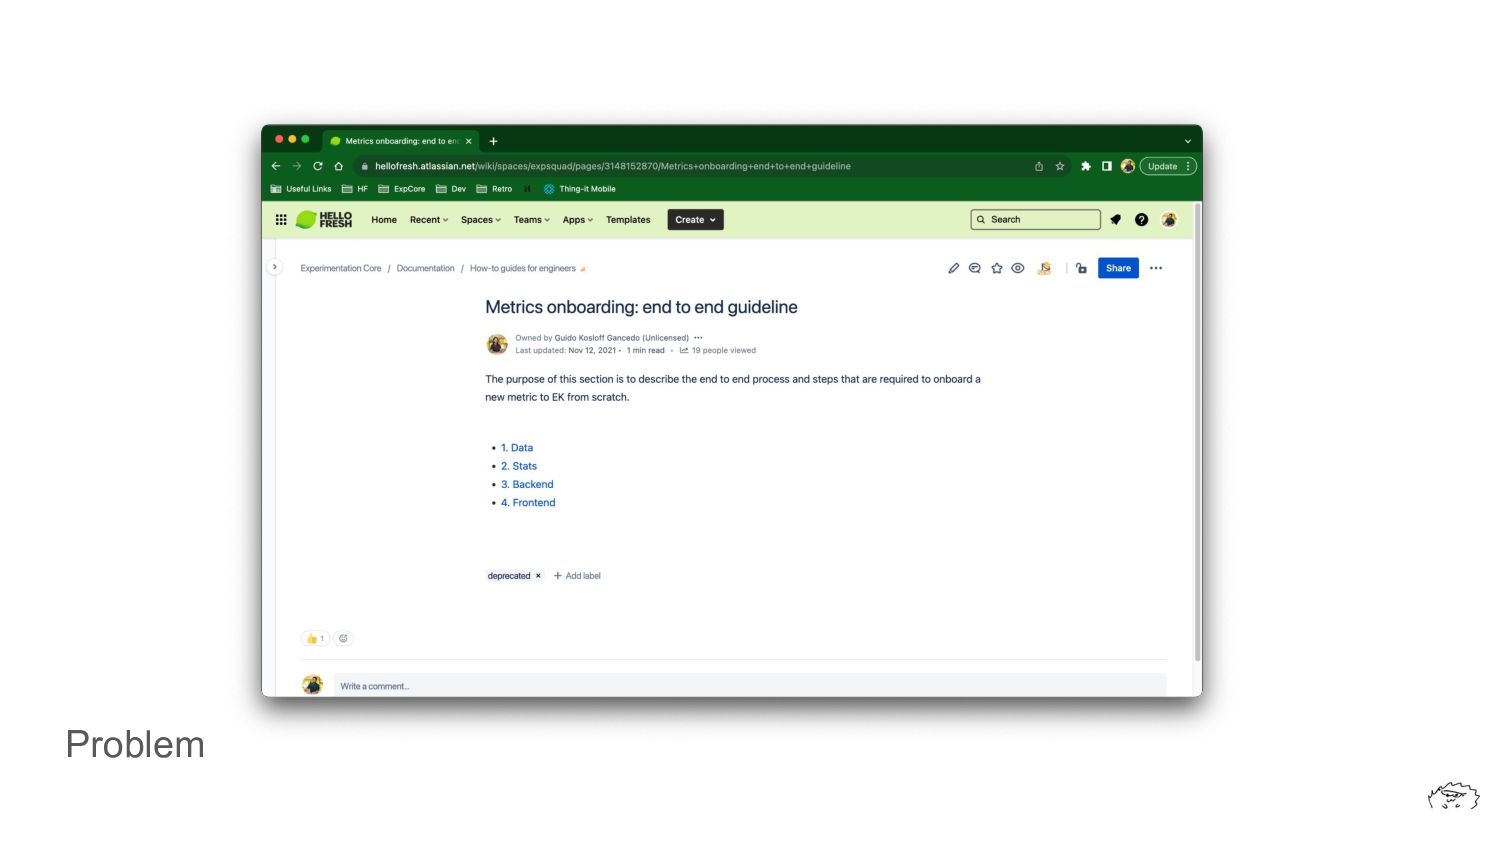
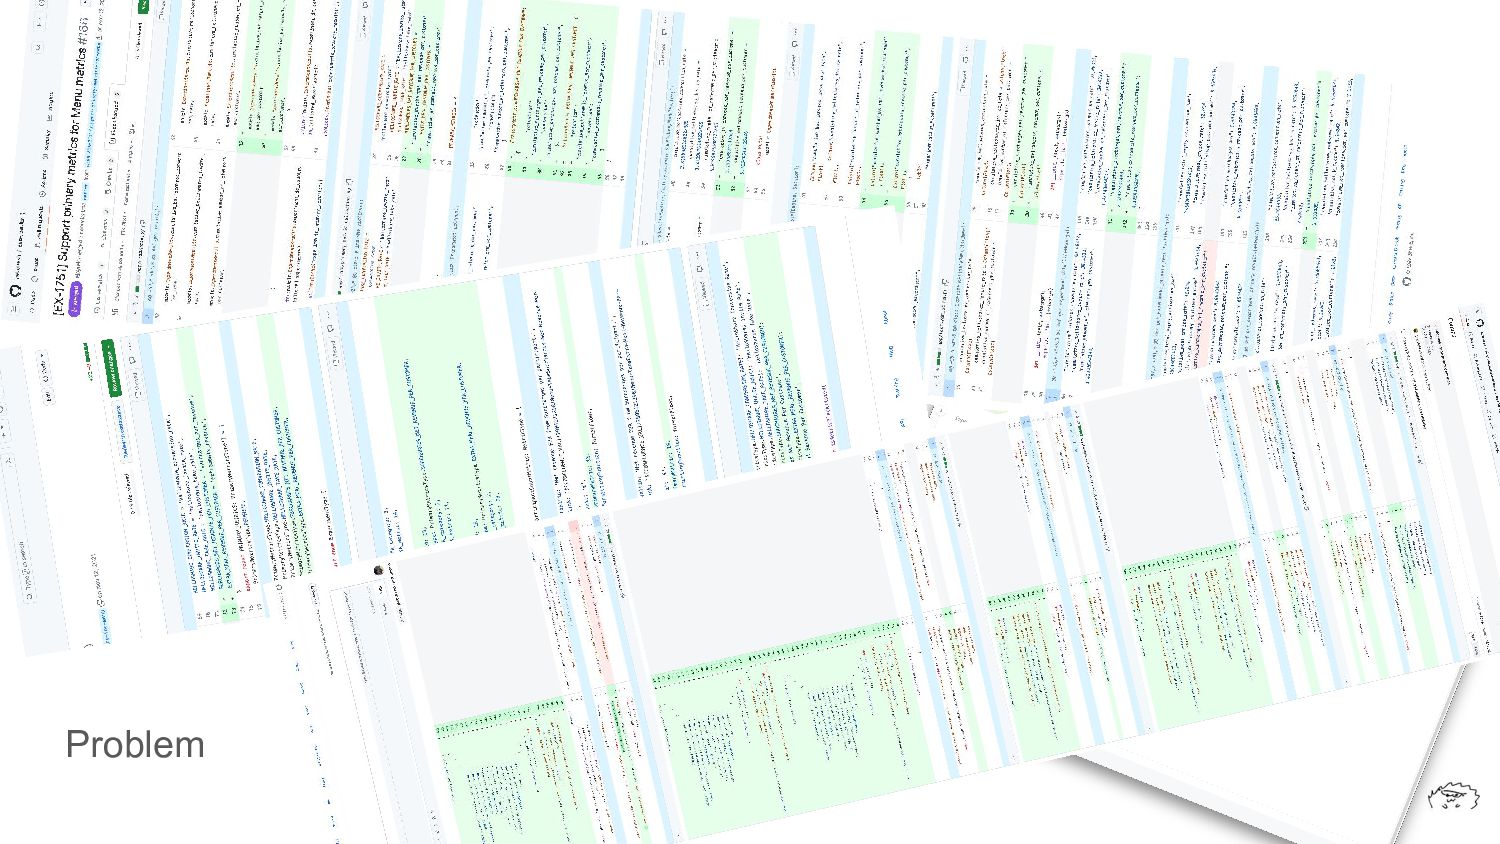
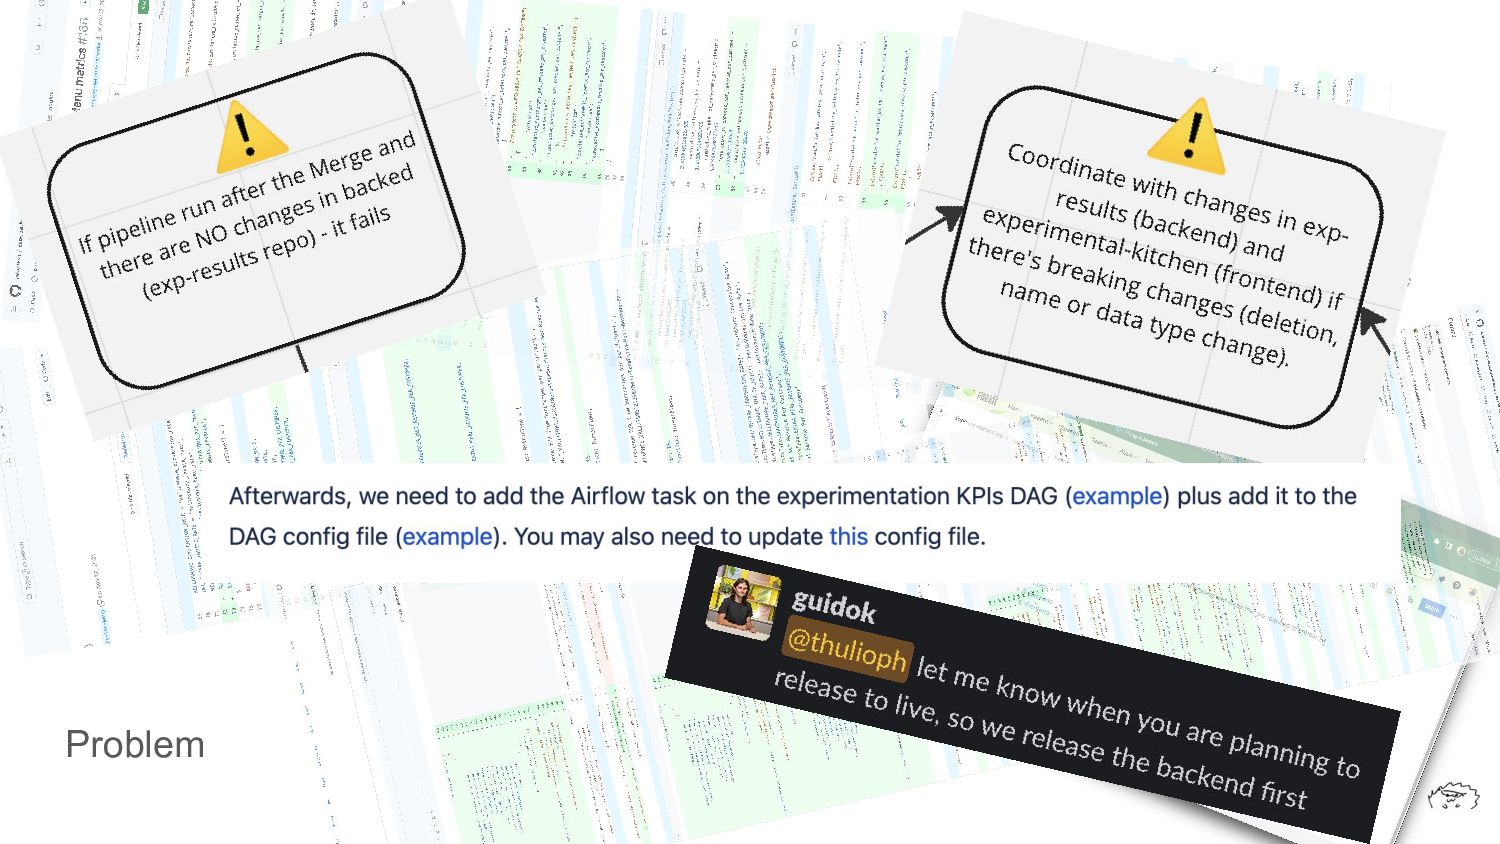
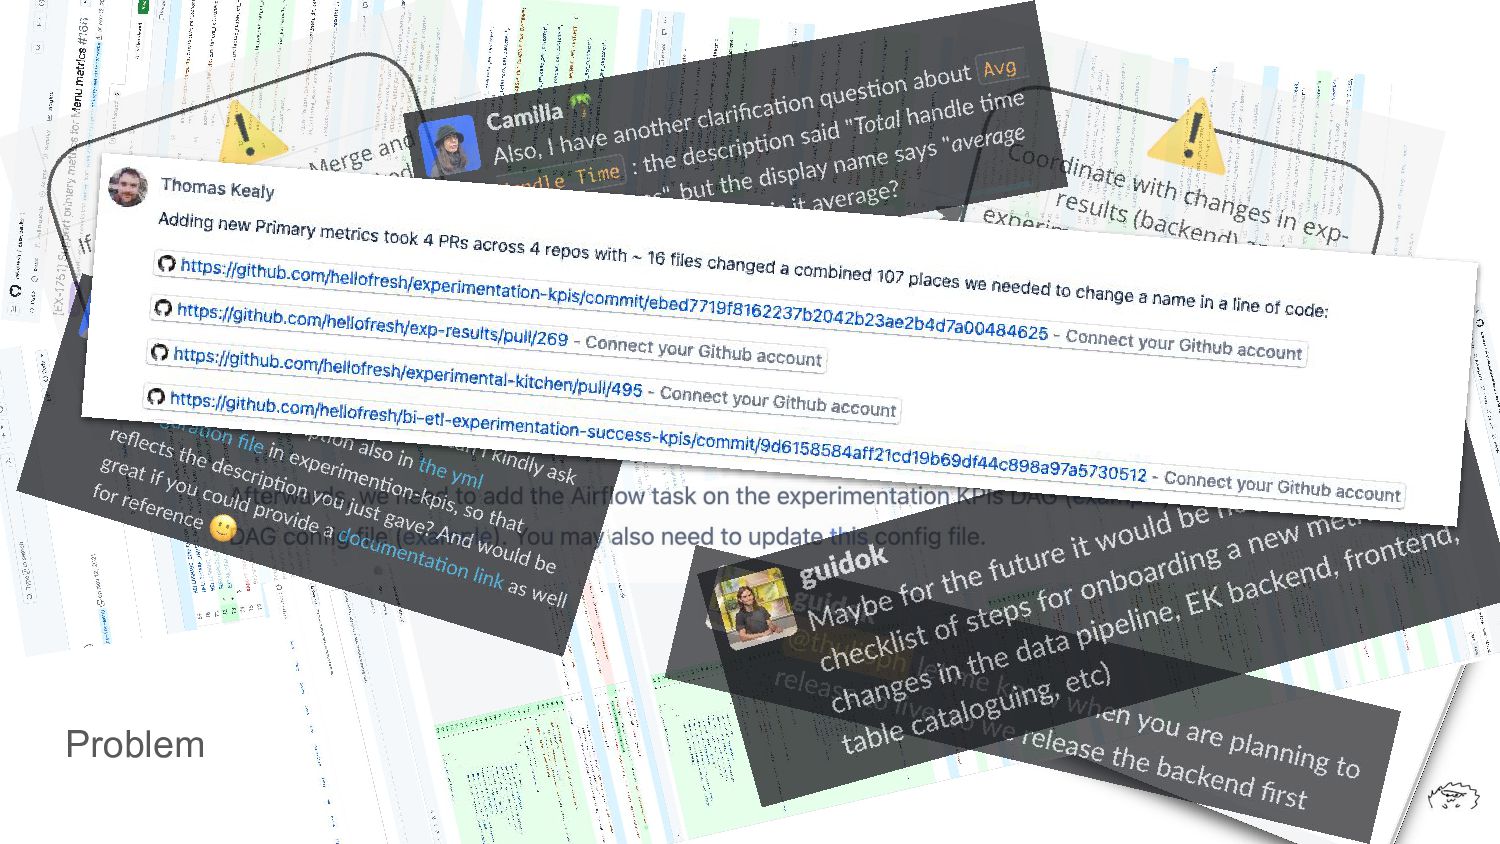
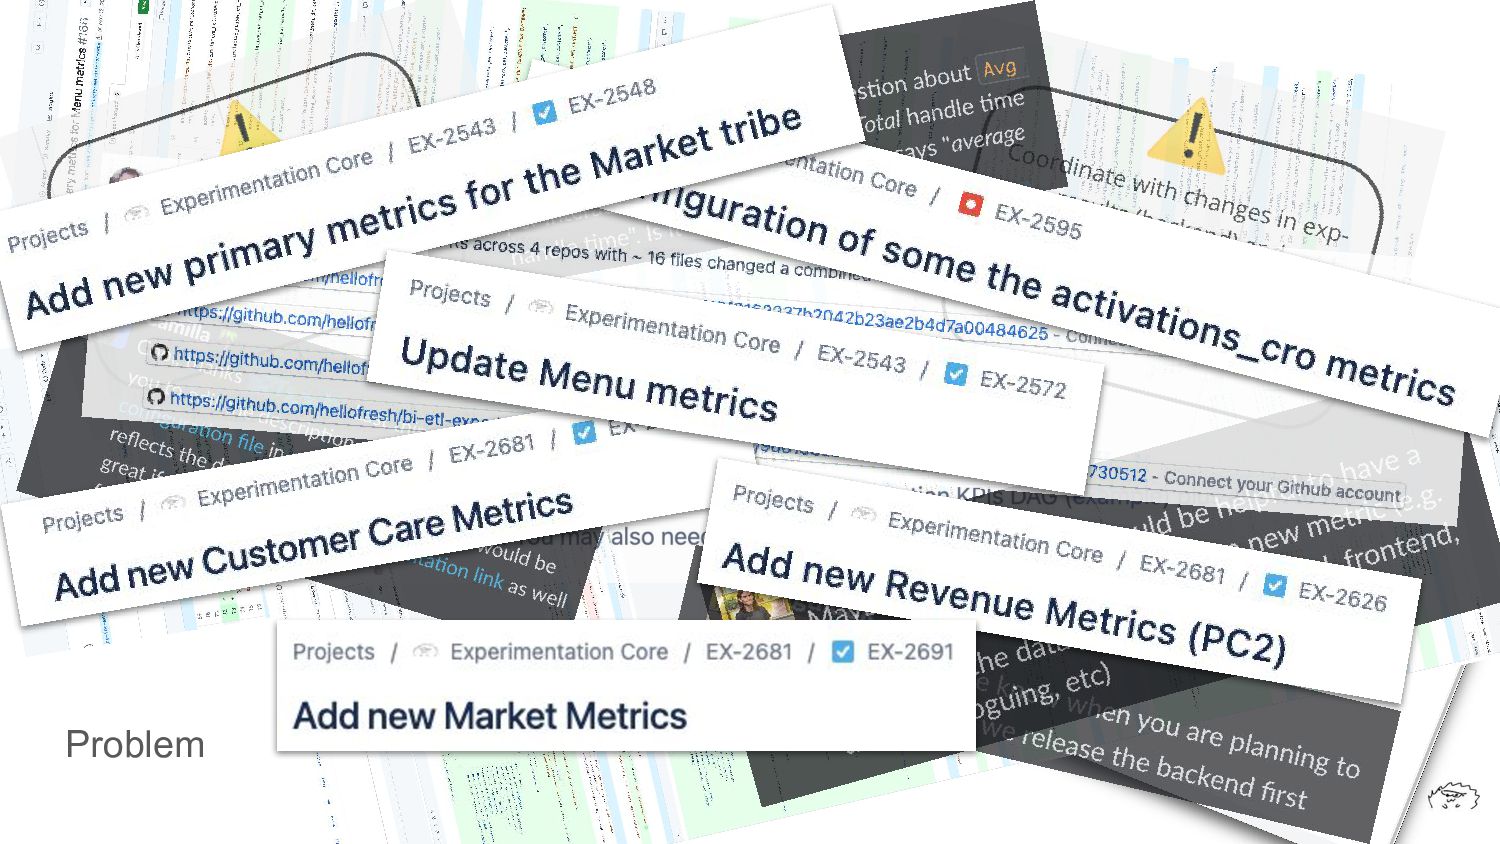
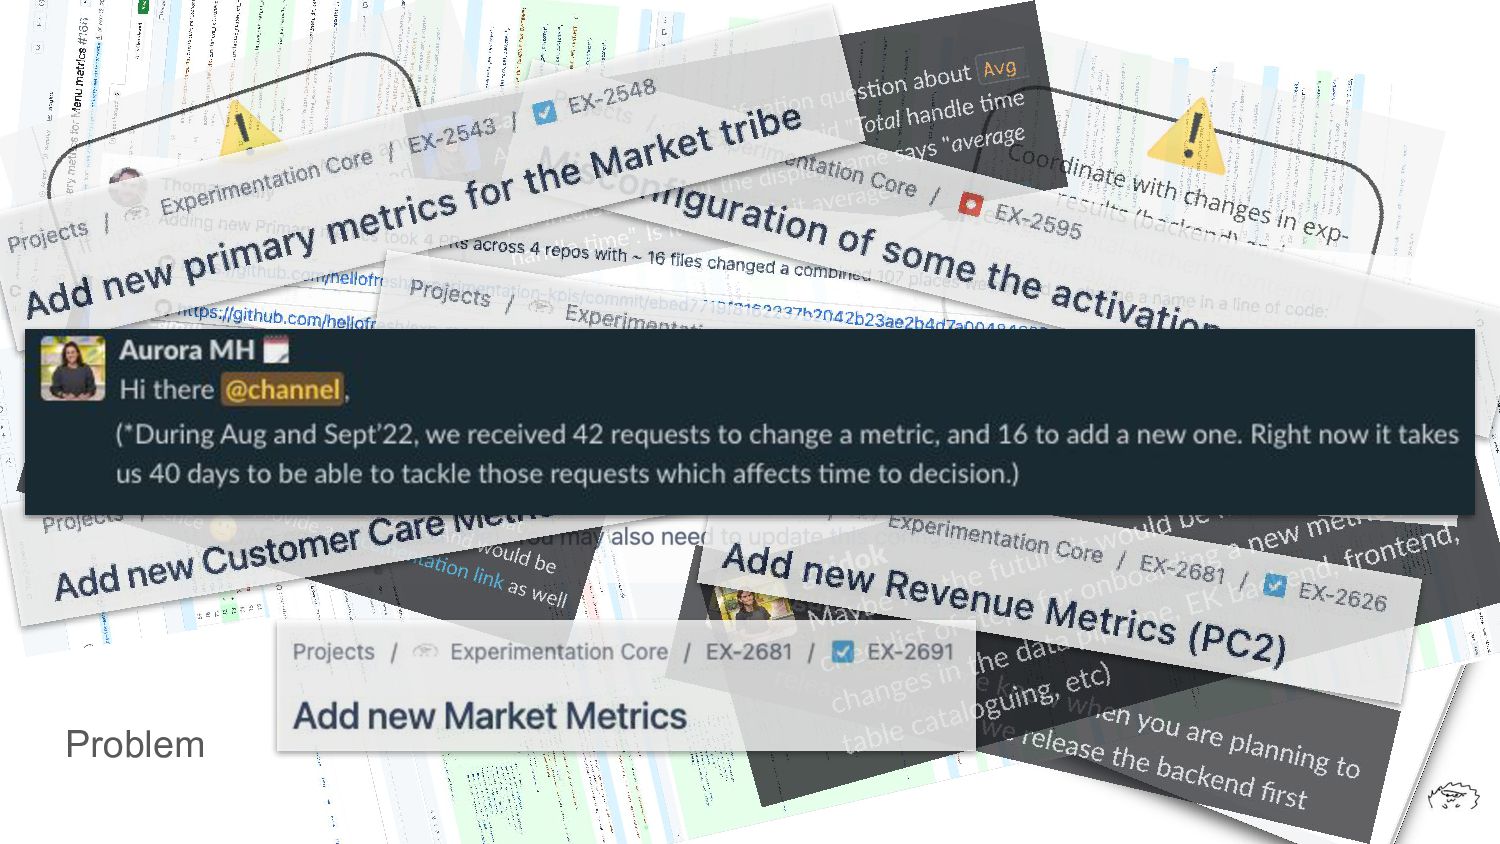
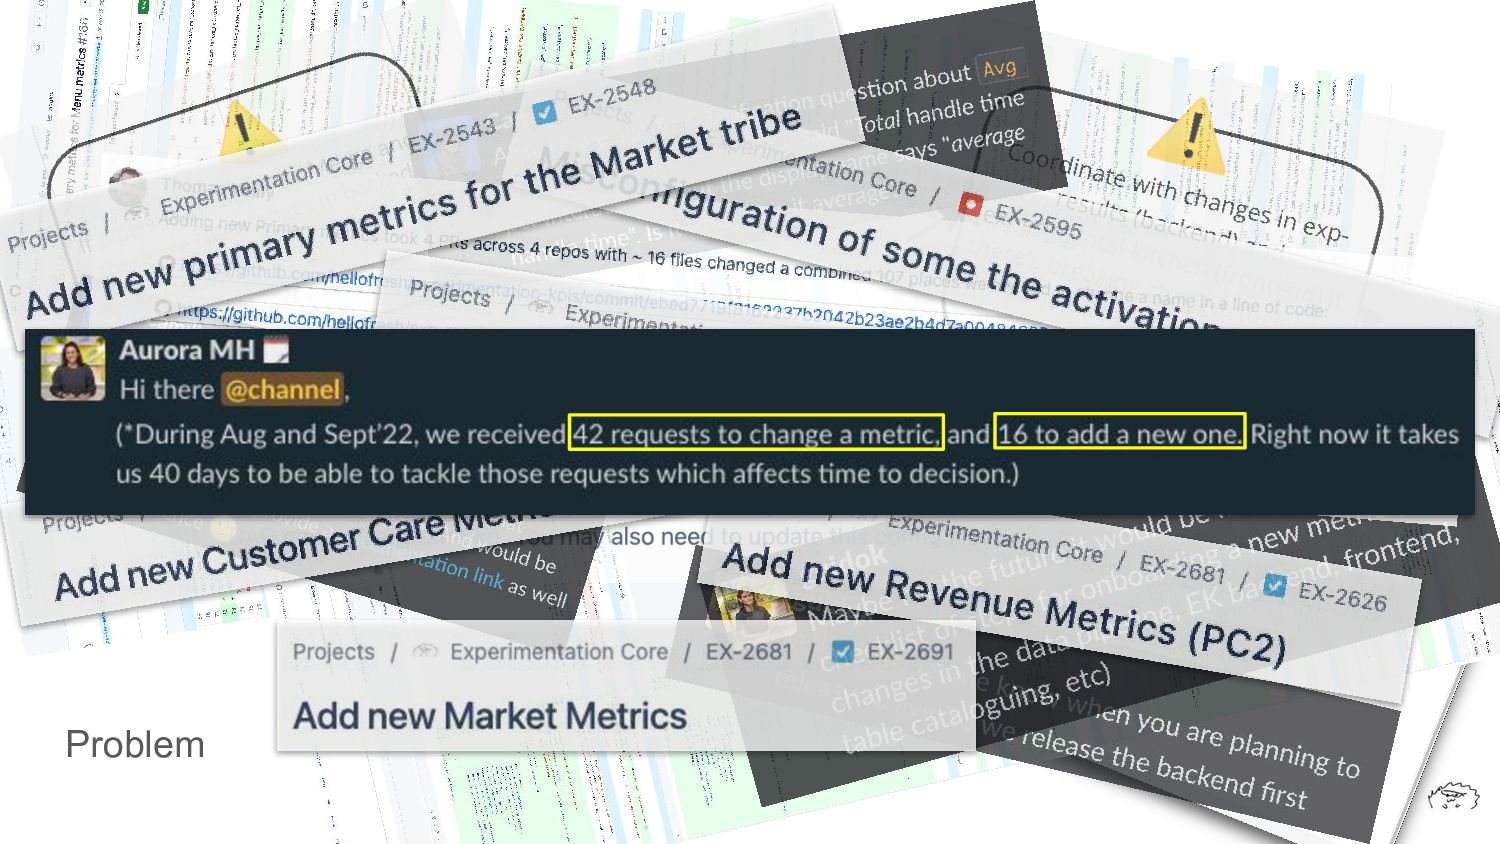
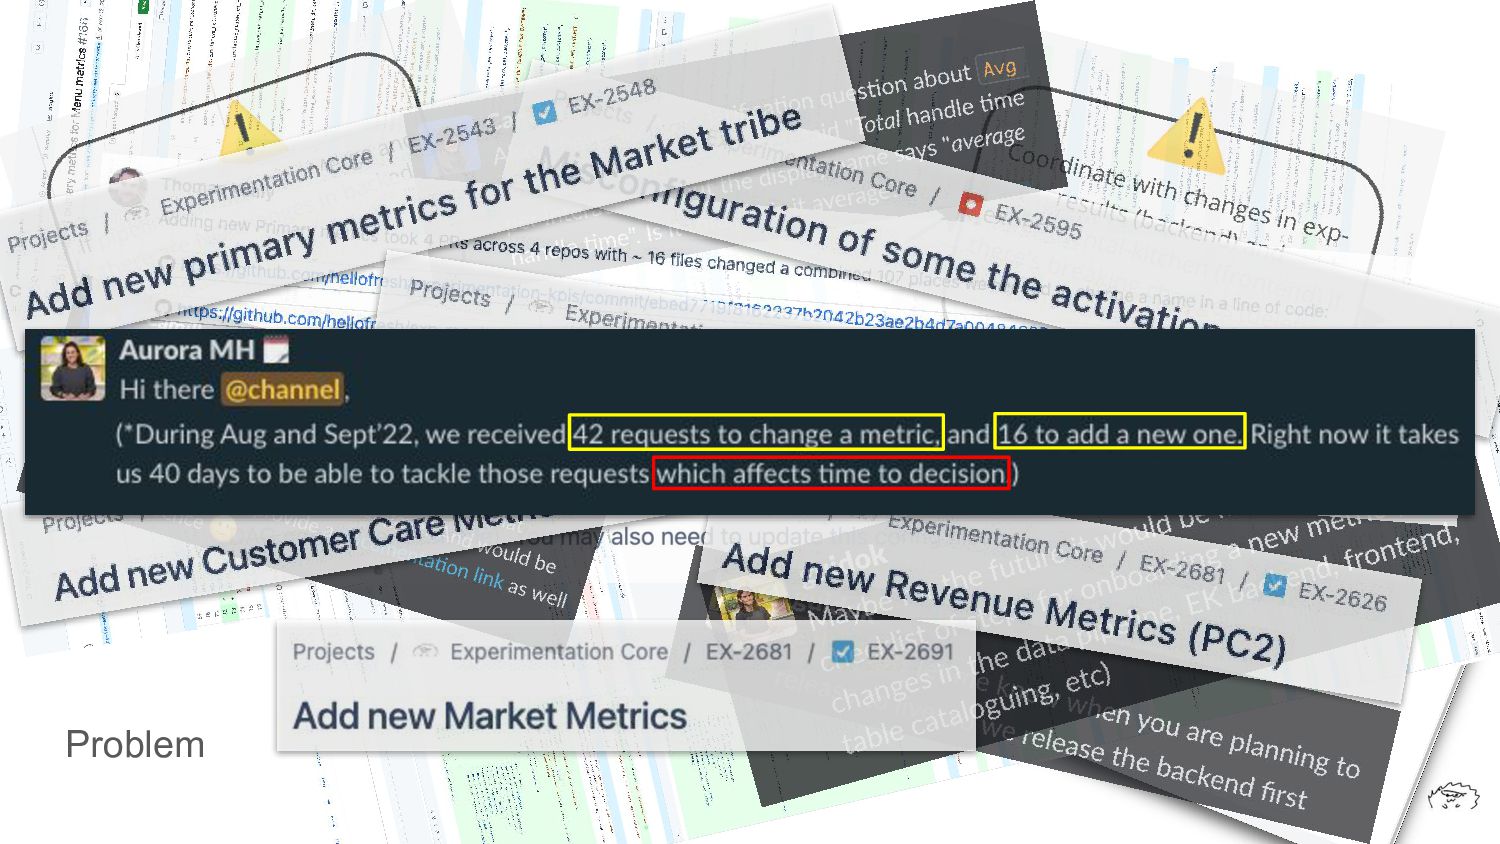
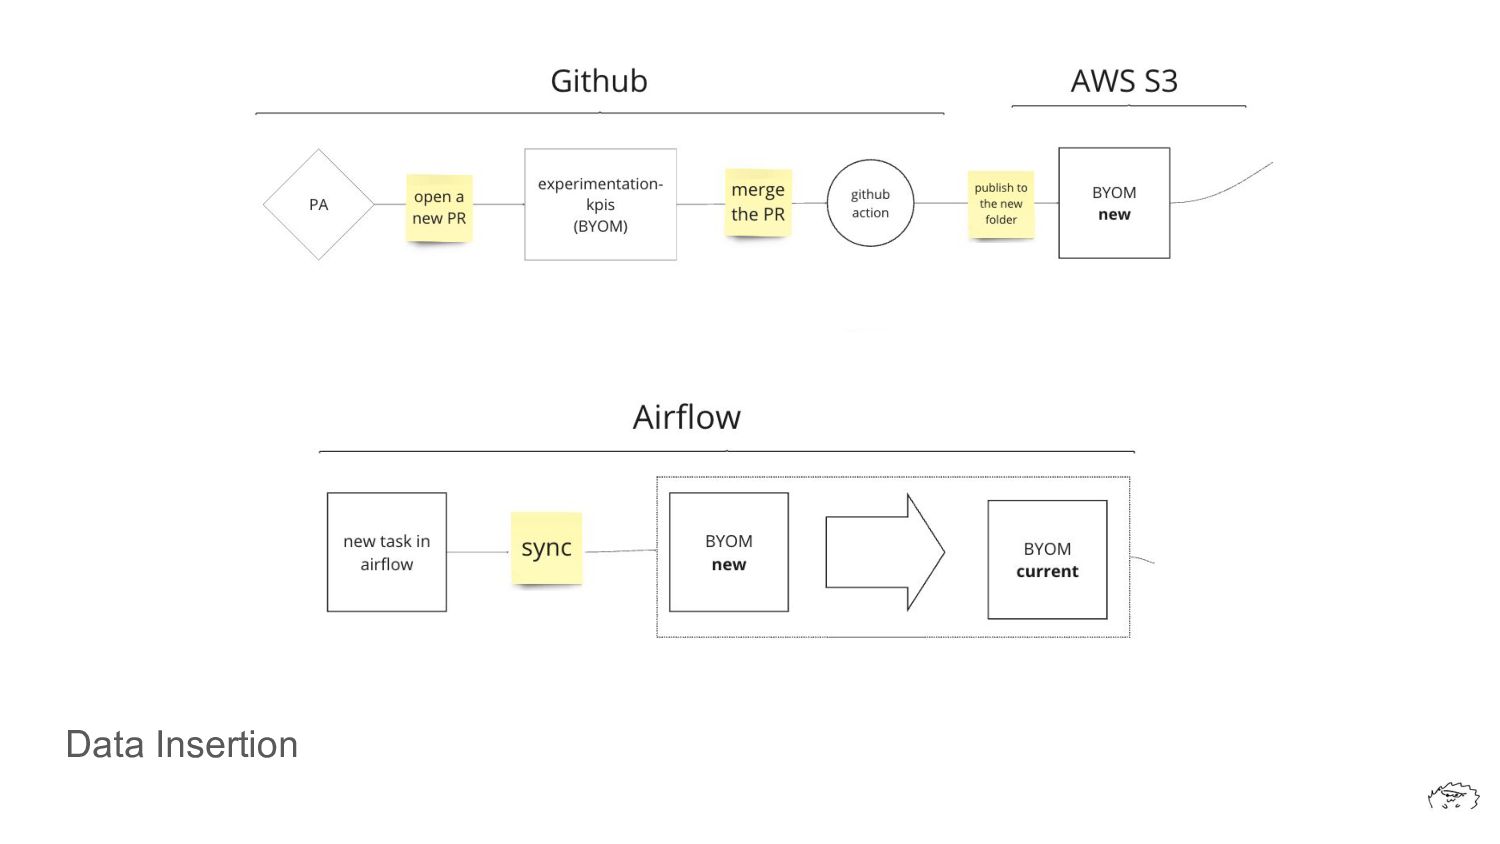
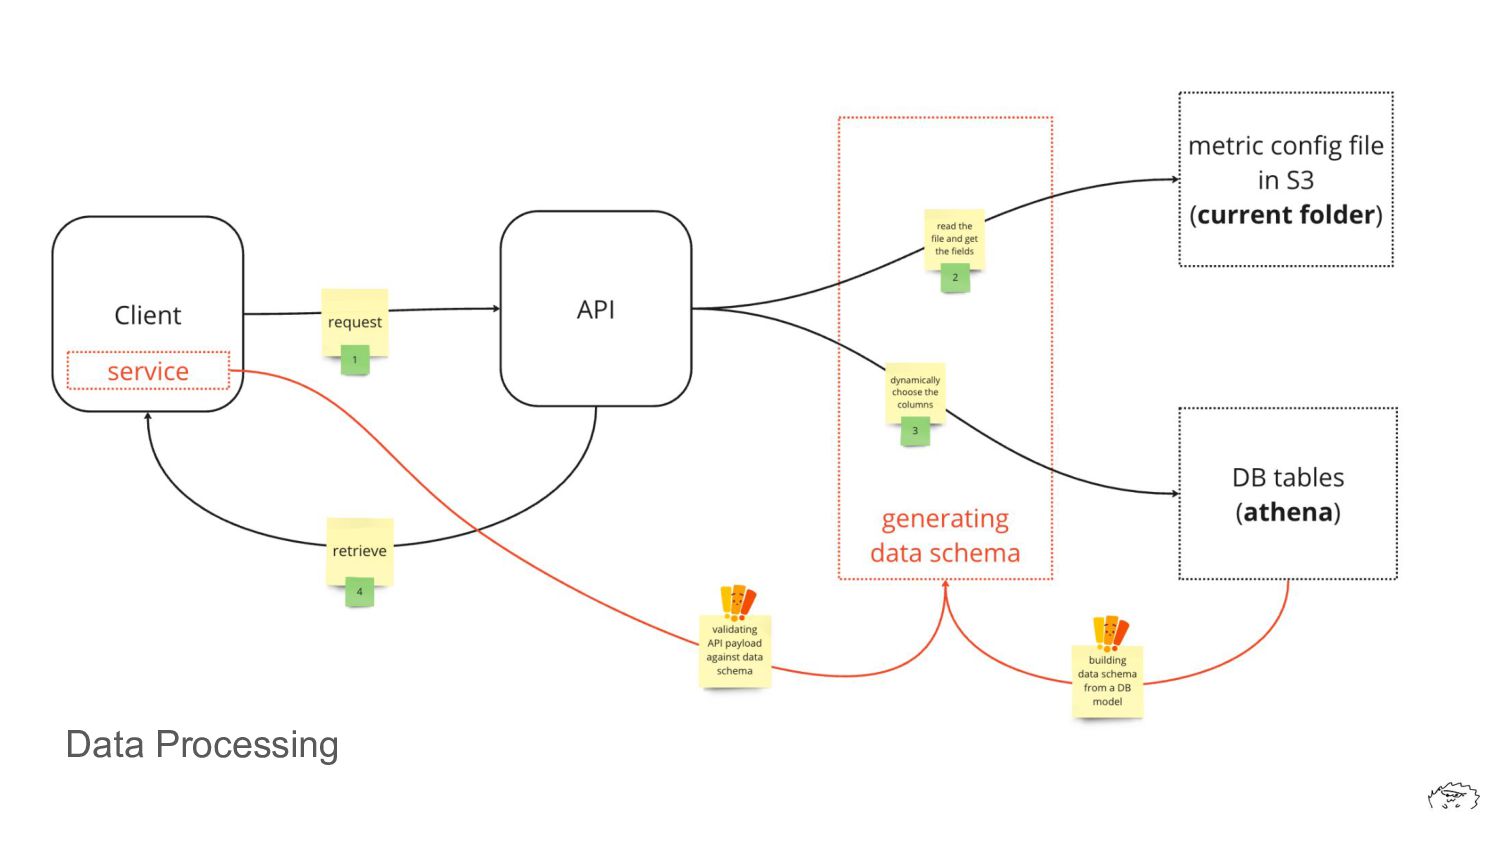
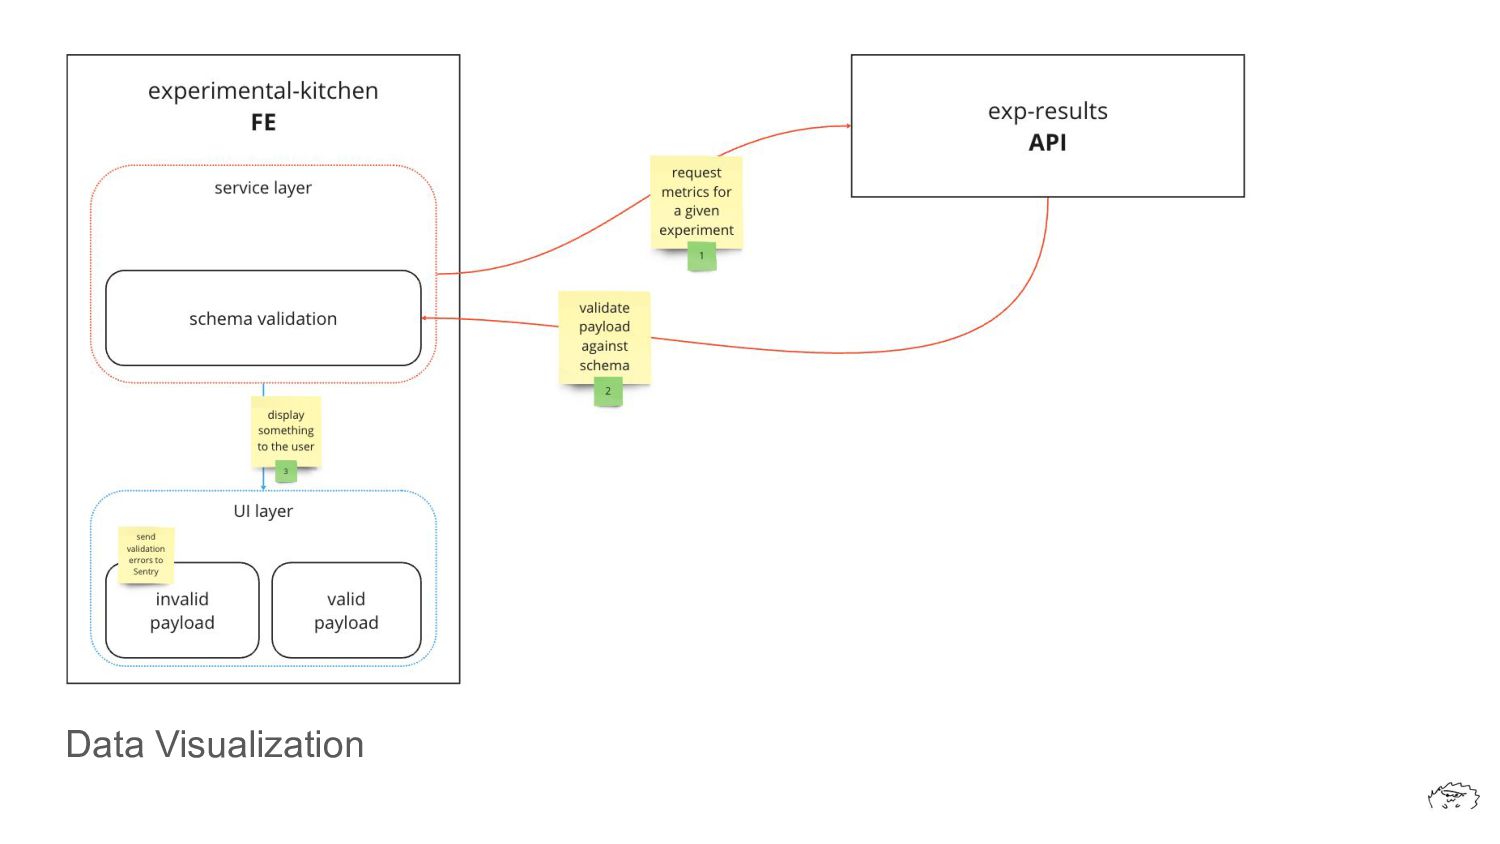
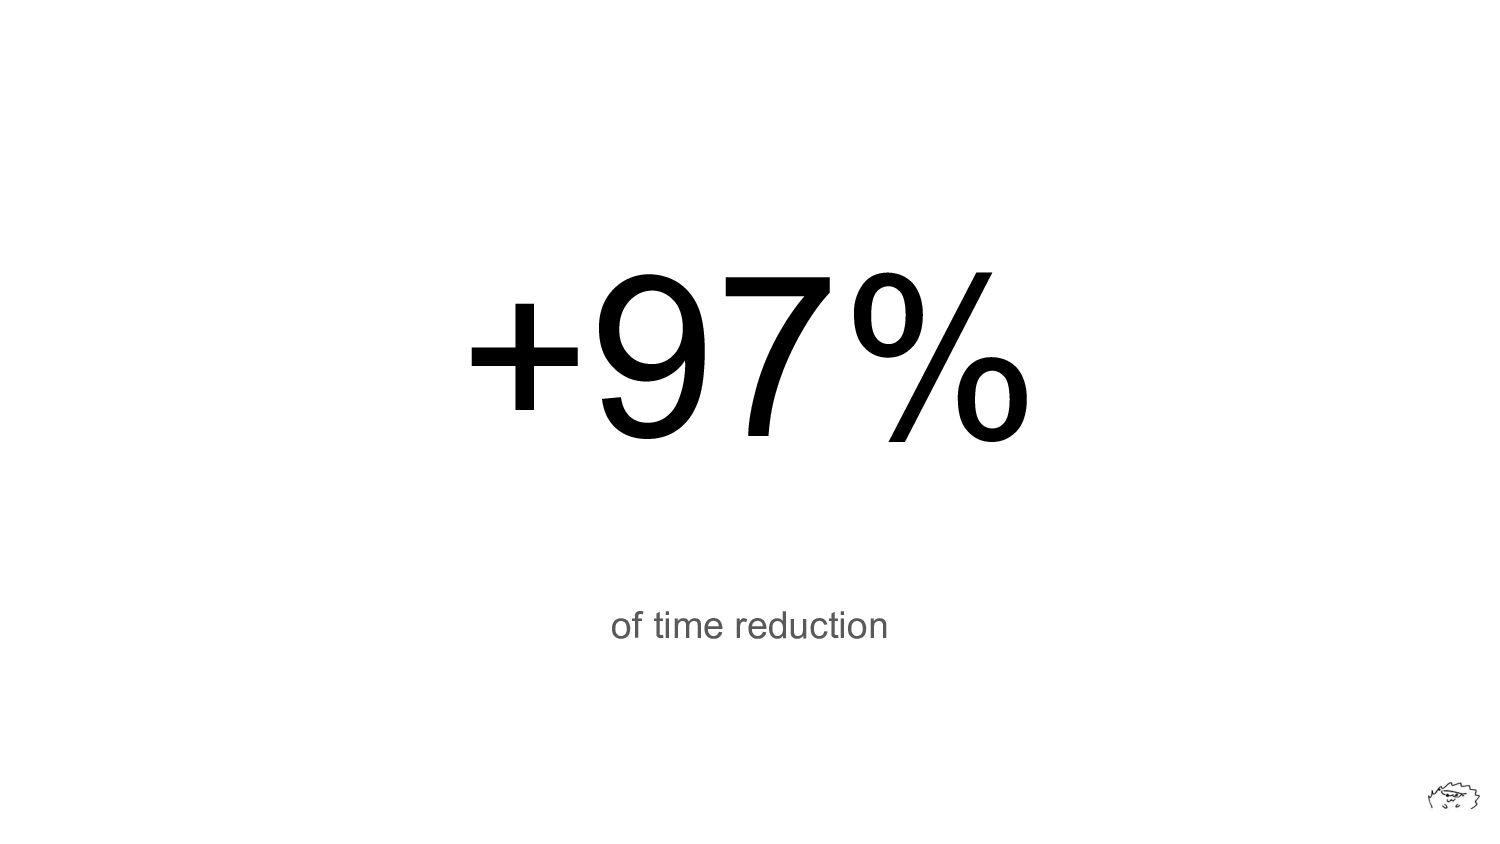
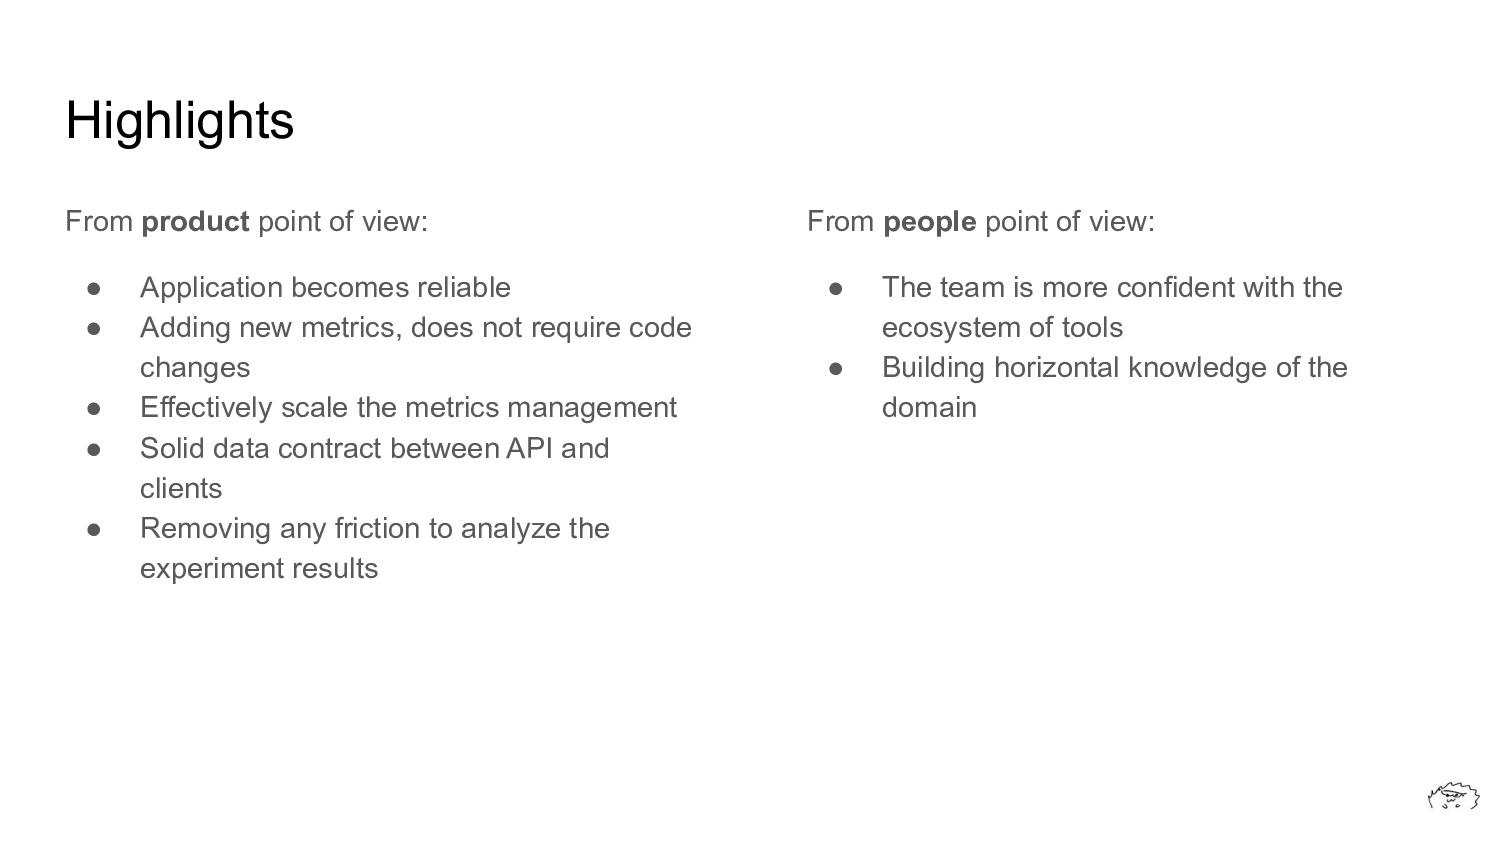
I am presenting a successful showcase that has caused more than 97% timing reduction due to process automation. This automation was led by me when I worked on the Experimentation team. The slides will give you a context for the talk, going through the problem, and explaining the solution, and outcomes.

Thulio Philipe

August 28, 2023
Tweet

More Decks by Thulio Philipe

Other Decks in Programming

Transcript

  1. +97% of Time Reduction to
    Onboarding New Metrics
    How?

    View Slide

  2. who.is
    www.thulioph.com
    ● Thulio
    ● Software Engineer
    ● Experimentation Team
    ● 󰎙

    View Slide

  3. Agenda
    Sorry, I have only 5 min
    🏎💨
    1. Context
    2. Problem
    3. Solution
    4. Outcomes

    View Slide

  4. Context

    View Slide

  5. a.k.a Experimental Kitchen
    📊
    EK "Platform that allows the analysis
    of experiments and calculates
    relevant metrics to enable decision
    making."

    View Slide

  6. Experimental Kitchen

    View Slide

  7. Experimental Kitchen

    View Slide

  8. Metrics Data

    View Slide

  9. All phases when adding a new
    metric
    🚥
    Data phases 1. Insertion
    2. Processing
    3. Visualization

    View Slide

  10. Insertion

    View Slide

  11. Processing

    View Slide

  12. Visualization

    View Slide

  13. Problem

    View Slide

  14. Problem

    View Slide

  15. Problem

    View Slide

  16. Problem

    View Slide

  17. Problem

    View Slide

  18. Problem

    View Slide

  19. Problem

    View Slide

  20. Problem

    View Slide

  21. Problem

    View Slide

  22. Problem

    View Slide

  23. Solution

    View Slide

  24. View Slide

  25. Data
    Insertion
    Automation 1/3
    🤖

    View Slide

  26. Data Insertion

    View Slide

  27. Data
    Processing
    Automation 2/3
    🤖

    View Slide

  28. Data Processing

    View Slide

  29. Data
    Visualization
    Automation 3/3
    🤖

    View Slide

  30. Data Visualization

    View Slide

  31. Data Visualization

    View Slide

  32. Outcomes

    View Slide

  33. From 40 days
    To onboarding a new metric.
    To 1

    View Slide

  34. of time reduction
    +97%

    View Slide

  35. From people point of view:
    ● The team is more confident with the
    ecosystem of tools
    ● Building horizontal knowledge of the
    domain
    From product point of view:
    ● Application becomes reliable
    ● Adding new metrics, does not require code
    changes
    ● Effectively scale the metrics management
    ● Solid data contract between API and
    clients
    ● Removing any friction to analyze the
    experiment results
    Highlights

    View Slide

  36. Links
    ● Miro board
    ● Initiative Page
    ● Jira Project
    ● PRD: Automate metric updating process
    ● API contract using JSON Schema
    ● Architecture Decision Record
    ● Metrics onboarding: end to end guideline

    View Slide

  37. Danke!

    View Slide