Upgrade to Pro — share decks privately, control downloads, hide ads and more …

Clouds as Clouds - A 200 Layers WebGL Weather Map - WhereCamp 2016

Clouds as Clouds - A 200 Layers WebGL Weather Map - WhereCamp 2016

Timmo Freudl-Gierke

November 03, 2016
Tweet

More Decks by Timmo Freudl-Gierke

Other Decks in Technology

Transcript

  1. Clouds as clouds a 200 layers WebGL weather map Timmo

    Freudl-Gierke Patrick Mast WhereCamp 2016 tinyurl.com/clouds2016
  2. MeteoGroup is one of the world’s leading providers of full-service

    B2B weather solutions, operating wherever weather impacts business decision making. Map up your business. Timmo Freudl-Gierke @timmo_8 Patrick Mast [email protected]
  3. Visualization enables Interpretation of Weather { "location": { "latitude": 52.5337,

    "longitude": 13.37788, "timeZoneName": "Europe/Berlin" }, "relevantStation": { "latitude": 23.43, "longitude": -56.23, "heightInMeters": -12.43, "id": 4711, "wmoId": 1231, "sourceType": "DWD", "name": "Berlin Tegel" }, "observedAt": "2015-08-25T13:00:00+02:00", "airTemperature": { "value": 29.3, "unit": "DEGREE_CELSIUS" }, "airPressureInHpa": 1012.9, "windSpeed": { "value": 7.4, "unit": "METER_PER_SECOND", "timeIntervalInMinutes": -60 }, "windGust": { "value": 21.6, "unit": "METER_PER_SECOND", "timeIntervalInMinutes": -60 }, "windDirectionInDegree": 274, "dewPointTemperature": { "value": 15.8, "unit": "DEGREE_CELSIUS" }, "precipitation": { "value": 0.2, "unit": "MILLIMETER",
  4. MeteoGroup Requirements • Fast & Versatile • Central, reusable map

    solution • Support for multiple user groups (personas) ◦ Meteorologists (experts) ◦ Semi-educated B2B users • Highly configurable per host application ◦ Base map visualization (colouring, level of detail, ...) ◦ Weather layer visualization ◦ Timeslider complexity (collapsed & expanded) ◦ Layer selector (5..150 weather layers) • Clouds as clouds
  5. How to best transfer weather (model) data? - World Wide

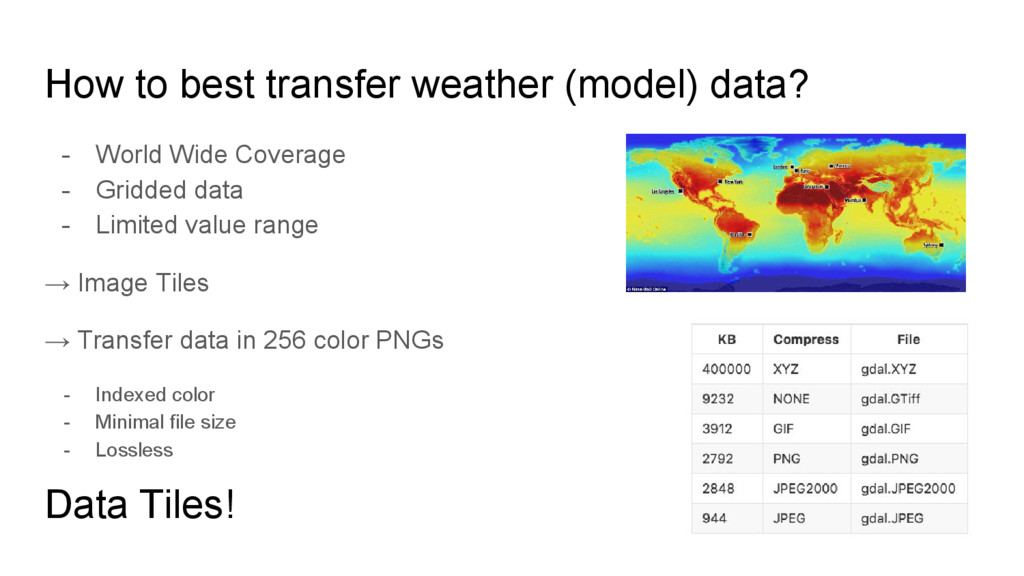
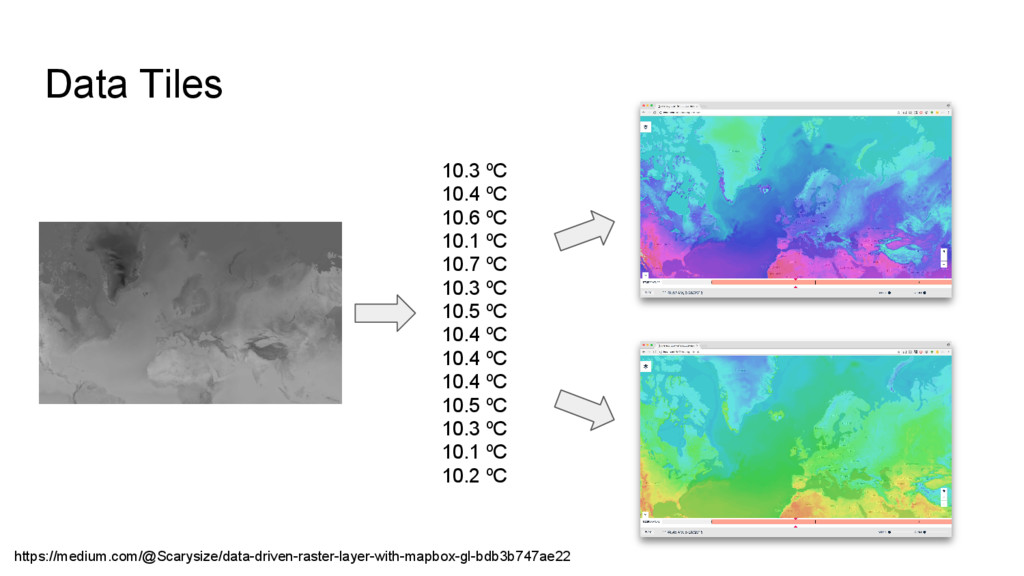
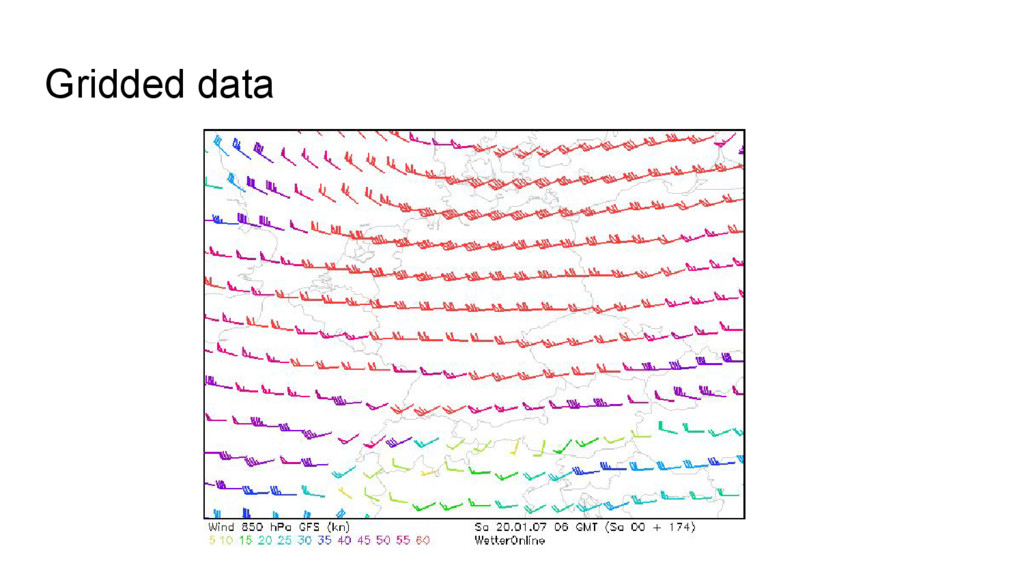
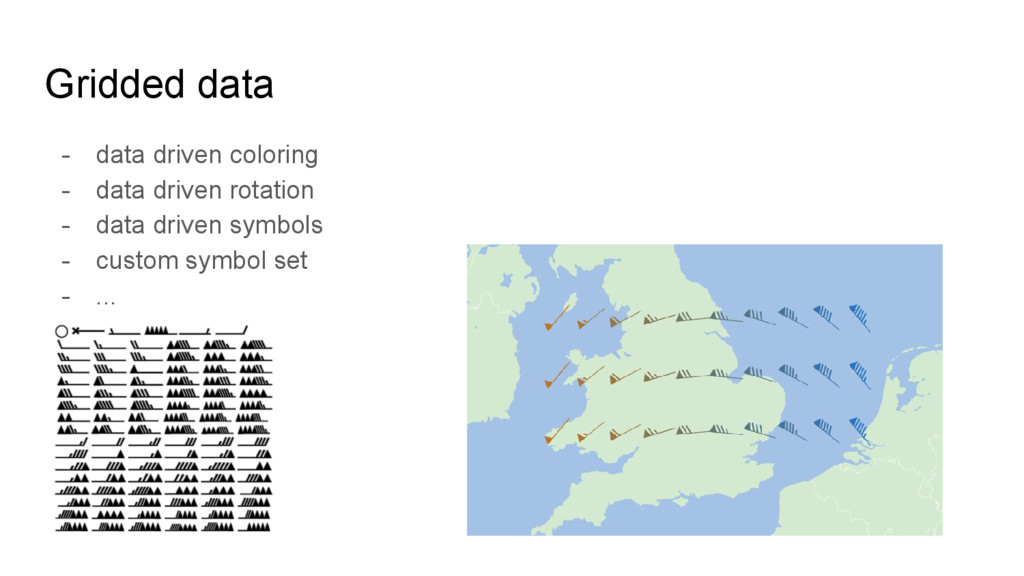
    Coverage - Gridded data - Limited value range → Image Tiles → Transfer data in 256 color PNGs - Indexed color - Minimal file size - Lossless Data Tiles!
  6. Data Tiles https://medium.com/@Scarysize/data-driven-raster-layer-with-mapbox-gl-bdb3b747ae22 10.3 ºC 10.4 ºC 10.6 ºC 10.1

    ºC 10.7 ºC 10.3 ºC 10.5 ºC 10.4 ºC 10.4 ºC 10.4 ºC 10.5 ºC 10.3 ºC 10.1 ºC 10.2 ºC
  7. “Mapbox GL JS is a JavaScript library that uses WebGL

    to render interactive maps from vector tiles and Mapbox styles.”
  8. Gridded data - data driven coloring - data driven rotation

    - data driven symbols - custom symbol set - ...
  9. Temporal Point Data - up to 50.000 stations world wide

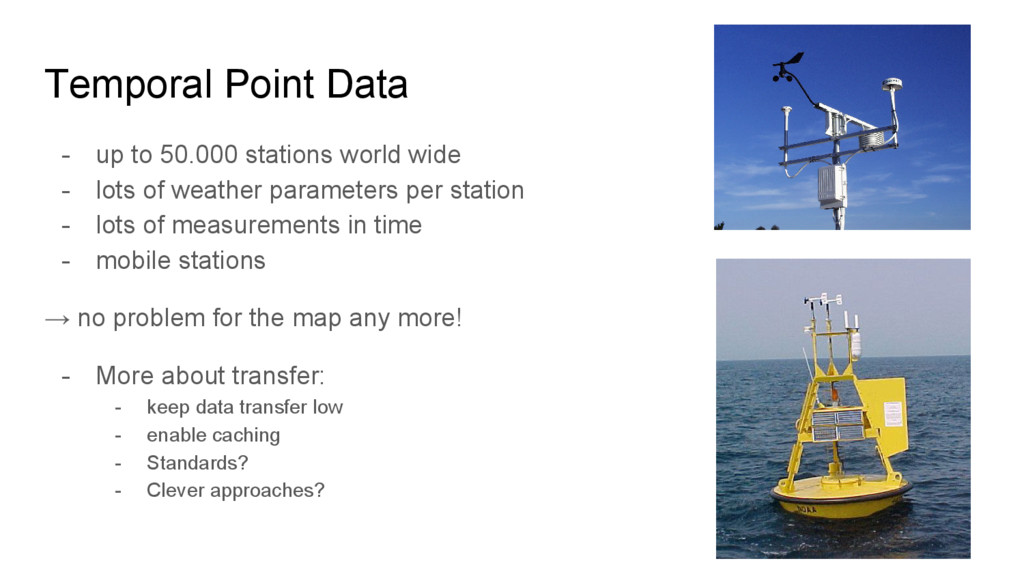
    - lots of weather parameters per station - lots of measurements in time - mobile stations → no problem for the map any more! - More about transfer: - keep data transfer low - enable caching - Standards? - Clever approaches?
  10. Future - Isochrones - Lightnings - 200+ layers - Clouds

    as clouds – making them fluffy! → more WebGL wizardry
  11. JSON Time Series (JTS) or proprietary GeoJson => No (JSON)

    standard yet to express spatial changes over time Spatial Time Weather Parameter
  12. Clouds as clouds a 200 layers WebGL weather map Timmo

    Freudl-Gierke Patrick Mast WhereCamp 2016 tinyurl.com/clouds2016