Upgrade to Pro — share decks privately, control downloads, hide ads and more …

slides_lecture1.pdf

tkschmidt
September 29, 2012
29

 slides_lecture1.pdf

tkschmidt

September 29, 2012
Tweet

Transcript

  1. What is S? S is a language that was developed

    by John Chambers and others at Bell Labs. S was initiated in 1976 as an internal statistical analysis environment—originally implemented as Fortran libraries. Early versions of the language did not contain functions for statistical modeling. In 1988 the system was rewritten in C and began to resemble the system that we have today (this was Version 3 of the language). The book Statistical Models in S by Chambers and Hastie (the white book) documents the statistical analysis functionality. Version 4 of the S language was released in 1998 and is the version we use today. The book Programming with Data by John Chambers (the green book) documents this version of the language. 4 / 16
  2. Historical Notes In 1993 Bell Labs gave StatSci (now Insightful

    Corp.) an exclusive license to develop and sell the S language. In 2004 Insightful purchased the S language from Lucent for $2 million and is the current owner. In 2006, Alcatel purchased Lucent Technologies and is now called Alcatel-Lucent. Insightful sells its implementation of the S language under the product name S-PLUS and has built a number of fancy features (GUIs, mostly) on top of it—hence the “PLUS”. In 2008 Insightful is acquired by TIBCO for $25 million The fundamentals of the S language itself has not changed dramatically since 1998. In 1998, S won the Association for Computing Machinery’s Software System Award. 5 / 16
  3. S Philosophy In “Stages in the Evolution of S”, John

    Chambers writes: “[W]e wanted users to be able to begin in an interactive environment, where they did not consciously think of themselves as programming. Then as their needs became clearer and their sophistication increased, they should be able to slide gradually into programming, when the language and system aspects would become more important.” http://www.stat.bell-labs.com/S/history.html 6 / 16
  4. Back to R 1991: Created in New Zealand by Ross

    Ihaka and Robert Gentleman. Their experience developing R is documented in a 1996 JCGS paper. 1993: First announcement of R to the public. 1995: Martin M¨ achler convinces Ross and Robert to use the GNU General Public License to make R free software. 1996: A public mailing list is created (R-help and R-devel) 1997: The R Core Group is formed (containing some people associated with S-PLUS). The core group controls the source code for R. 2000: R version 1.0.0 is released. 2012: R version 2.15.1 is released on June 22, 2012. 7 / 16
  5. Features of R Syntax is very similar to S, making

    it easy for S-PLUS users to switch over. Semantics are superficially similar to S, but in reality are quite different (more on that later). Runs on almost any standard computing platform/OS (even on the PlayStation 3) Frequent releases (annual + bugfix releases); active development. 8 / 16
  6. Features of R (cont’d) Quite lean, as far as software

    goes; functionality is divided into modular packages Graphics capabilities very sophisticated and better than most stat packages. Useful for interactive work, but contains a powerful programming language for developing new tools (user −→ programmer) Very active and vibrant user community; R-help and R-devel mailing lists and Stack Overflow 9 / 16
  7. Features of R (cont’d) It’s free! (Both in the sense

    of beer and in the sense of speech.) 10 / 16
  8. Free Software With free software, you are granted The freedom

    to run the program, for any purpose (freedom 0). The freedom to study how the program works, and adapt it to your needs (freedom 1). Access to the source code is a precondition for this. The freedom to redistribute copies so you can help your neighbor (freedom 2). The freedom to improve the program, and release your improvements to the public, so that the whole community benefits (freedom 3). Access to the source code is a precondition for this. http://www.fsf.org 11 / 16
  9. Drawbacks of R Essentially based on 40 year old technology.

    Little built in support for dynamic or 3-D graphics (but things have improved greatly since the “old days”). Functionality is based on consumer demand and user contributions. If no one feels like implementing your favorite method, then it’s your job! (Or you need to pay someone to do it) Objects must generally be stored in physical memory; but there have been advancements to deal with this too Not ideal for all possible situations (but this is a drawback of all software packages). 12 / 16
  10. Design of the R System The R system is divided

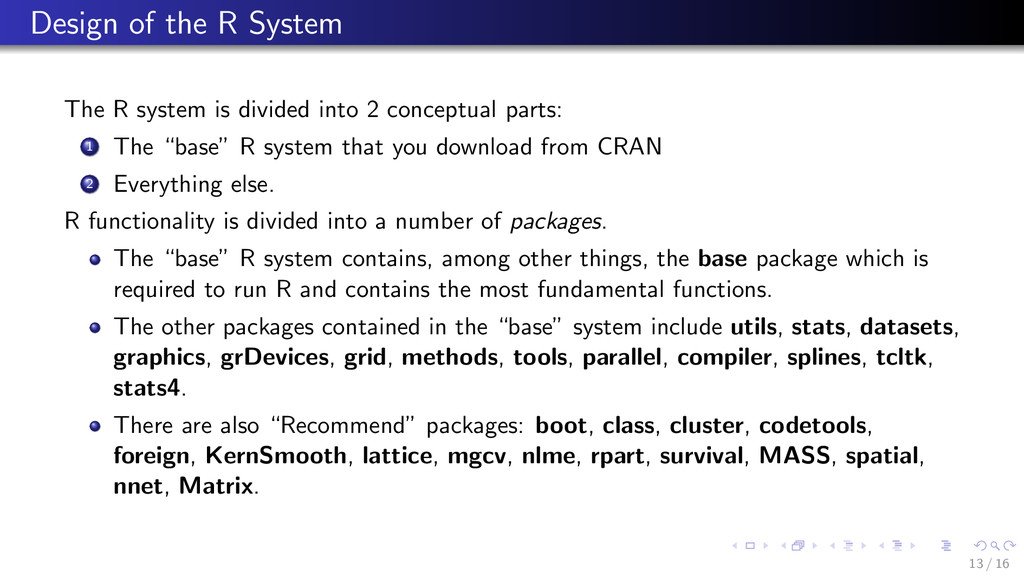
    into 2 conceptual parts: 1 The “base” R system that you download from CRAN 2 Everything else. R functionality is divided into a number of packages. The “base” R system contains, among other things, the base package which is required to run R and contains the most fundamental functions. The other packages contained in the “base” system include utils, stats, datasets, graphics, grDevices, grid, methods, tools, parallel, compiler, splines, tcltk, stats4. There are also “Recommend” packages: boot, class, cluster, codetools, foreign, KernSmooth, lattice, mgcv, nlme, rpart, survival, MASS, spatial, nnet, Matrix. 13 / 16
  11. Design of the R System And there are many other

    packages available: There are about 4000 packages on CRAN that have been developed by users and programmers around the world. There are also many packages associated with the Bioconductor project (http://bioconductor.org). People often make packages available on their personal websites; there is no reliable way to keep track of how many packages are available in this fashion. 14 / 16
  12. Some R Resources Available from CRAN (http://cran.r-project.org) An Introduction to

    R Writing R Extensions R Data Import/Export R Installation and Administration (mostly for building R from sources) R Internals (not for the faint of heart) 15 / 16
  13. Some Useful Books on S/R Standard texts Chambers (2008). Software

    for Data Analysis, Springer. (your textbook) Chambers (1998). Programming with Data, Springer. Venables & Ripley (2002). Modern Applied Statistics with S, Springer. Venables & Ripley (2000). S Programming, Springer. Pinheiro & Bates (2000). Mixed-Effects Models in S and S-PLUS, Springer. Murrell (2005). R Graphics, Chapman & Hall/CRC Press. Other resources Springer has a series of books called Use R!. A longer list of books is at http://www.r-project.org/doc/bib/R-books.html 16 / 16