Upgrade to Pro — share decks privately, control downloads, hide ads and more …

Mapping time

tokumine
October 30, 2012

Mapping time

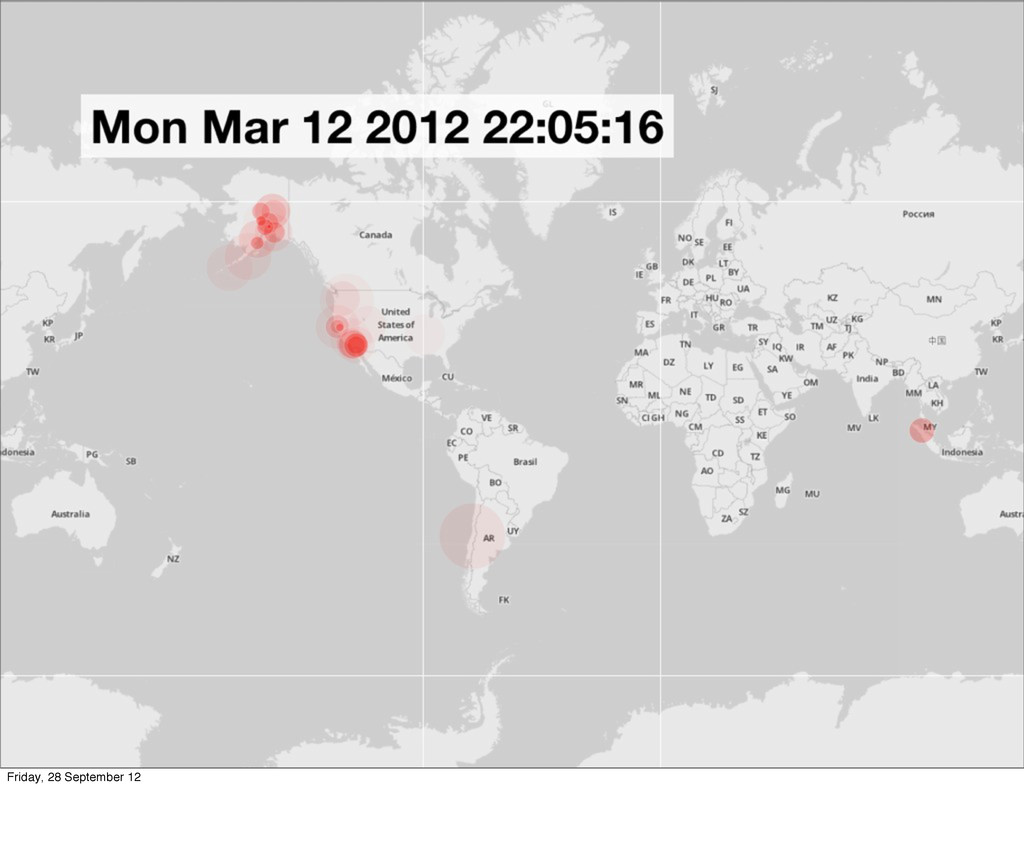
Using CartoDB to enable interactive rendering of big temporal data. Describes the technique used in our visualization of OldWeather datapoints: http://cartodb.github.com/oldweather_wwi/

tokumine

October 30, 2012
Tweet

More Decks by tokumine

Other Decks in Technology

Transcript

  1. Mapping time using CartoDB to enable bigdata(™) on the client

    Andrew Hill & Simon Tokumine Friday, 28 September 12
  2. Working to improve our Working to improve our world, one

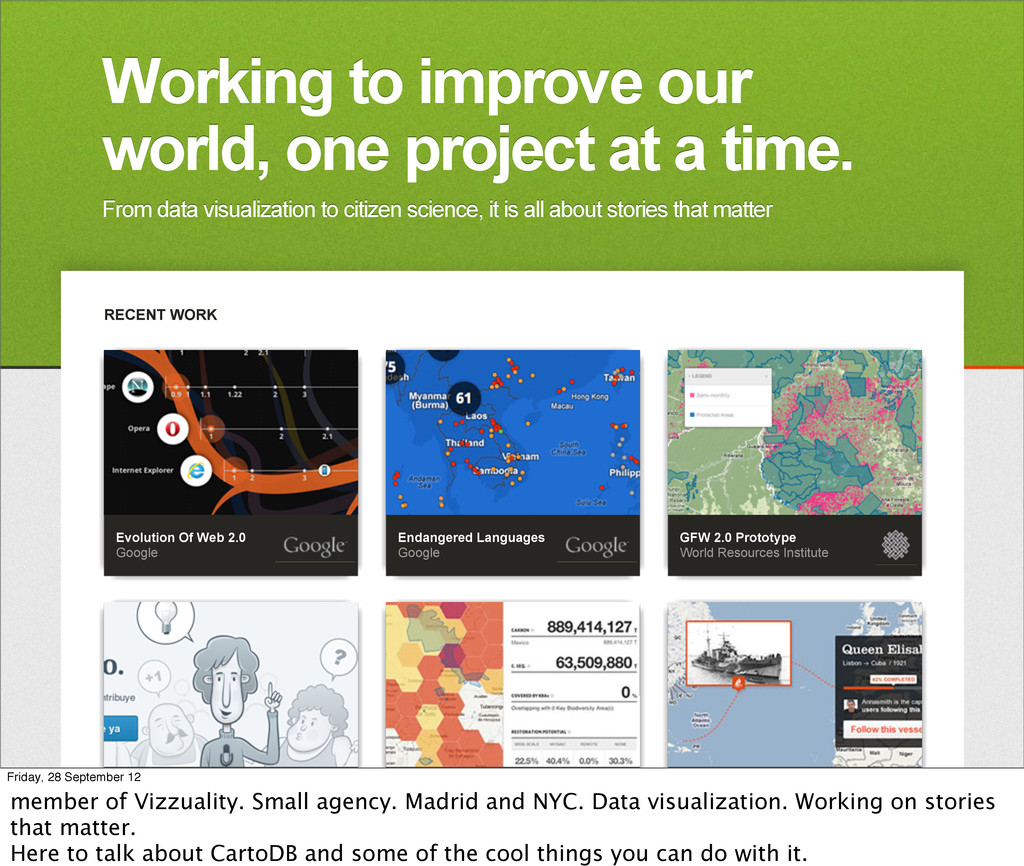
    project at a time. world, one project at a time. From data visualization to citizen science, it is all about stories that matter From data visualization to citizen science, it is all about stories that matter RECENT WORK Evolution Of Web 2.0 Google Endangered Languages Google GFW 2.0 Prototype World Resources Institute Irekia 2.0 Basque Government Carbon Calculator UNEP-WCMC OldWeather Zooniverse Friday, 28 September 12 member of Vizzuality. Small agency. Madrid and NYC. Data visualization. Working on stories that matter. Here to talk about CartoDB and some of the cool things you can do with it.
  3. Same old things Server config Geospatial Database (backups, optimal config)

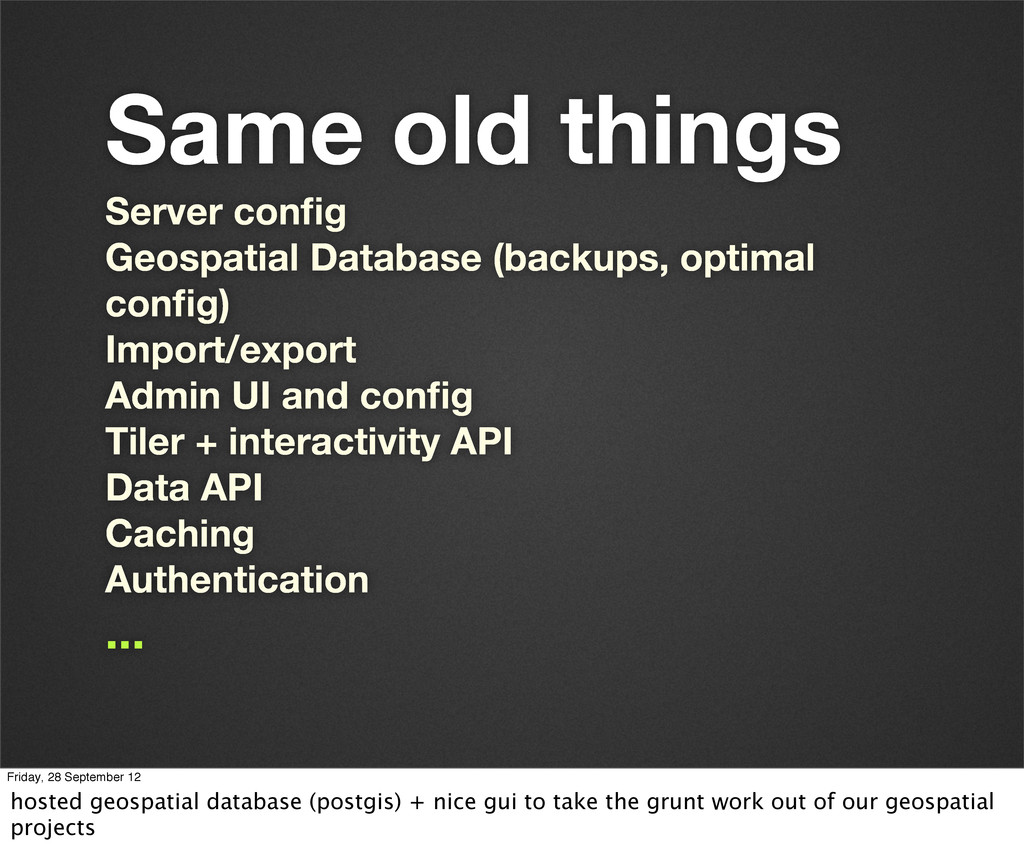
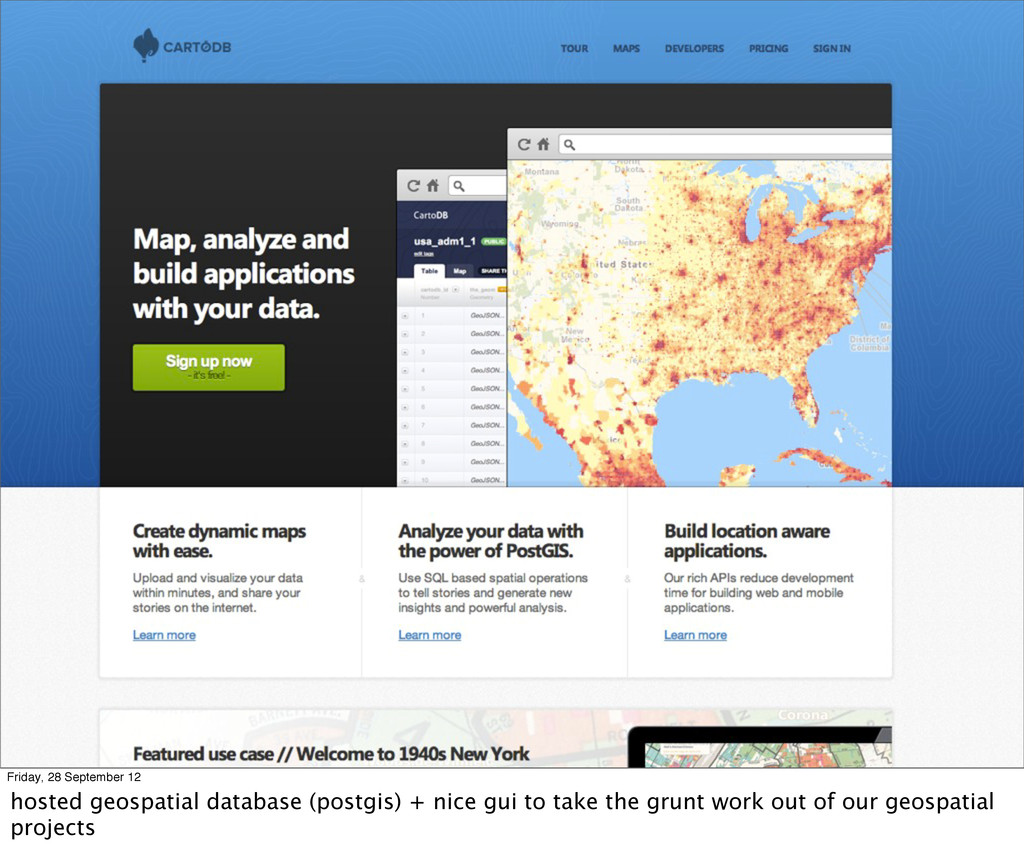
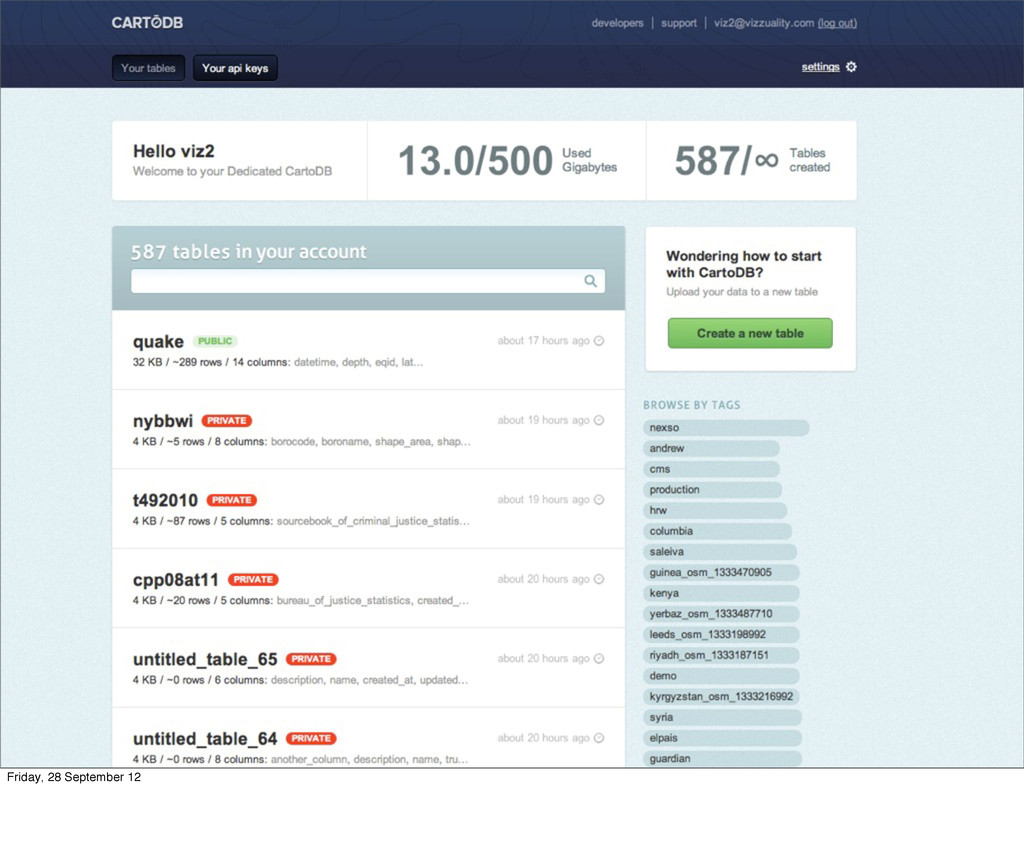
    Import/export Admin UI and config Tiler + interactivity API Data API Caching Authentication ... Friday, 28 September 12 hosted geospatial database (postgis) + nice gui to take the grunt work out of our geospatial projects
  4. Friday, 28 September 12 hosted geospatial database (postgis) + nice

    gui to take the grunt work out of our geospatial projects
  5. SQL API HTTP data API Full postgis 2.0 R/W via

    API keys Public access Read only cache layer CDN'able Friday, 28 September 12
  6. _I want to see ‘X’ over time using the SQL

    API with big data Friday, 28 September 12
  7. _Traditional approach Download the data to the client and render

    it. http://goo.gl/c6KxN - Recent earthquakes http://goo.gl/B7NK6 - Syria casualties Friday, 28 September 12
  8. “The main limiting factor we've noticed with webgl is the

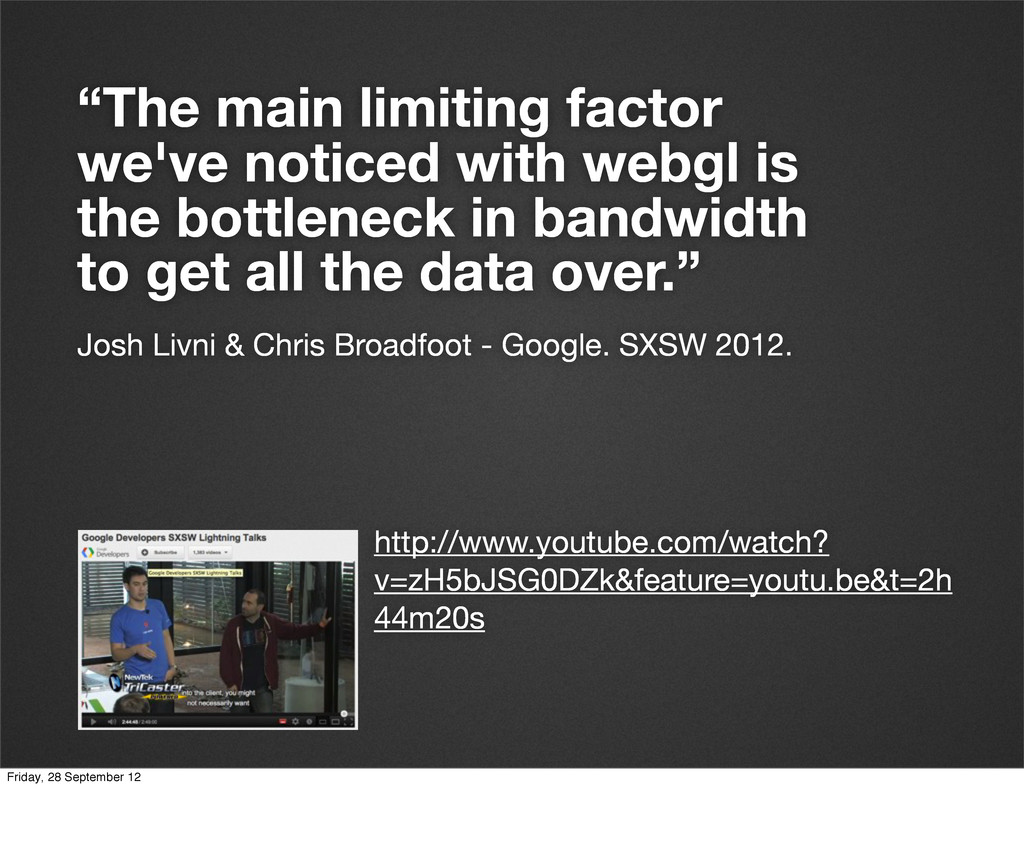
    bottleneck in bandwidth to get all the data over.” Josh Livni & Chris Broadfoot - Google. SXSW 2012. http://www.youtube.com/watch? v=zH5bJSG0DZk&feature=youtu.be&t=2h 44m20s Friday, 28 September 12
  9. “Even though you can bring big data into the client

    you might not want to take all of it. There's definitely a case for taking slices of it” http://www.youtube.com/watch? v=zH5bJSG0DZk&feature=youtu.be&t=2h 44m20s Josh Livni & Chris Broadfoot - Google. SXSW 2012. Friday, 28 September 12
  10. _Acceptable granularity? redefining the problem Friday, 28 September 12 Maybe

    Josh and Chris were talking about windowing/streaming, but maybe they were talking about datacubes.
  11. Datacubes •BI/Finance analysis •multidimensional •summary data •binned variables Friday, 28

    September 12 Aka. Hypercubes/OLAP cubes (Make city people sound like they're lawnmowerman)
  12. Datacubes Cons •can be lossy •take time to generate Pros

    •fast access •lightweight •cachable Friday, 28 September 12 Aka. Hypercubes/OLAP cubes (Make city people sound like they're lawnmowerman)
  13. _Can we cube the data? rather than tile it? Friday,

    28 September 12 Real world usage. Can we replace tiles with these?
  14. WITH  hgrid            AS  (SELECT  Cdb_rectanglegrid(Cdb_xyz_extent(8,

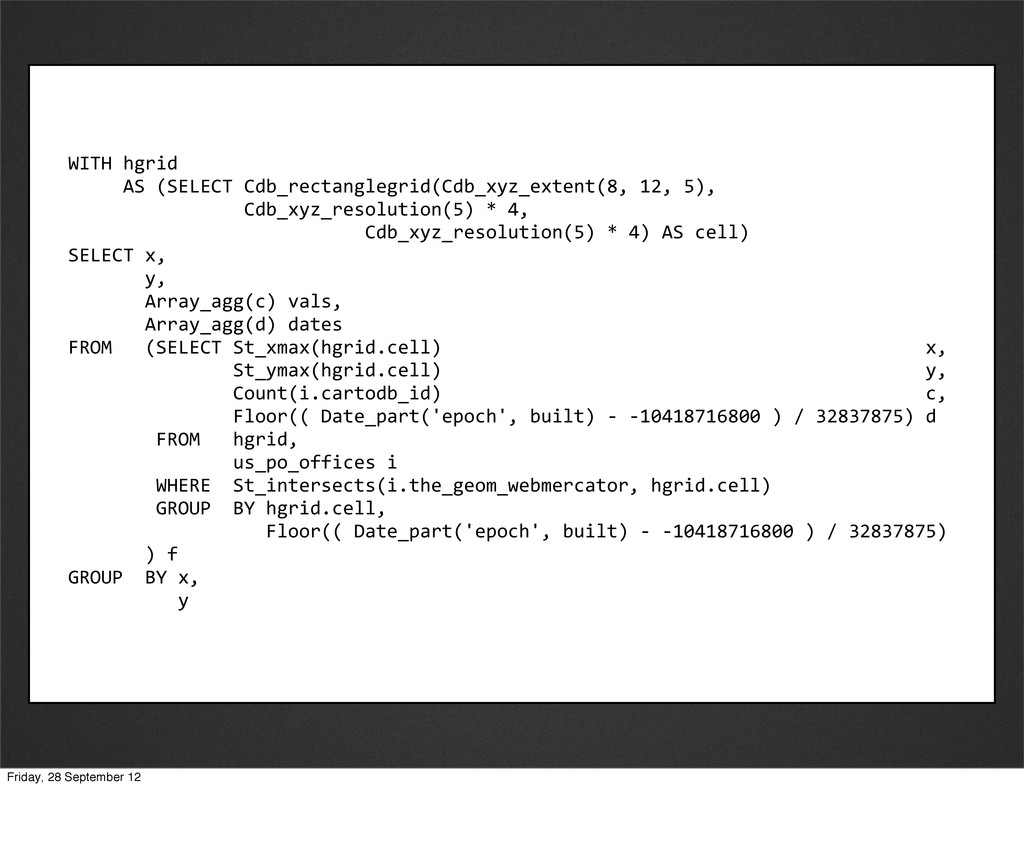
     12,  5),                                  Cdb_xyz_resolution(5)  *  4,                                                        Cdb_xyz_resolution(5)  *  4)  AS  cell)   SELECT  x,                y,                Array_agg(c)  vals,                Array_agg(d)  dates   FROM      (SELECT  St_xmax(hgrid.cell)                                                                                        x,                                St_ymax(hgrid.cell)                                                                                        y,                                Count(i.cartodb_id)                                                                                        c,                                Floor((  Date_part('epoch',  built)  -­‐  -­‐10418716800  )  /  32837875)  d                  FROM      hgrid,                                us_po_offices  i                  WHERE    St_intersects(i.the_geom_webmercator,  hgrid.cell)                  GROUP    BY  hgrid.cell,                                      Floor((  Date_part('epoch',  built)  -­‐  -­‐10418716800  )  /  32837875)                )  f   GROUP    BY  x,                      y Friday, 28 September 12
  15. {    rows:  [    {        x:

     0,        y:  0,        vals:  [2],        dates:  [457]    },    {        x:  1,        y:  0,        vals:  [1,1,4],        dates:  [2,3,4]        }    ] } Friday, 28 September 12
  16. 1 10 100 1000 3mb 70mb 300mb 1.5 2 1.2

    300 70 3 Raw Datacube Payload sizes Friday, 28 September 12