Upgrade to Pro — share decks privately, control downloads, hide ads and more …

Large-scale analysis of genome-wide enhancer and gene activity reveals a novel enhancer-promoter map

Tom A Hait
November 03, 2017

Large-scale analysis of genome-wide enhancer and gene activity reveals a novel enhancer-promoter map

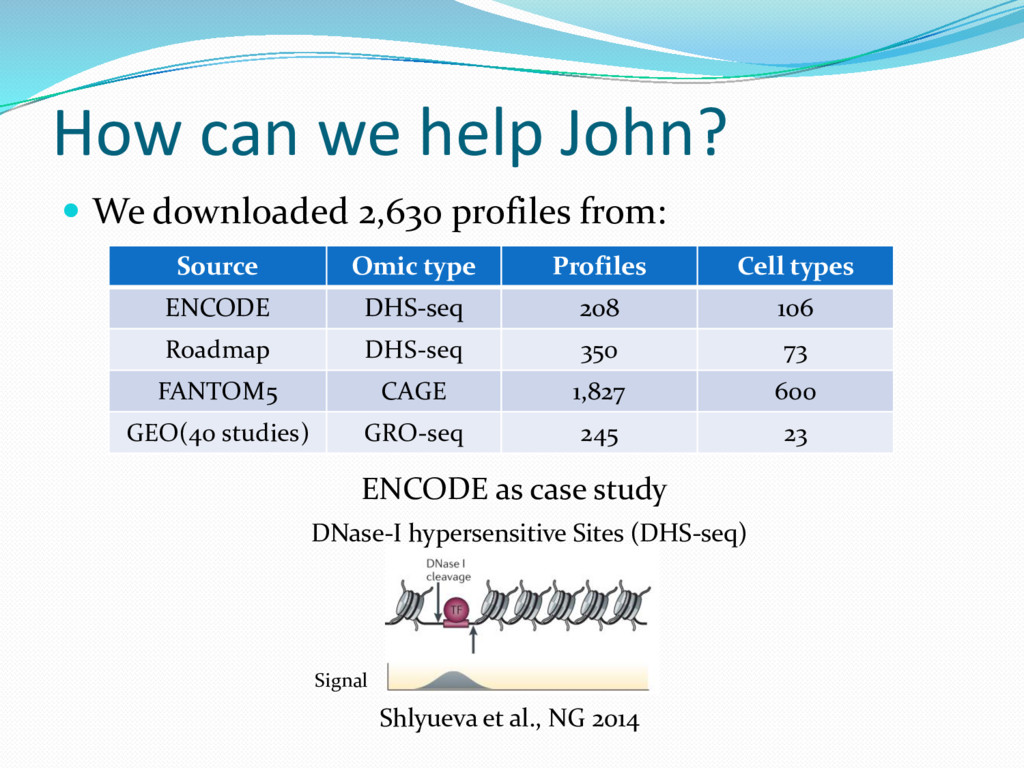
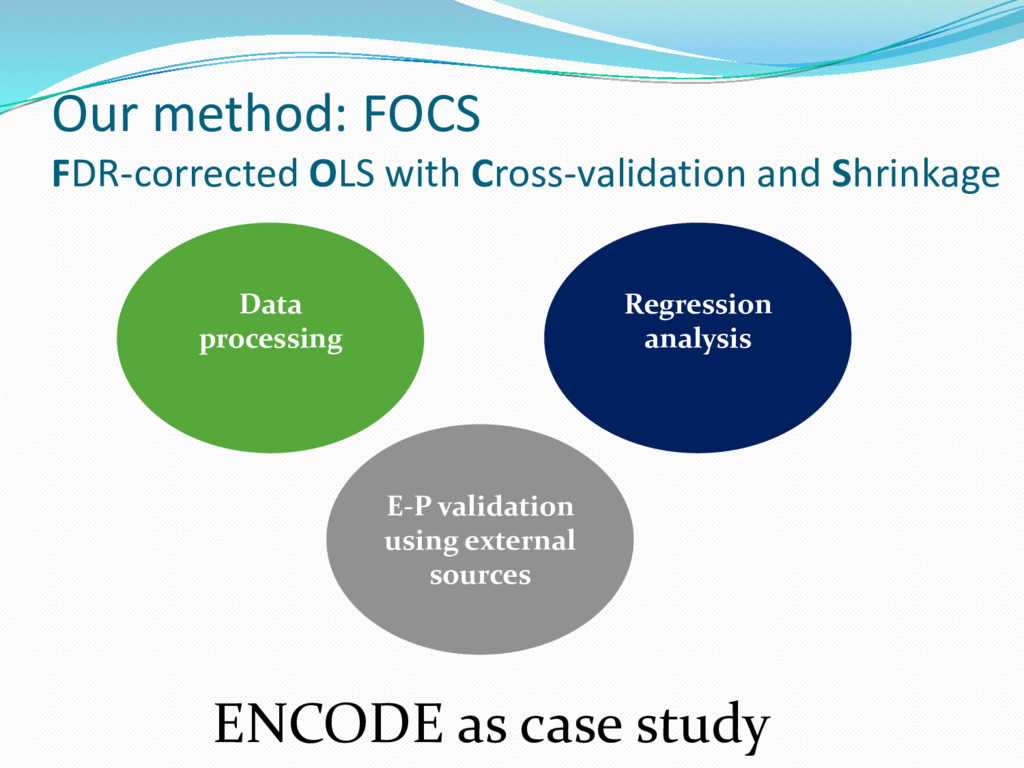
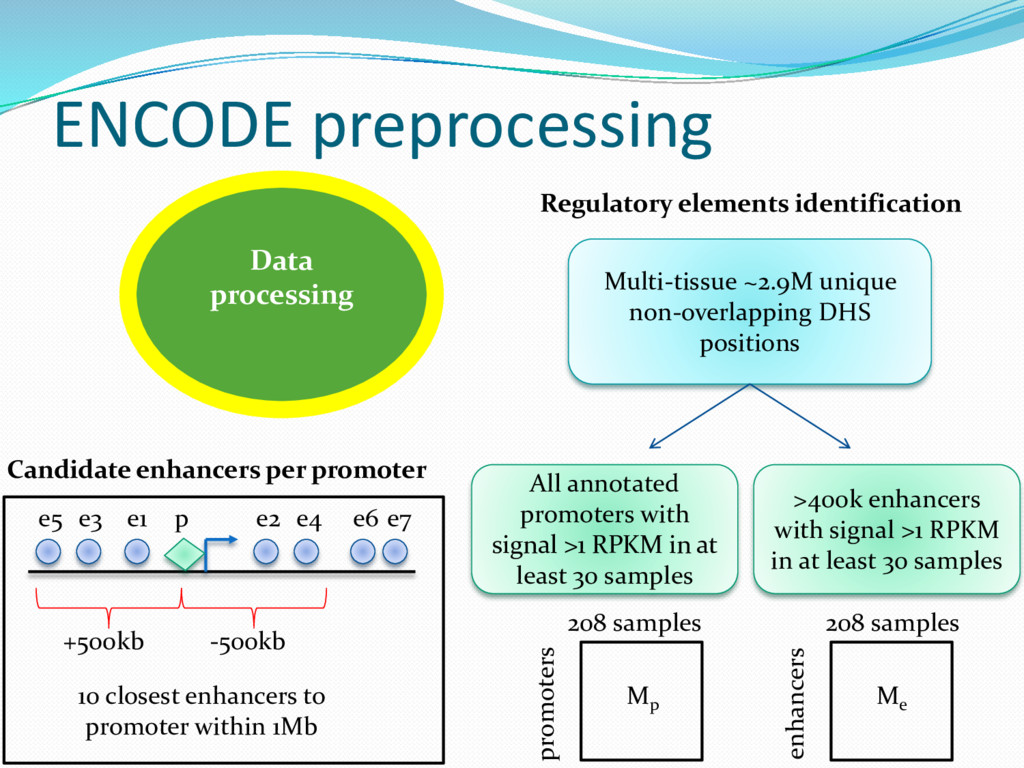
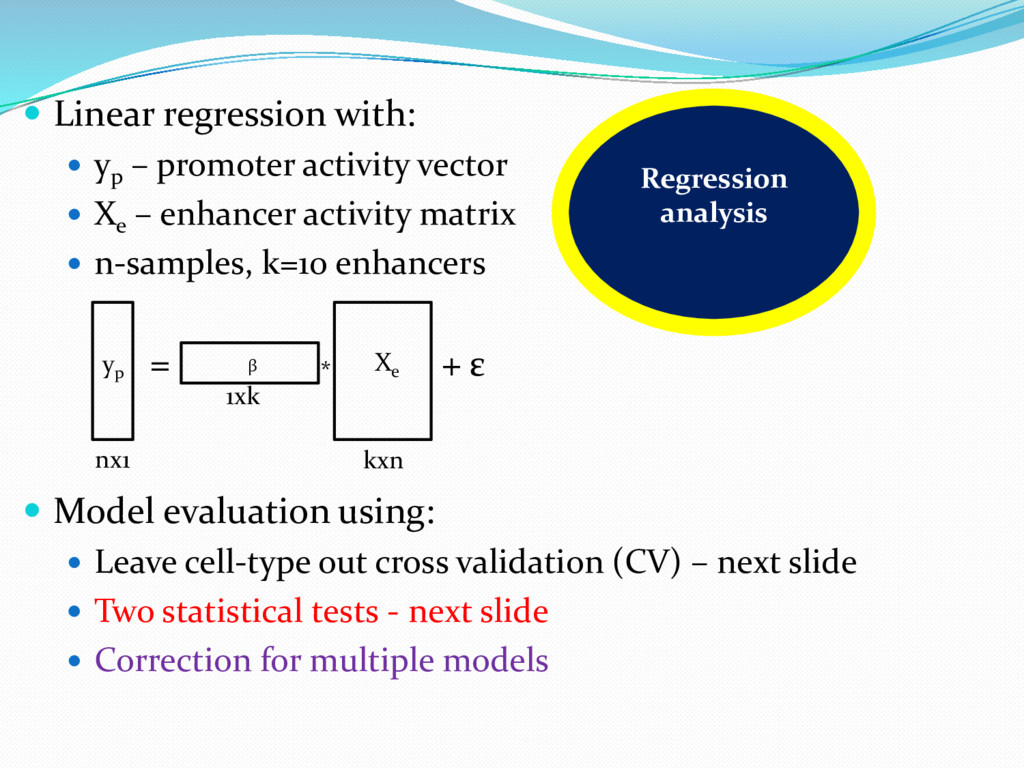
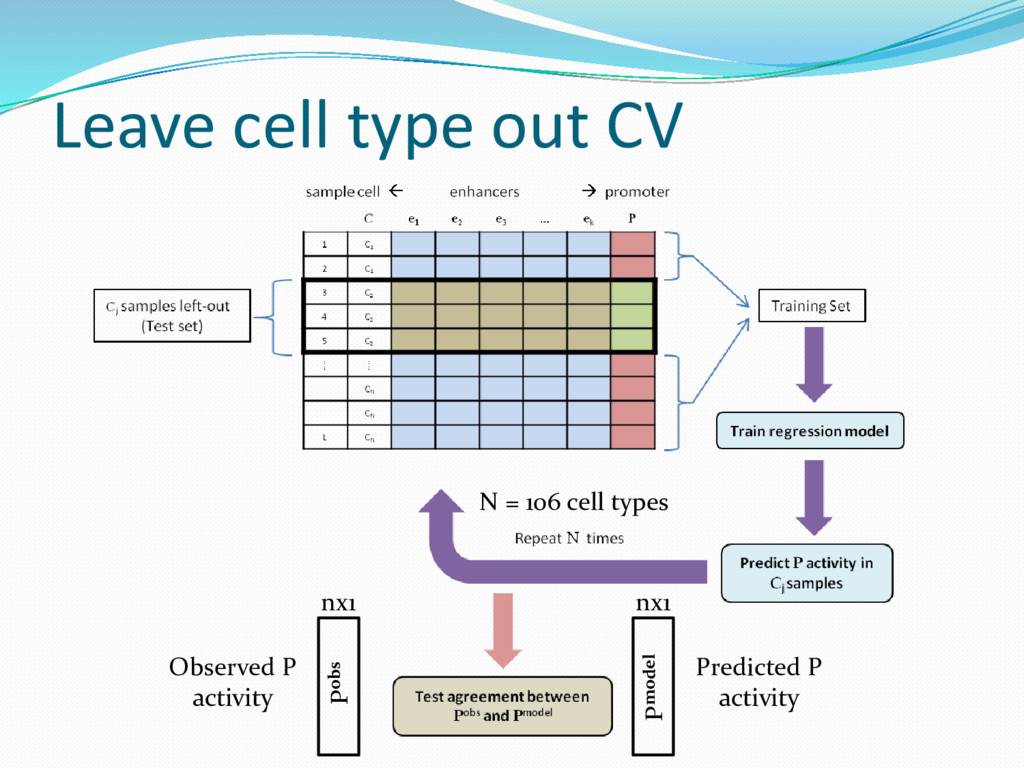
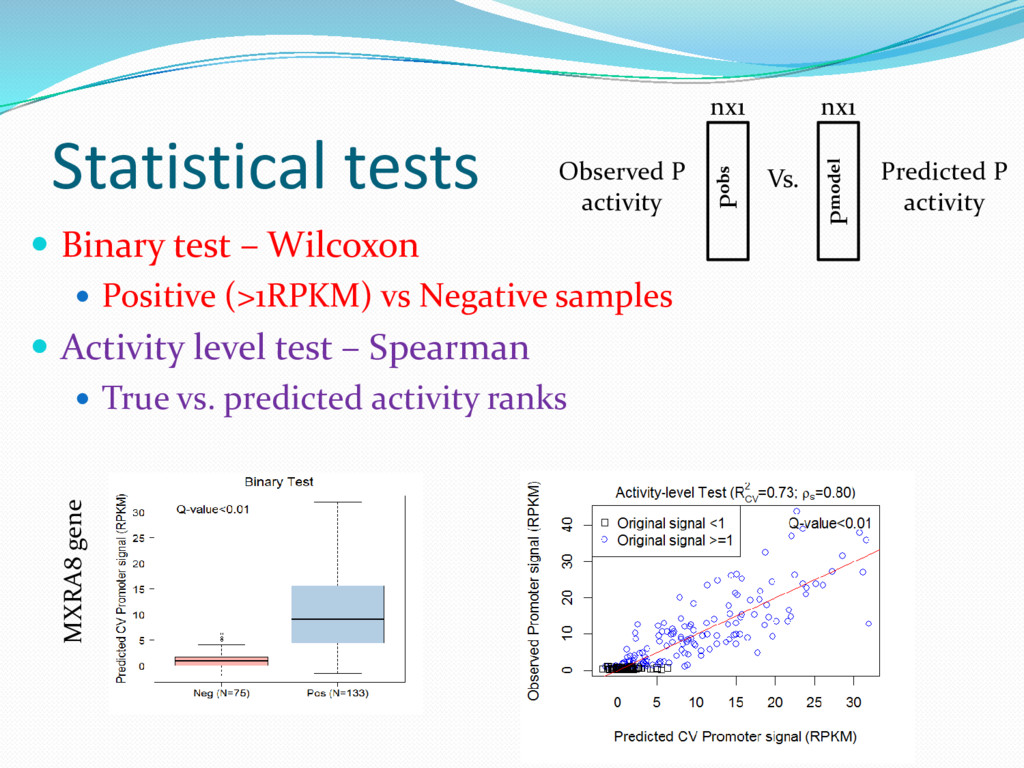
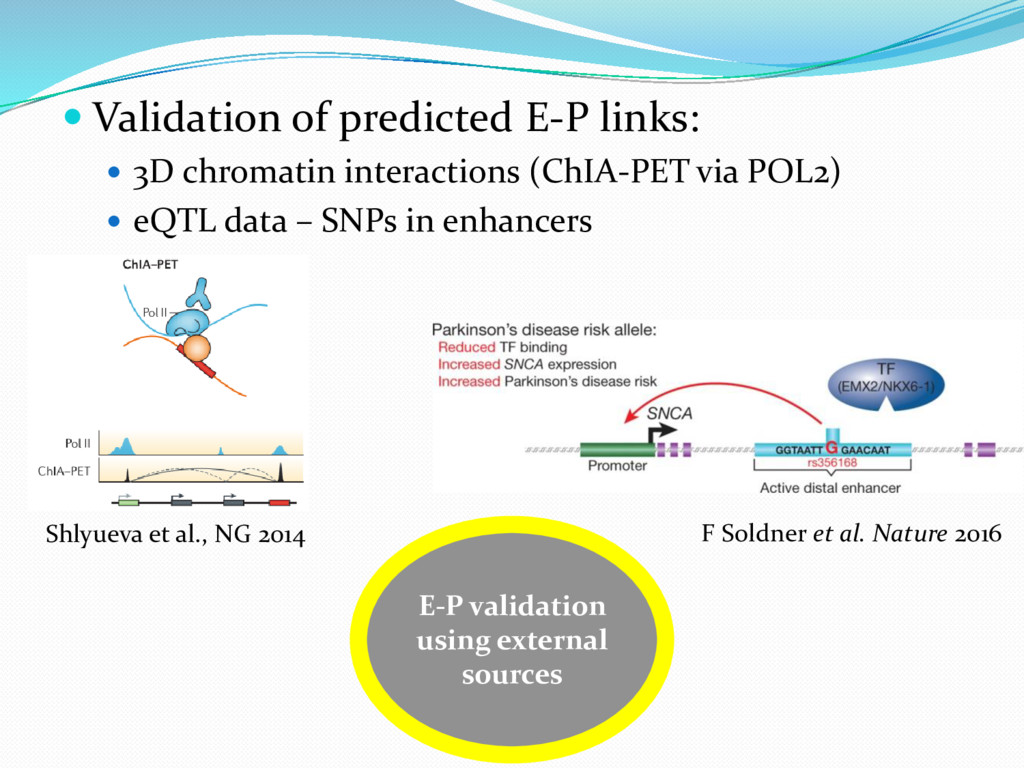
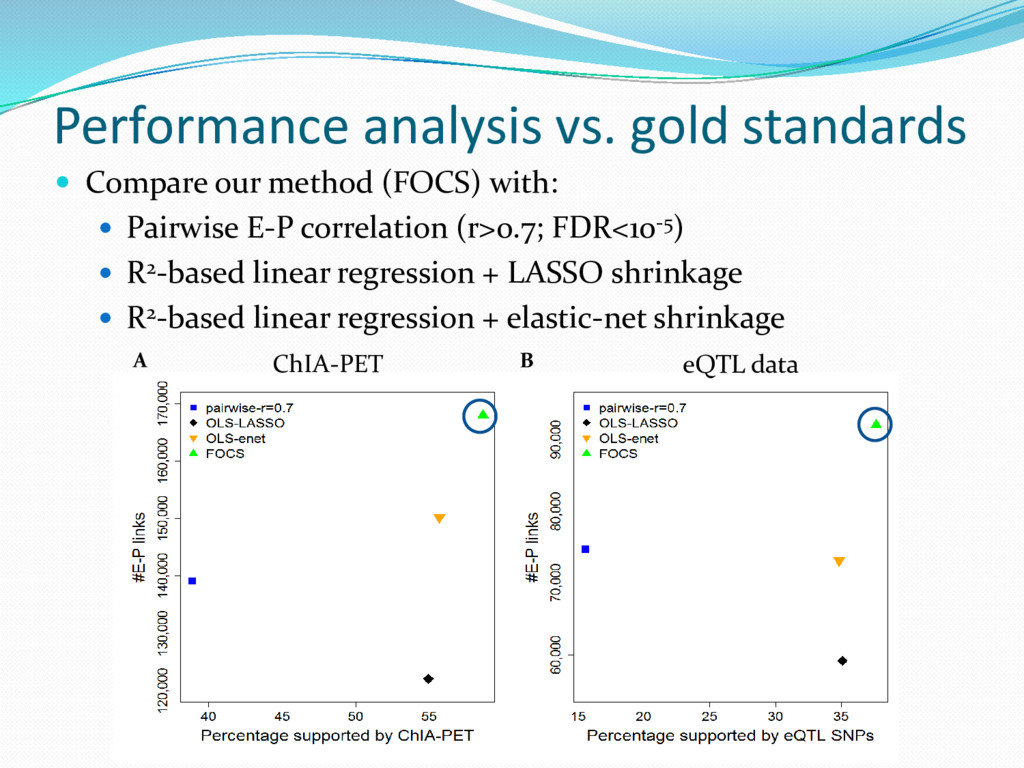
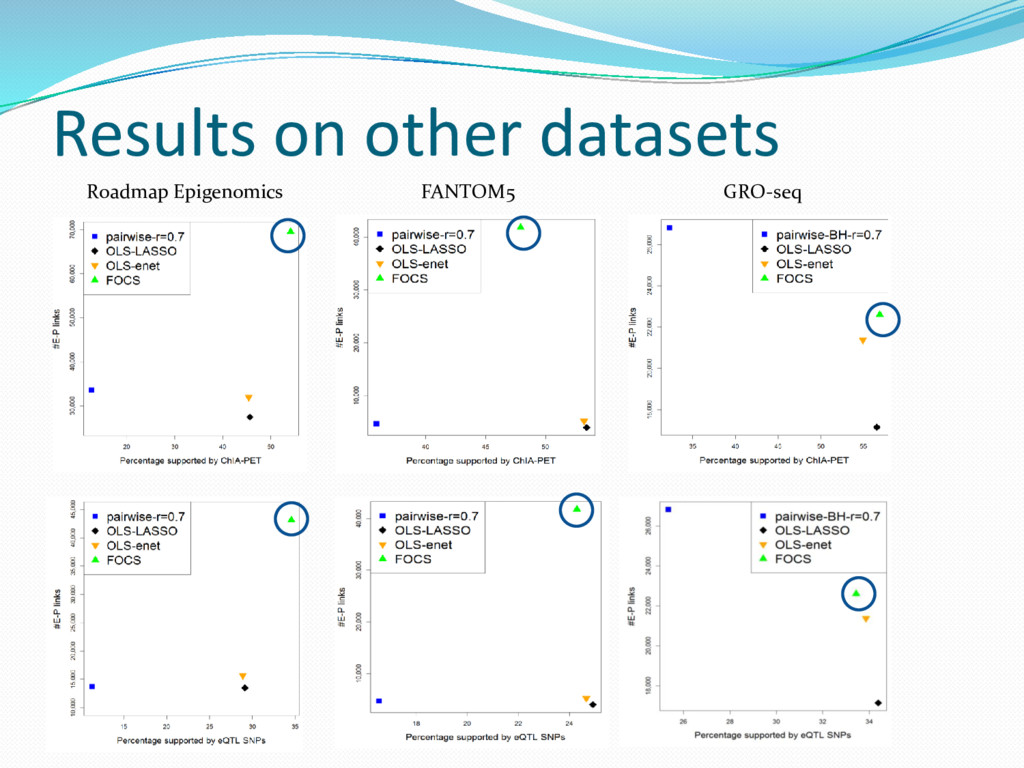
Massive efforts have documented hundreds of thousands of putative enhancers in the human genome. A pressing genomic challenge is to identify which of these enhancers are functional and map them to the genes they regulate. We developed a novel method for inferring enhancer-promoter (E-P) links based on correlated activity patterns across many samples. Our method, called FOCS, uses rigorous statistical validation tailored for zero-inflated data, identifying the most important E-P links in each gene model. We applied FOCS to the wide epigenomic and transcriptomic datasets recorded by the ENCODE, Roadmap Epigenomics and FANTOM5 projects, together covering 2,630 samples of human primary cells, tissues and cell lines. In addition, building on expression of enhancer RNAs (eRNAs) as an exquisite mark of enhancer activity and on the robust detection of eRNAs by the GRO-seq technique, we compiled a compendium of eRNA and gene expression profiles based on public GRO-seq data from 245 samples and 23 human cell types. Applying FOCS to this compendium further expanded the coverage of our inferred E-P map. Benchmarking against gold standard E-P links from ChIA-PET and eQTL data, we demonstrate that FOCS prediction of E-P links outperforms extant methods. Collectively, we inferred >300,000 cross-validated E-P links spanning ~16K known genes. Our study presents an improved method for inferring regulatory links between enhancers and promoters, and provides an extensive resource of E-P maps that could greatly assist the functional interpretation of the noncoding regulatory genome. FOCS and our predicted E-P map are publicly available at http://acgt.cs.tau.ac.il/focs.

Tom A Hait

November 03, 2017
Tweet

Other Decks in Science

Transcript

  1. Tom Aharon Hait CSHL Genome Informatics 2017 Tel-Aviv University 3.11.2017

    Available on bioRxiv: https://doi.org/10.1101/190231 Currently under review #gi2017
  2.  John studies a disease, he wants to:  Find

    new risk genes  Identify new risk genes via their enhancers  Use SNPs from GWAS data overlapping enhancers  But John knows that:  ~3M ENCODE regulatory elements  Enhancers’ target genes in most cases are still unknown  Many candidate enhancers per gene John the scientist
  3. Existing E-P mapping methods  Nearest gene - ~50% are

    FPs*  Pearson E-P pairwise correlation  Assumes linear relationship between E and P activities  Missing info from multiple enhancers  Sample-specific enhancer-promoter (E-P) maps – TargetFinder**, JEME***  Fewer E-P links  Mostly cell-lines (GM12878, K562)  May miss important E-P links to complex diseases (Alzheimer, Obesity, Parkinson)  John needs reliable global E-P maps * Andersson et al., Nature 2014 ** Whalen et al., NG 2016 *** Cao et al., NG 2017
  4. Existing E-P mapping methods  Nearest gene - ~50% are

    FPs*  Pearson pairwise correlation between E-P pair  Assumes linear relationship between E and P activities  Missing info from multiple enhancers  Sample-specific enhancer-promoter (E-P) maps – TargetFinder**, JEME***  Fewer E-P links  Mostly cell-lines (GM12878, K562)  May miss important E-P links to complex diseases (Alzheimer, Obesity, Parkinson)  John needs reliable global E-P maps * Andersson et al., Nature 2014 ** Whalen et al., NG 2016 *** Cao et al., NG 2017
  5.  We downloaded 2,630 profiles from: How can we help

    John? Source Omic type Profiles Cell types ENCODE DHS-seq 208 106 Roadmap DHS-seq 350 73 FANTOM5 CAGE 1,827 600 GEO(40 studies) GRO-seq 245 23 DNase-I hypersensitive Sites (DHS-seq) Signal Shlyueva et al., NG 2014 ENCODE as case study
  6. Our method: FOCS FDR-corrected OLS with Cross-validation and Shrinkage Data

    processing Regression analysis E-P validation using external sources ENCODE as case study
  7. ENCODE preprocessing Data processing Regulatory elements identification Multi-tissue ~2.9M unique

    non-overlapping DHS positions All annotated promoters with signal >1 RPKM in at least 30 samples >400k enhancers with signal >1 RPKM in at least 30 samples Mp promoters 208 samples Me enhancers 208 samples Candidate enhancers per promoter +500kb -500kb 10 closest enhancers to promoter within 1Mb e3 e1 e2 e4 e5 e6 e7 p
  8.  Linear regression with:  yp – promoter activity vector

     Xe – enhancer activity matrix  n-samples, k=10 enhancers  Model evaluation using:  Leave cell-type out cross validation (CV) – next slide  Two statistical tests - next slide  Correction for multiple models Regression analysis = yp β Xe * + ε kxn 1xk nx1
  9. Leave cell type out CV N = 106 cell types

    Observed P activity Predicted P activity nx1 nx1 Pobs Pmodel
  10. Statistical tests  Binary test – Wilcoxon  Positive (>1RPKM)

    vs Negative samples  Activity level test – Spearman  True vs. predicted activity ranks MXRA8 gene Observed P activity Predicted P activity nx1 nx1 Pobs Pmodel Vs.
  11.  Model shrinkage using elastic-net  LASSO + Ridge regularizations

     Most informative enhancers Regression analysis On average, 2.4 enhancers per promoter 63% of the models contain the most proximal enhancer
  12.  Validation of predicted E-P links:  3D chromatin interactions

    (ChIA-PET via POL2)  eQTL data – SNPs in enhancers E-P validation using external sources Shlyueva et al., NG 2014 F Soldner et al. Nature 2016
  13. Performance analysis vs. gold standards A B  Compare our

    method (FOCS) with:  Pairwise E-P correlation (r>0.7; FDR<10-5)  R2-based linear regression + LASSO shrinkage  R2-based linear regression + elastic-net shrinkage ChIA-PET eQTL data
  14. 2 [ ] log Signal GencodeV19 genes FOCS predicted E-P

    links Layered H3K4me1 Layered H3K4me3 Layered H3K27ac chr8: E-P with ChIA-PET support E-P without ChIA-PET support *ep: E-P with eQTL support Promoter activity 10 closest enhancers’ activities ESRP1 gene – UCSC browser
  15.  A new E-P compendium (FOCS):  2,630 profiles 

    >300,000 cross-validated E-P links  ~16k human genes and ~181k putative enhancers  New GRO-seq compendium of eRNAs and GEs  Regression analysis:  Leave cell-type out CV  Non-parametric statistical tests  Control on multiple models  Higher number of predicted E-P links!  Higher true positive rate!  Possible biological interpretations:  New risk genes via GWAS SNPs in enhancers  New TFs in enhancers but not in promoters Summary http://acgt.cs.tau.ac.il/focs/