R C Y C L E Why NAND, why now? Framing the debate around the NAND memory supercycle Part 1 — Fundamentals, market conditions & the supply-demand mechanism Why prices spiked Why supply is being constrained A price-driven profit structure A briefing that frames the outlook for NAND memory demand.
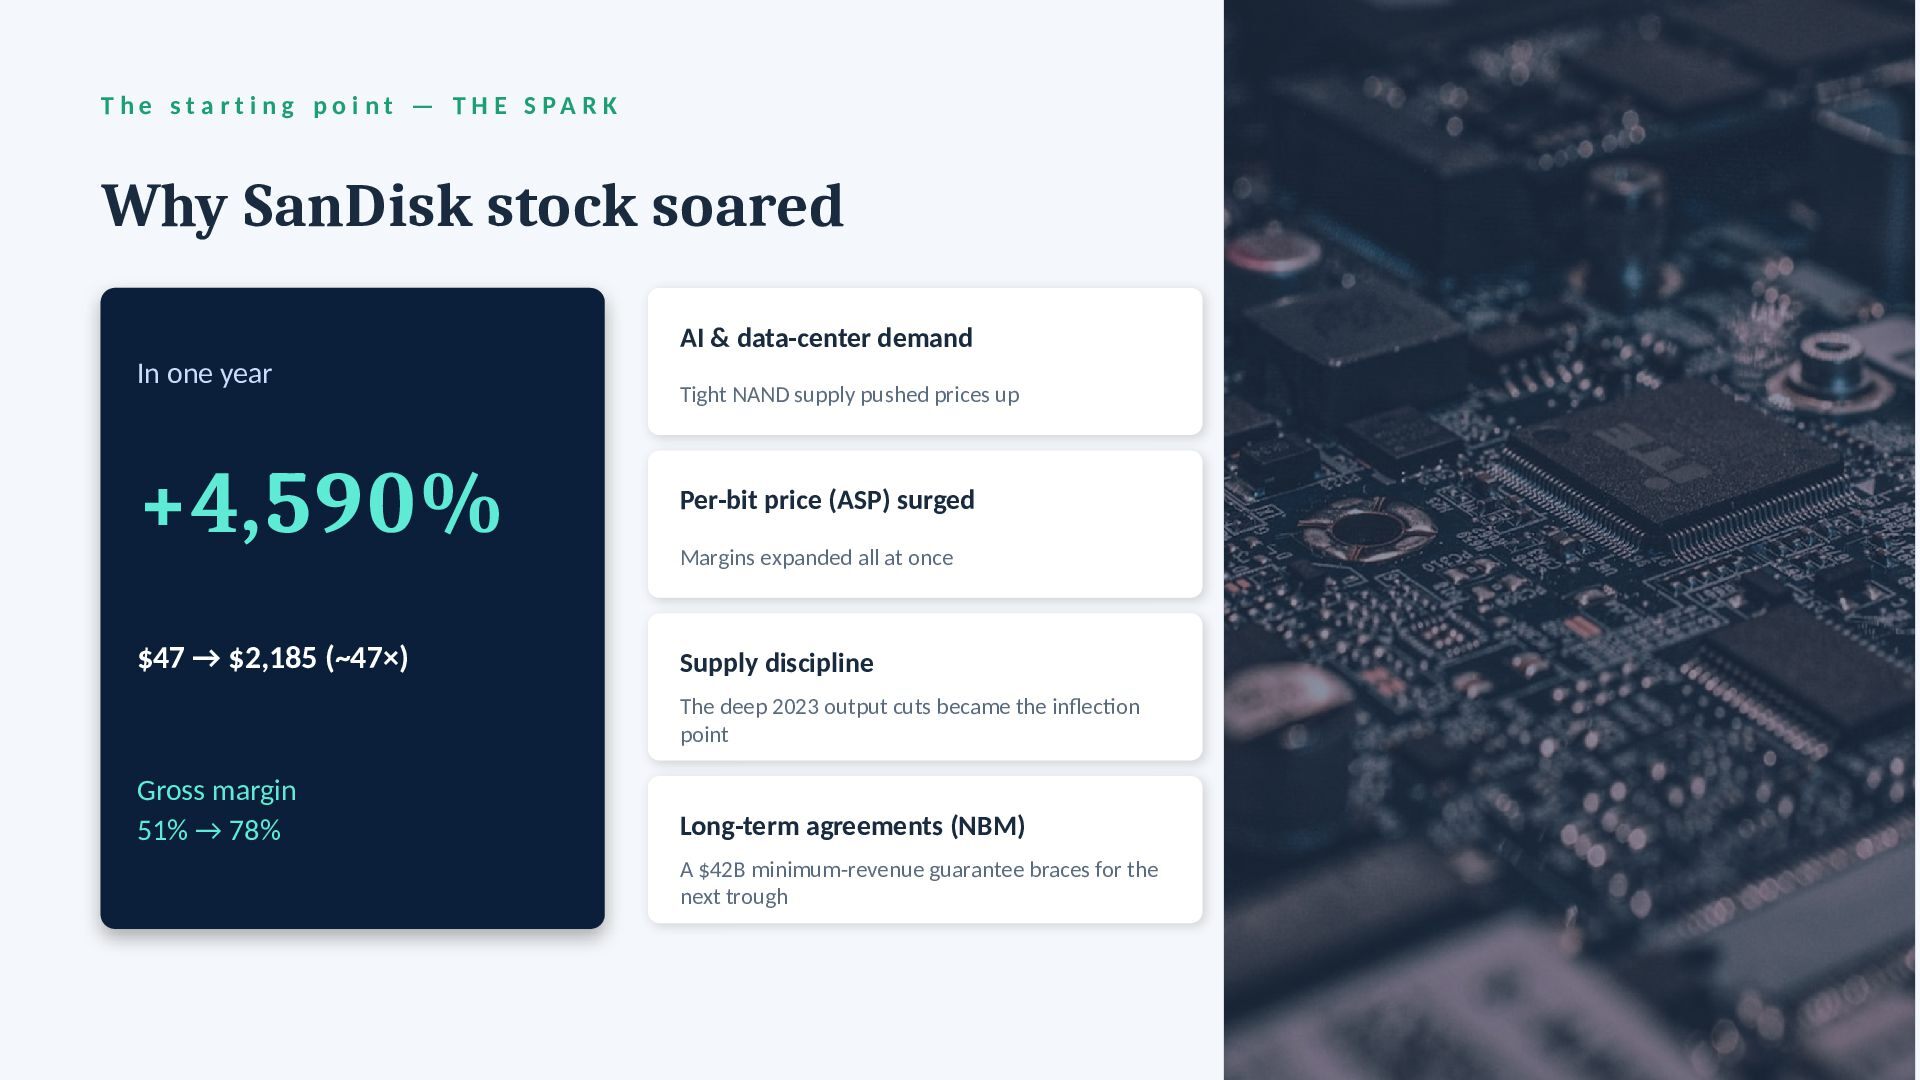
g p o i n t — T H E S P A R K Why SanDisk stock soared In one year +4,590% $47 → $2,185 (~47×) Gross margin 51% → 78% AI & data-center demand Tight NAND supply pushed prices up Per-bit price (ASP) surged Margins expanded all at once Supply discipline The deep 2023 output cuts became the inflection point Long-term agreements (NBM) A $42B minimum-revenue guarantee braces for the next trough
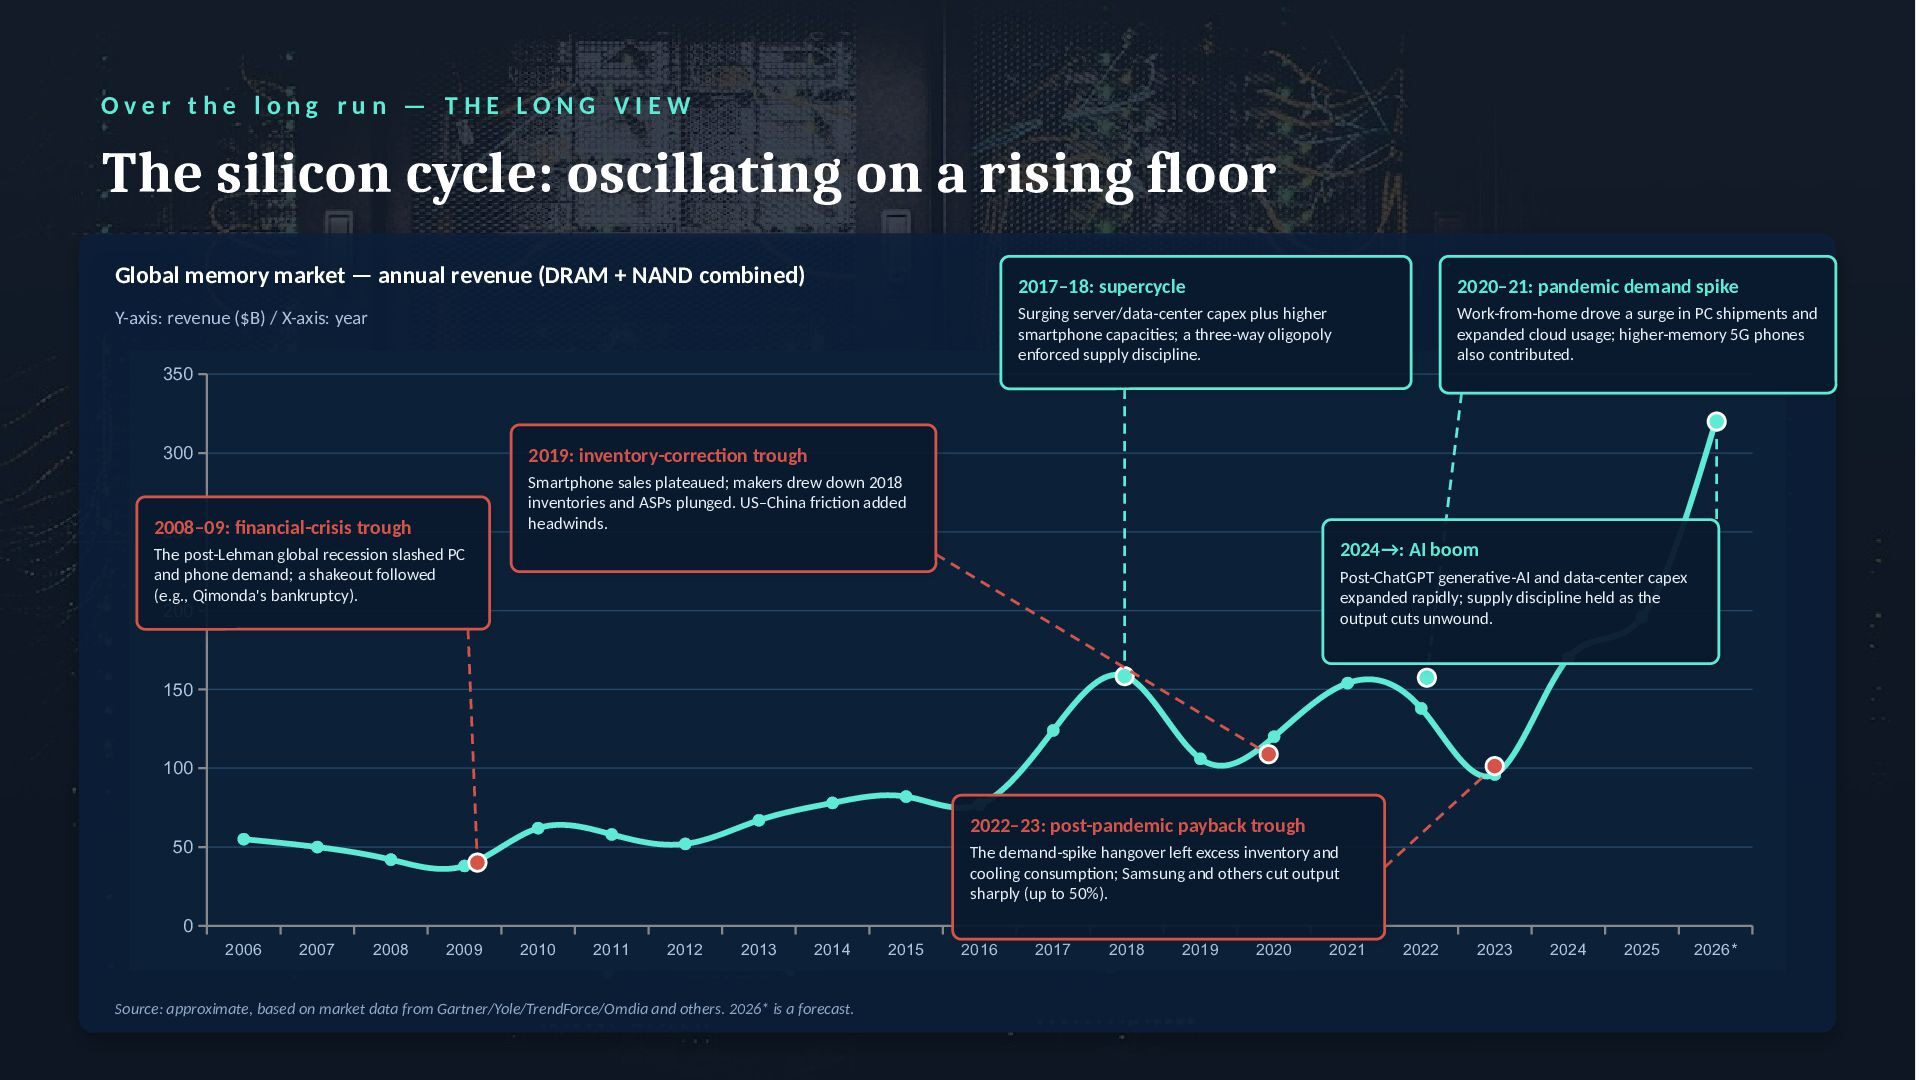
g r u n — T H E L O N G V I E W The silicon cycle: oscillating on a rising floor Global memory market — annual revenue (DRAM + NAND combined) Y-axis: revenue ($B) / X-axis: year 2006 2007 2008 2009 2010 2011 2012 2013 2014 2015 2016 2017 2018 2019 2020 2021 2022 2023 2024 2025 2026* 0 50 100 150 200 250 300 350 2008–09: financial-crisis trough The post-Lehman global recession slashed PC and phone demand; a shakeout followed (e.g., Qimonda's bankruptcy). 2017–18: supercycle Surging server/data-center capex plus higher smartphone capacities; a three-way oligopoly enforced supply discipline. 2019: inventory-correction trough Smartphone sales plateaued; makers drew down 2018 inventories and ASPs plunged. US–China friction added headwinds. 2020–21: pandemic demand spike Work-from-home drove a surge in PC shipments and expanded cloud usage; higher-memory 5G phones also contributed. 2022–23: post-pandemic payback trough The demand-spike hangover left excess inventory and cooling consumption; Samsung and others cut output sharply (up to 50%). 2024→: AI boom Post-ChatGPT generative-AI and data-center capex expanded rapidly; supply discipline held as the output cuts unwound. Source: approximate, based on market data from Gartner/Yole/TrendForce/Omdia and others. 2026* is a forecast.
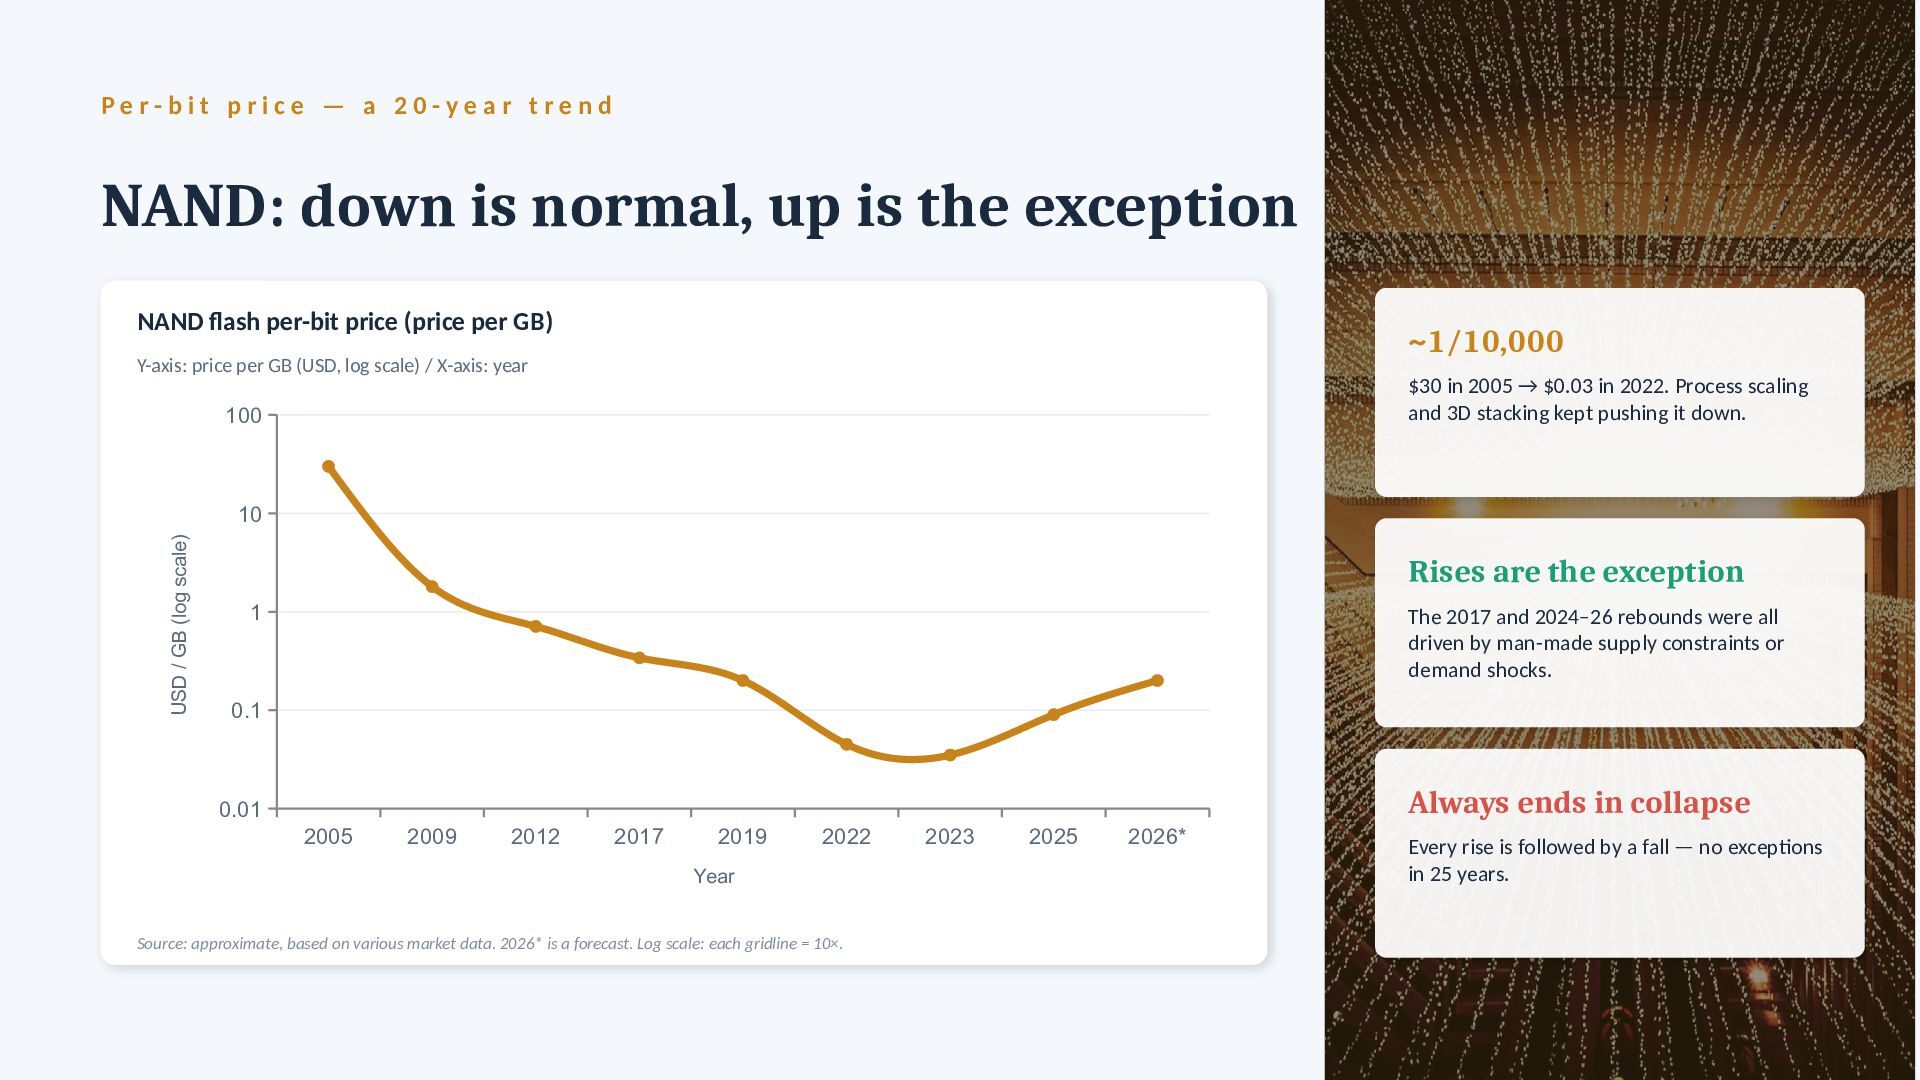
c e — a 2 0 - y e a r t r e n d NAND: down is normal, up is the exception NAND flash per-bit price (price per GB) Y-axis: price per GB (USD, log scale) / X-axis: year 2005 2009 2012 2017 2019 2022 2023 2025 2026* 0.01 0.1 1 10 100 Year USD / GB (log scale) Source: approximate, based on various market data. 2026* is a forecast. Log scale: each gridline = 10×. ~1/10,000 $30 in 2005 → $0.03 in 2022. Process scaling and 3D stacking kept pushing it down. Rises are the exception The 2017 and 2024–26 rebounds were all driven by man-made supply constraints or demand shocks. Always ends in collapse Every rise is followed by a fall — no exceptions in 25 years.
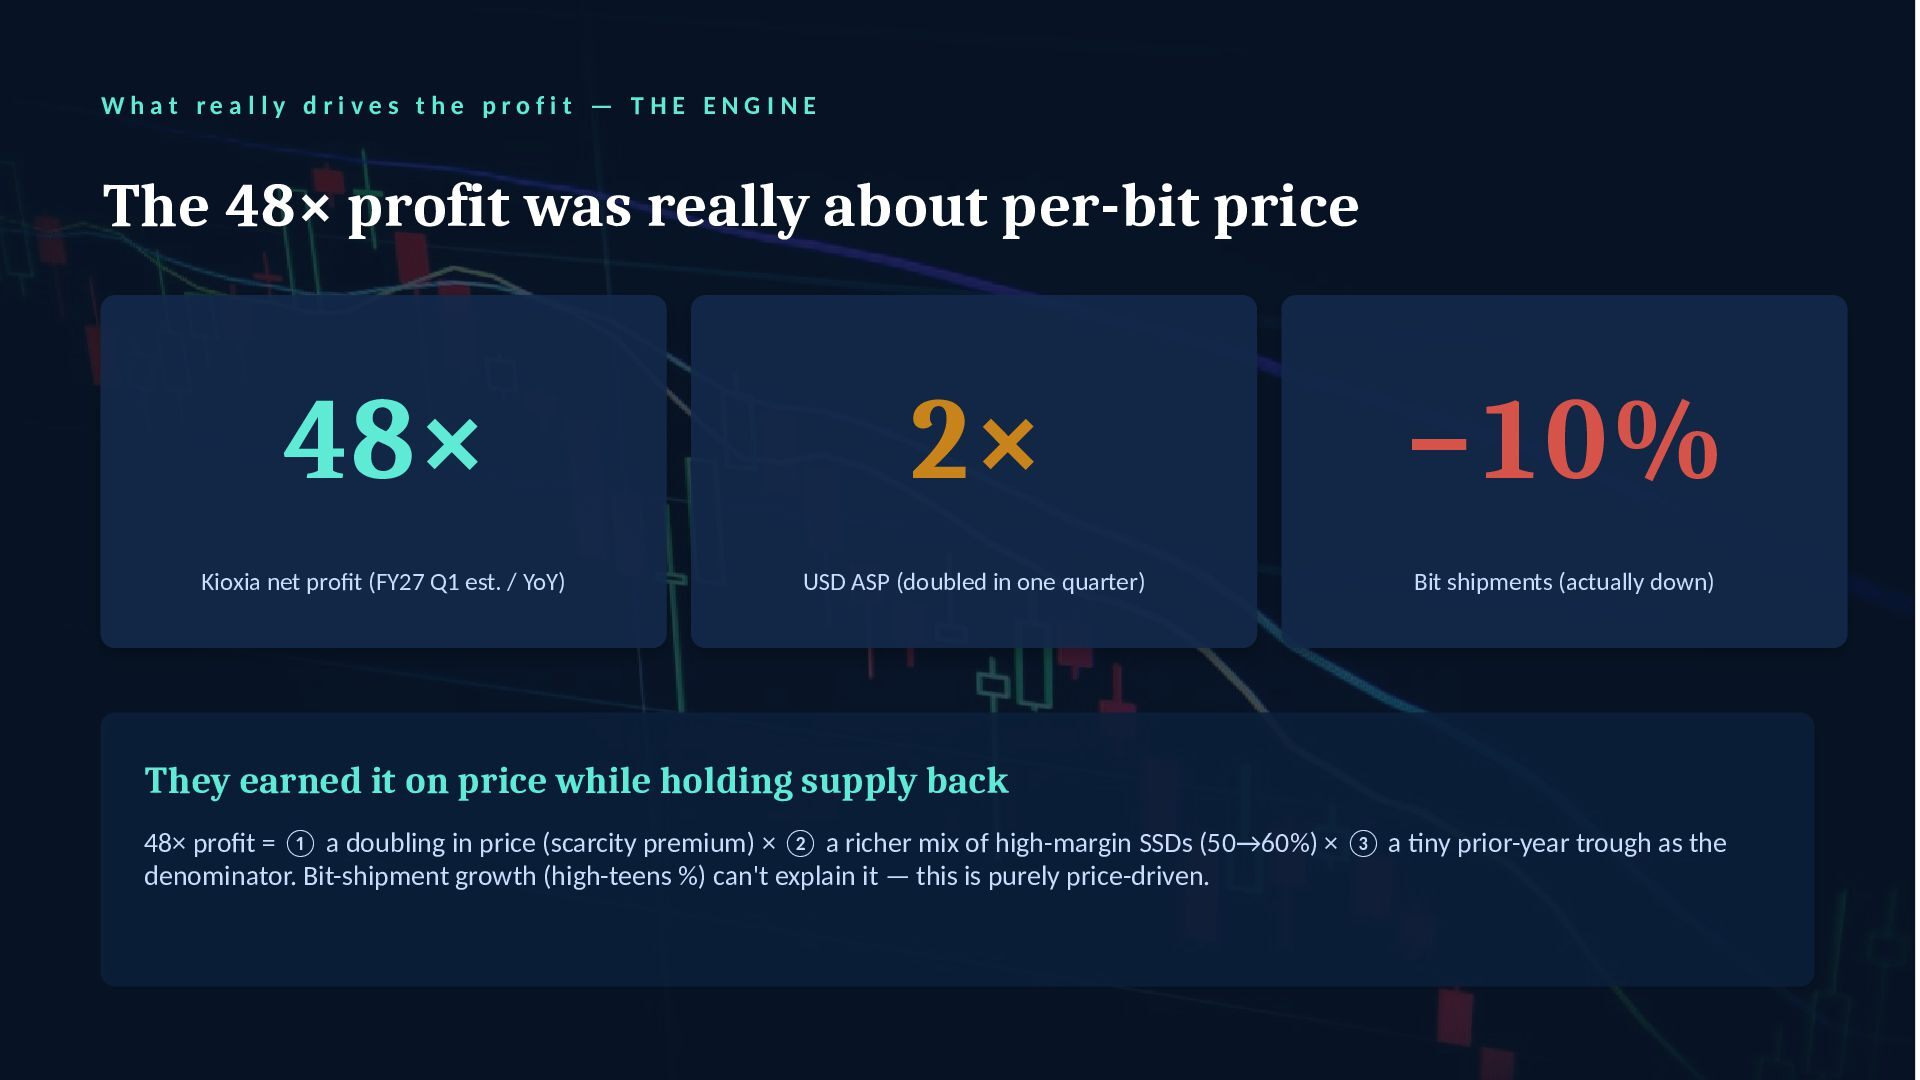
d r i v e s t h e p r o f i t — T H E E N G I N E The 48× profit was really about per-bit price 48× Kioxia net profit (FY27 Q1 est. / YoY) 2× USD ASP (doubled in one quarter) −10% Bit shipments (actually down) They earned it on price while holding supply back 48× profit = ① a doubling in price (scarcity premium) × ② a richer mix of high-margin SSDs (50→60%) × ③ a tiny prior-year trough as the denominator. Bit-shipment growth (high-teens %) can't explain it — this is purely price-driven.
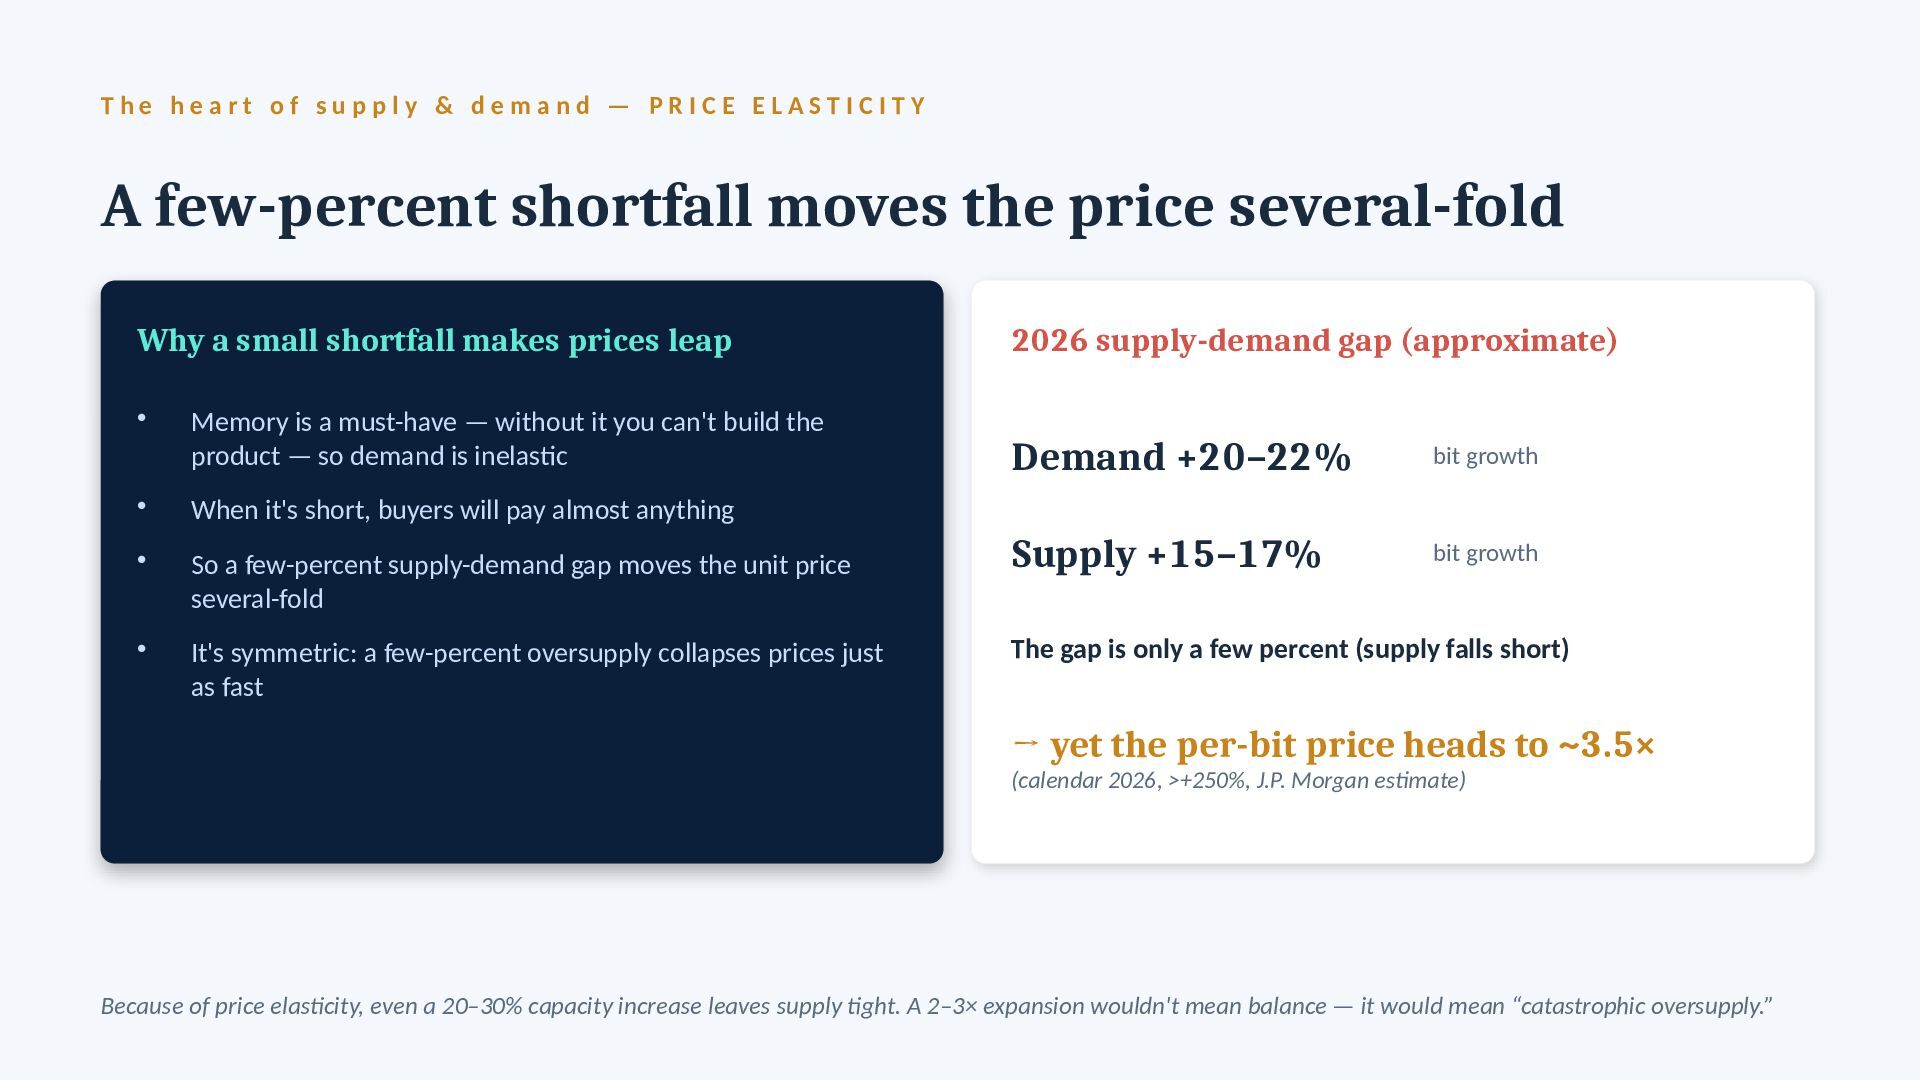
s u p p l y & d e m a n d — P R I C E E L A S T I C I T Y A few-percent shortfall moves the price several-fold Why a small shortfall makes prices leap • Memory is a must-have — without it you can't build the product — so demand is inelastic • When it's short, buyers will pay almost anything • So a few-percent supply-demand gap moves the unit price several-fold • It's symmetric: a few-percent oversupply collapses prices just as fast 2026 supply-demand gap (approximate) Demand +20–22% bit growth Supply +15–17% bit growth The gap is only a few percent (supply falls short) → yet the per-bit price heads to ~3.5× (calendar 2026, >+250%, J.P. Morgan estimate) Because of price elasticity, even a 20–30% capacity increase leaves supply tight. A 2–3× expansion wouldn't mean balance — it would mean “catastrophic oversupply.”
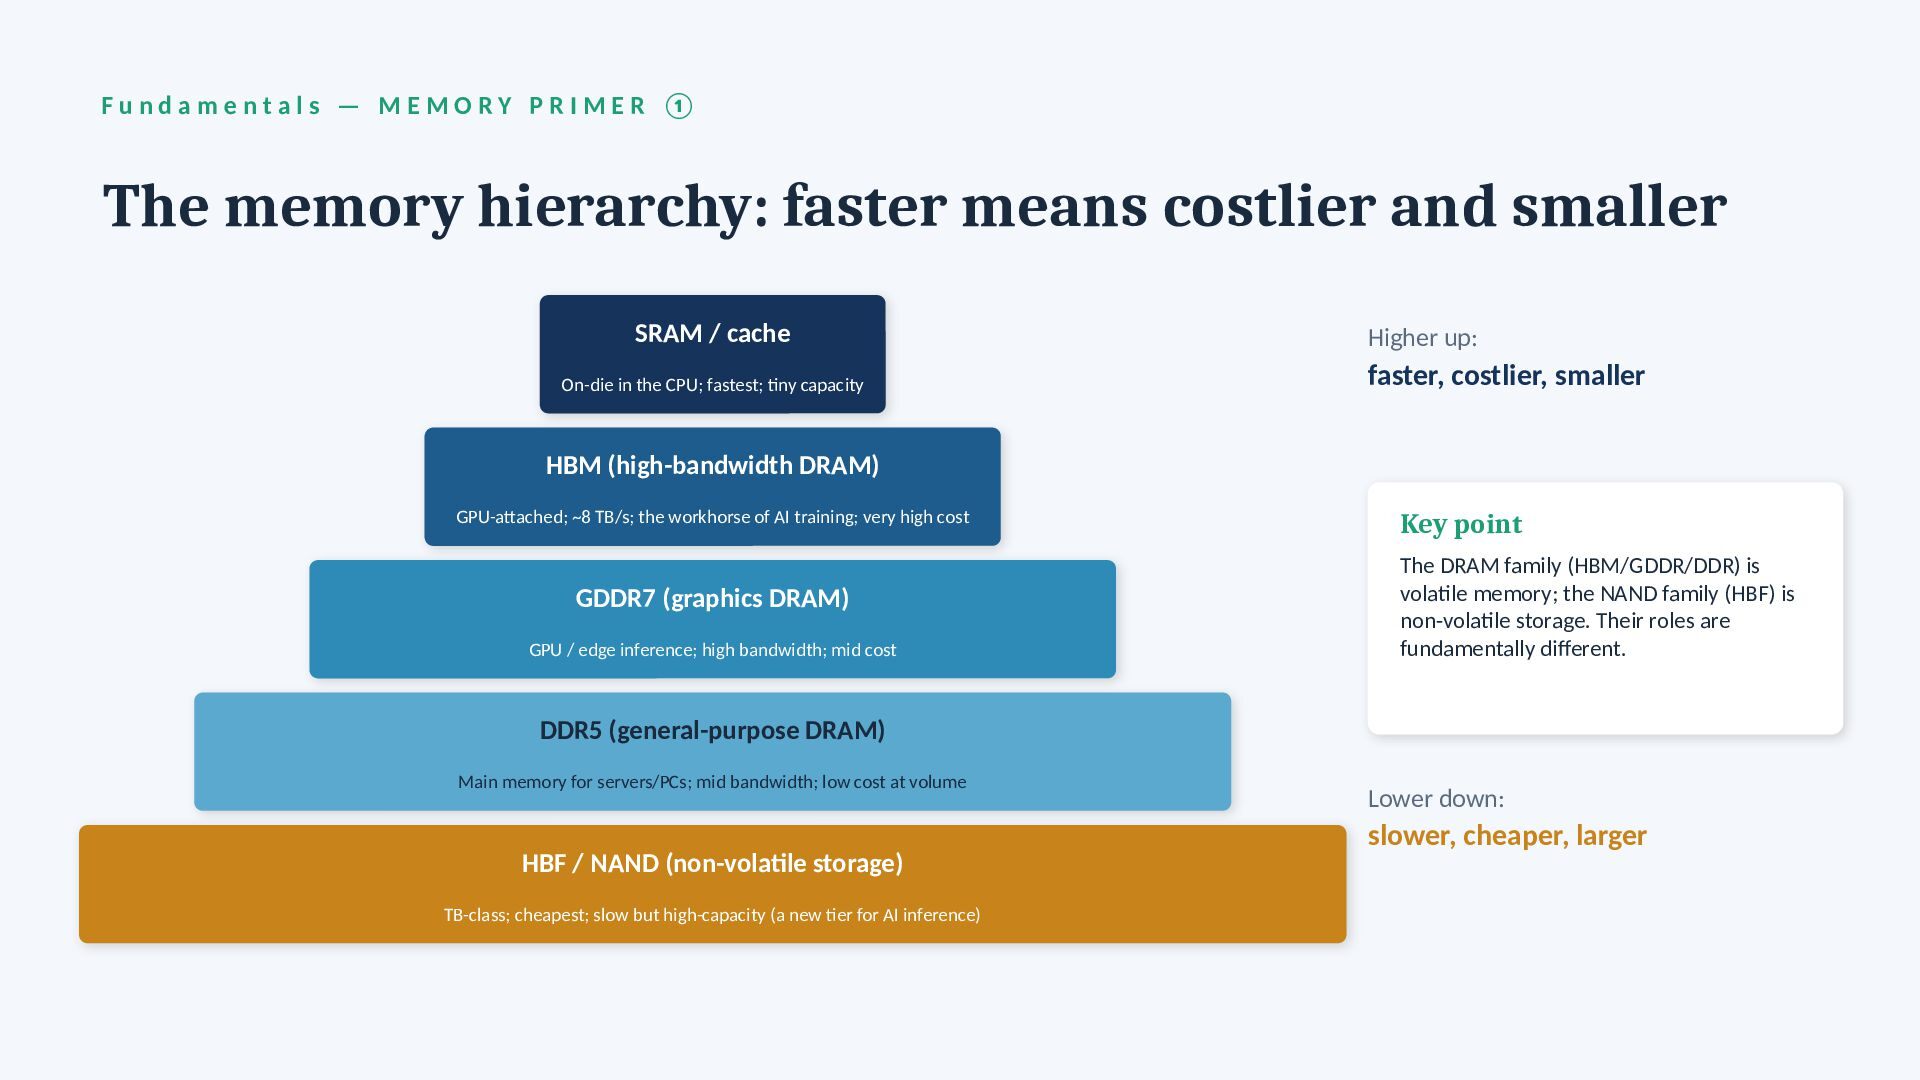
l s — M E M O R Y P R I M E R ① The memory hierarchy: faster means costlier and smaller SRAM / cache On-die in the CPU; fastest; tiny capacity HBM (high-bandwidth DRAM) GPU-attached; ~8 TB/s; the workhorse of AI training; very high cost GDDR7 (graphics DRAM) GPU / edge inference; high bandwidth; mid cost DDR5 (general-purpose DRAM) Main memory for servers/PCs; mid bandwidth; low cost at volume HBF / NAND (non-volatile storage) TB-class; cheapest; slow but high-capacity (a new tier for AI inference) Higher up: faster, costlier, smaller Lower down: slower, cheaper, larger Key point The DRAM family (HBM/GDDR/DDR) is volatile memory; the NAND family (HBF) is non-volatile storage. Their roles are fundamentally different.
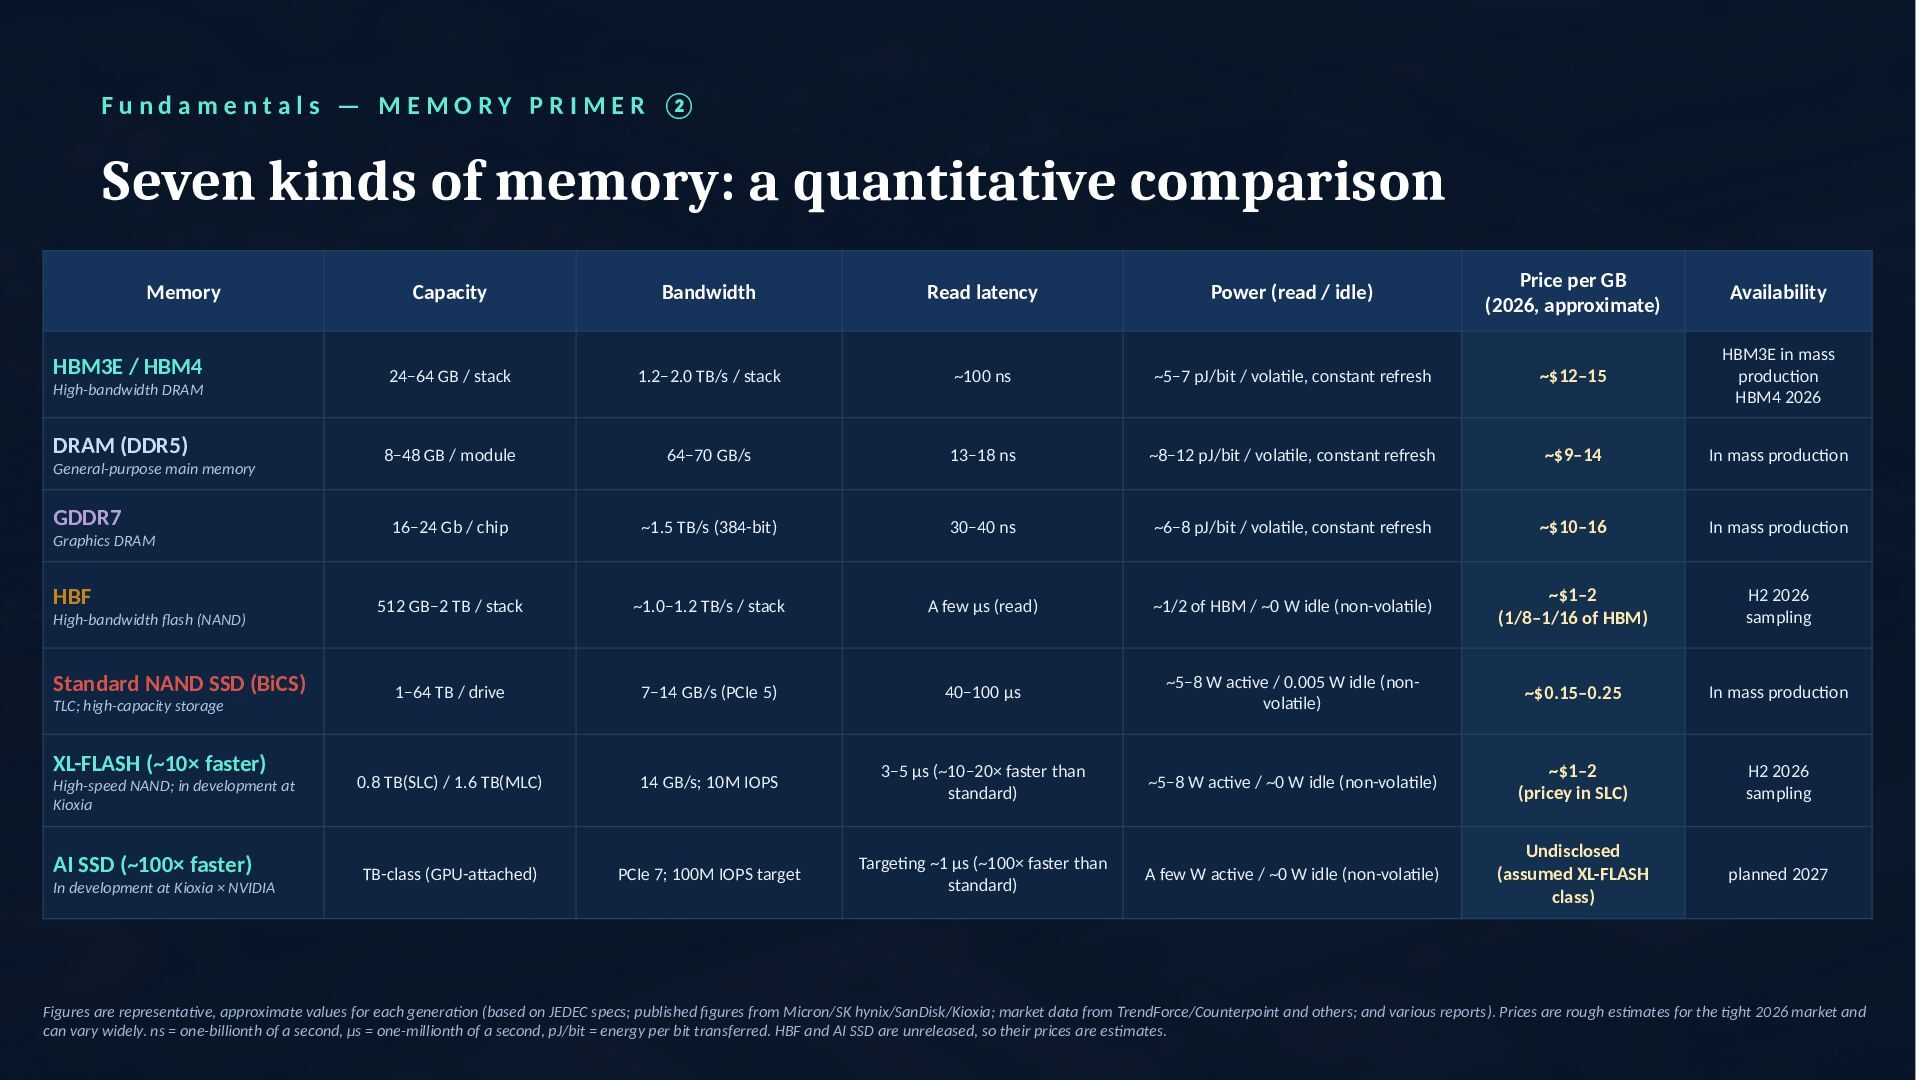
l s — M E M O R Y P R I M E R ② Seven kinds of memory: a quantitative comparison Memory Capacity Bandwidth Read latency Power (read / idle) Price per GB (2026, approximate) Availability HBM3E / HBM4 High-bandwidth DRAM 24–64 GB / stack 1.2–2.0 TB/s / stack ~100 ns ~5–7 pJ/bit / volatile, constant refresh ~$12–15 HBM3E in mass production HBM4 2026 DRAM (DDR5) General-purpose main memory 8–48 GB / module 64–70 GB/s 13–18 ns ~8–12 pJ/bit / volatile, constant refresh ~$9–14 In mass production GDDR7 Graphics DRAM 16–24 Gb / chip ~1.5 TB/s (384-bit) 30–40 ns ~6–8 pJ/bit / volatile, constant refresh ~$10–16 In mass production HBF High-bandwidth flash (NAND) 512 GB–2 TB / stack ~1.0–1.2 TB/s / stack A few μs (read) ~1/2 of HBM / ~0 W idle (non-volatile) ~$1–2 (1/8–1/16 of HBM) H2 2026 sampling Standard NAND SSD (BiCS) TLC; high-capacity storage 1–64 TB / drive 7–14 GB/s (PCIe 5) 40–100 μs ~5–8 W active / 0.005 W idle (non- volatile) ~$0.15–0.25 In mass production XL-FLASH (~10× faster) High-speed NAND; in development at Kioxia 0.8 TB(SLC) / 1.6 TB(MLC) 14 GB/s; 10M IOPS 3–5 μs (~10–20× faster than standard) ~5–8 W active / ~0 W idle (non-volatile) ~$1–2 (pricey in SLC) H2 2026 sampling AI SSD (~100× faster) In development at Kioxia × NVIDIA TB-class (GPU-attached) PCIe 7; 100M IOPS target Targeting ~1 μs (~100× faster than standard) A few W active / ~0 W idle (non-volatile) Undisclosed (assumed XL-FLASH class) planned 2027 Figures are representative, approximate values for each generation (based on JEDEC specs; published figures from Micron/SK hynix/SanDisk/Kioxia; market data from TrendForce/Counterpoint and others; and various reports). Prices are rough estimates for the tight 2026 market and can vary widely. ns = one-billionth of a second, μs = one-millionth of a second, pJ/bit = energy per bit transferred. HBF and AI SSD are unreleased, so their prices are estimates.
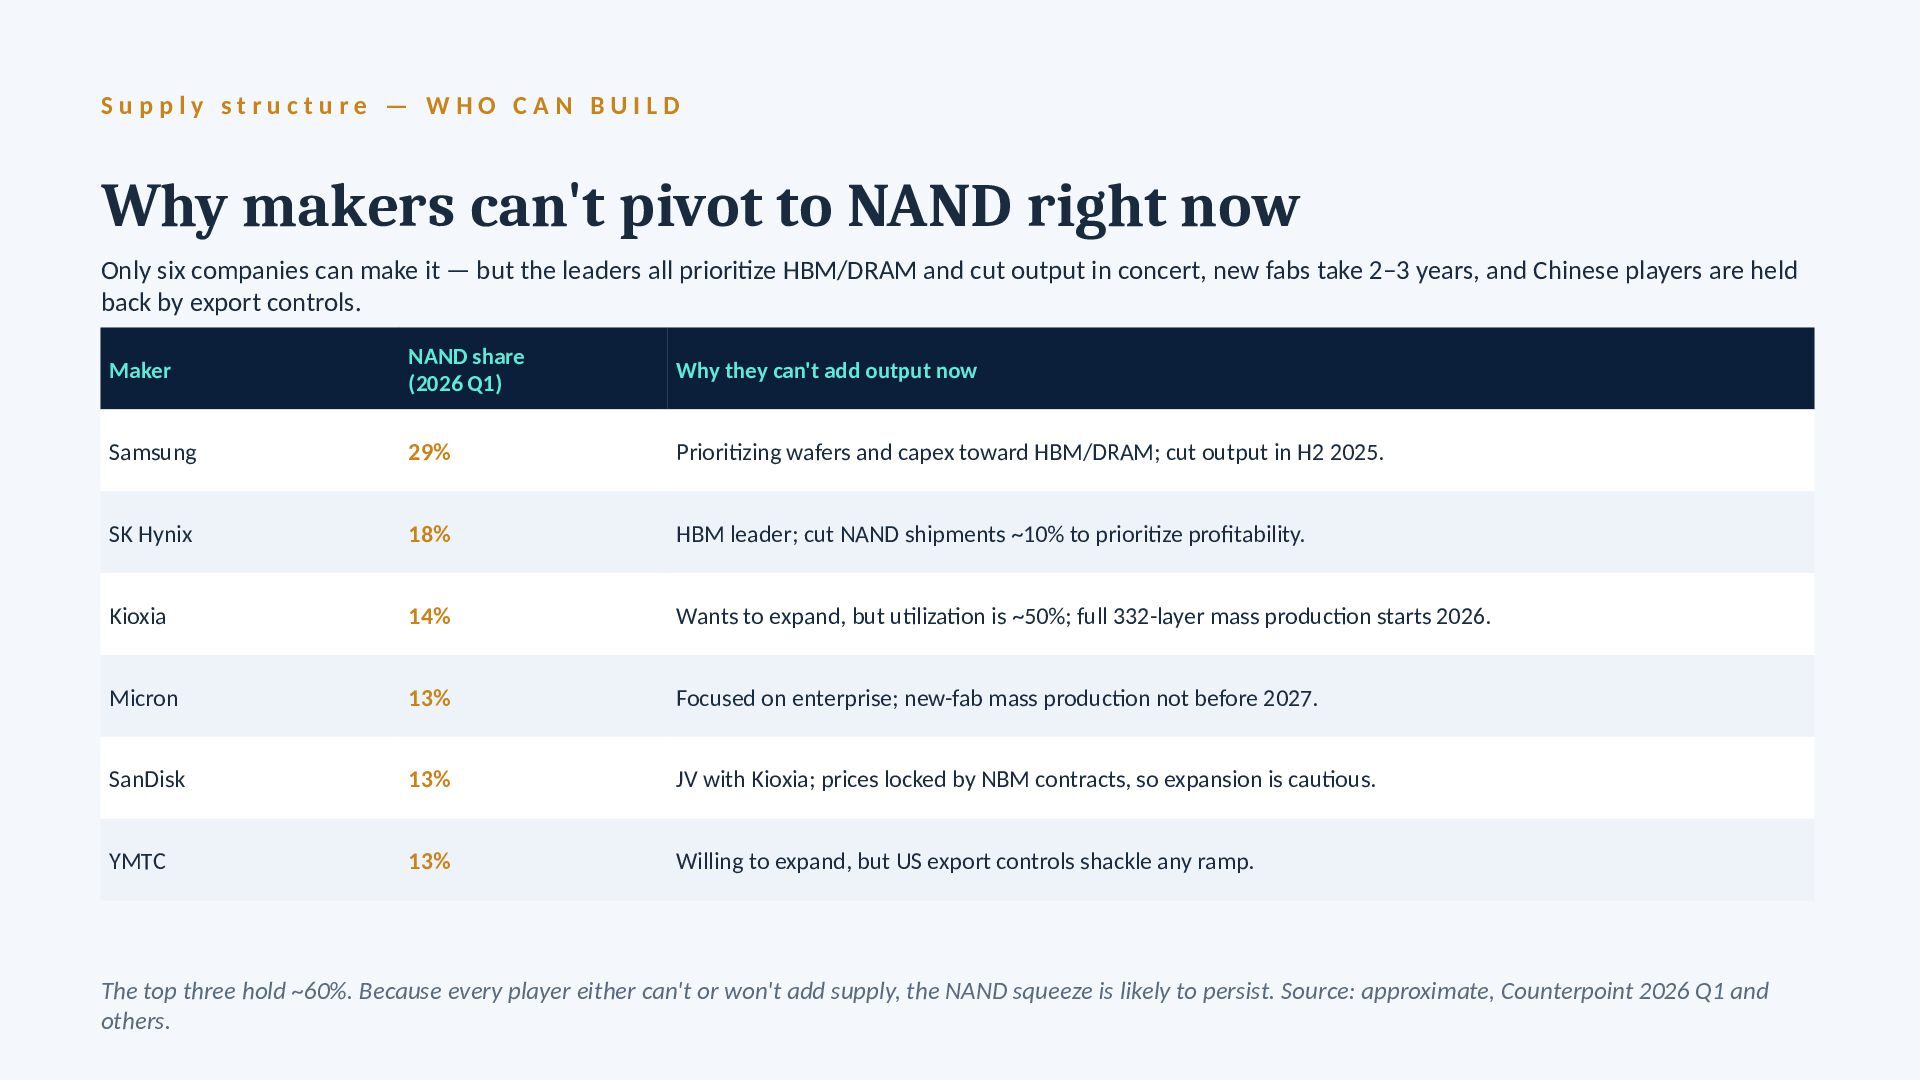
c t u r e — W H O C A N B U I L D Why makers can't pivot to NAND right now Only six companies can make it — but the leaders all prioritize HBM/DRAM and cut output in concert, new fabs take 2–3 years, and Chinese players are held back by export controls. Maker NAND share (2026 Q1) Why they can't add output now Samsung 29% Prioritizing wafers and capex toward HBM/DRAM; cut output in H2 2025. SK Hynix 18% HBM leader; cut NAND shipments ~10% to prioritize profitability. Kioxia 14% Wants to expand, but utilization is ~50%; full 332-layer mass production starts 2026. Micron 13% Focused on enterprise; new-fab mass production not before 2027. SanDisk 13% JV with Kioxia; prices locked by NBM contracts, so expansion is cautious. YMTC 13% Willing to expand, but US export controls shackle any ramp. The top three hold ~60%. Because every player either can't or won't add supply, the NAND squeeze is likely to persist. Source: approximate, Counterpoint 2026 Q1 and others.
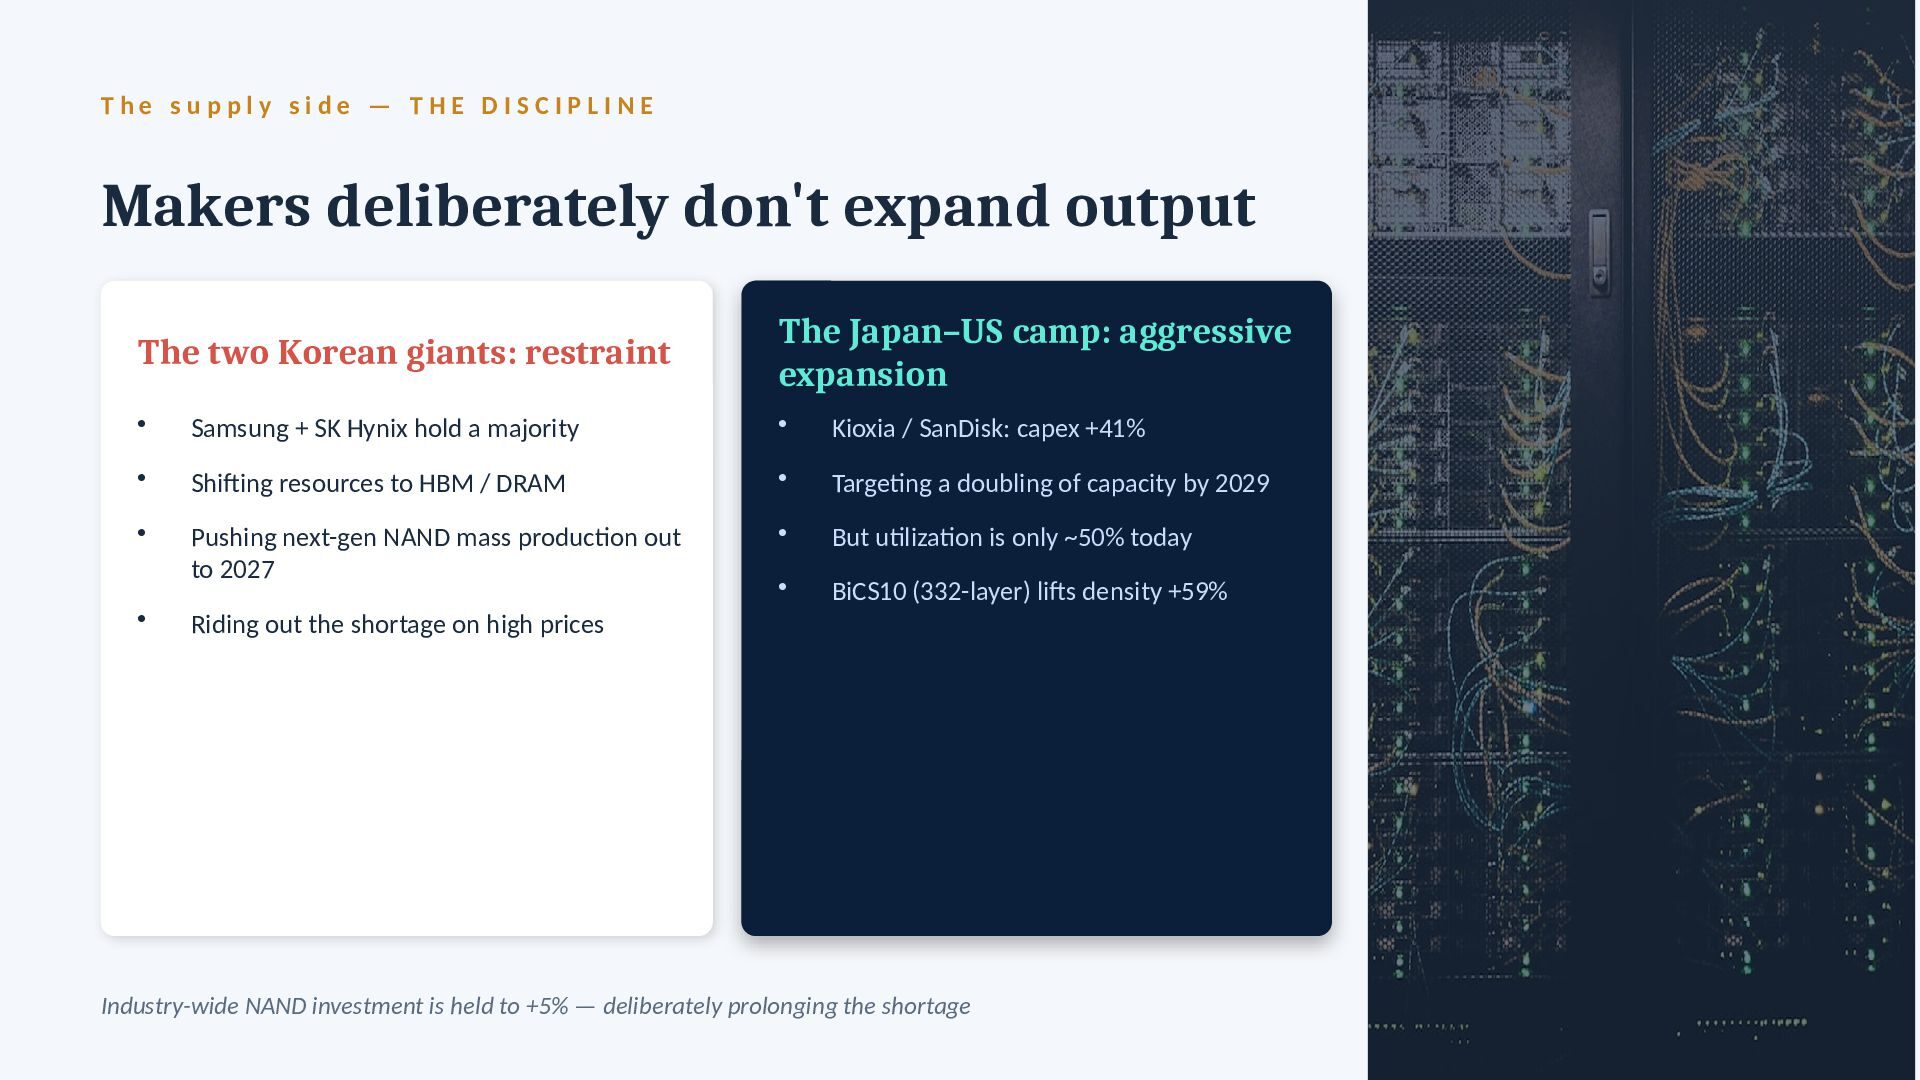
i d e — T H E D I S C I P L I N E Makers deliberately don't expand output The two Korean giants: restraint • Samsung + SK Hynix hold a majority • Shifting resources to HBM / DRAM • Pushing next-gen NAND mass production out to 2027 • Riding out the shortage on high prices The Japan–US camp: aggressive expansion • Kioxia / SanDisk: capex +41% • Targeting a doubling of capacity by 2029 • But utilization is only ~50% today • BiCS10 (332-layer) lifts density +59% Industry-wide NAND investment is held to +5% — deliberately prolonging the shortage
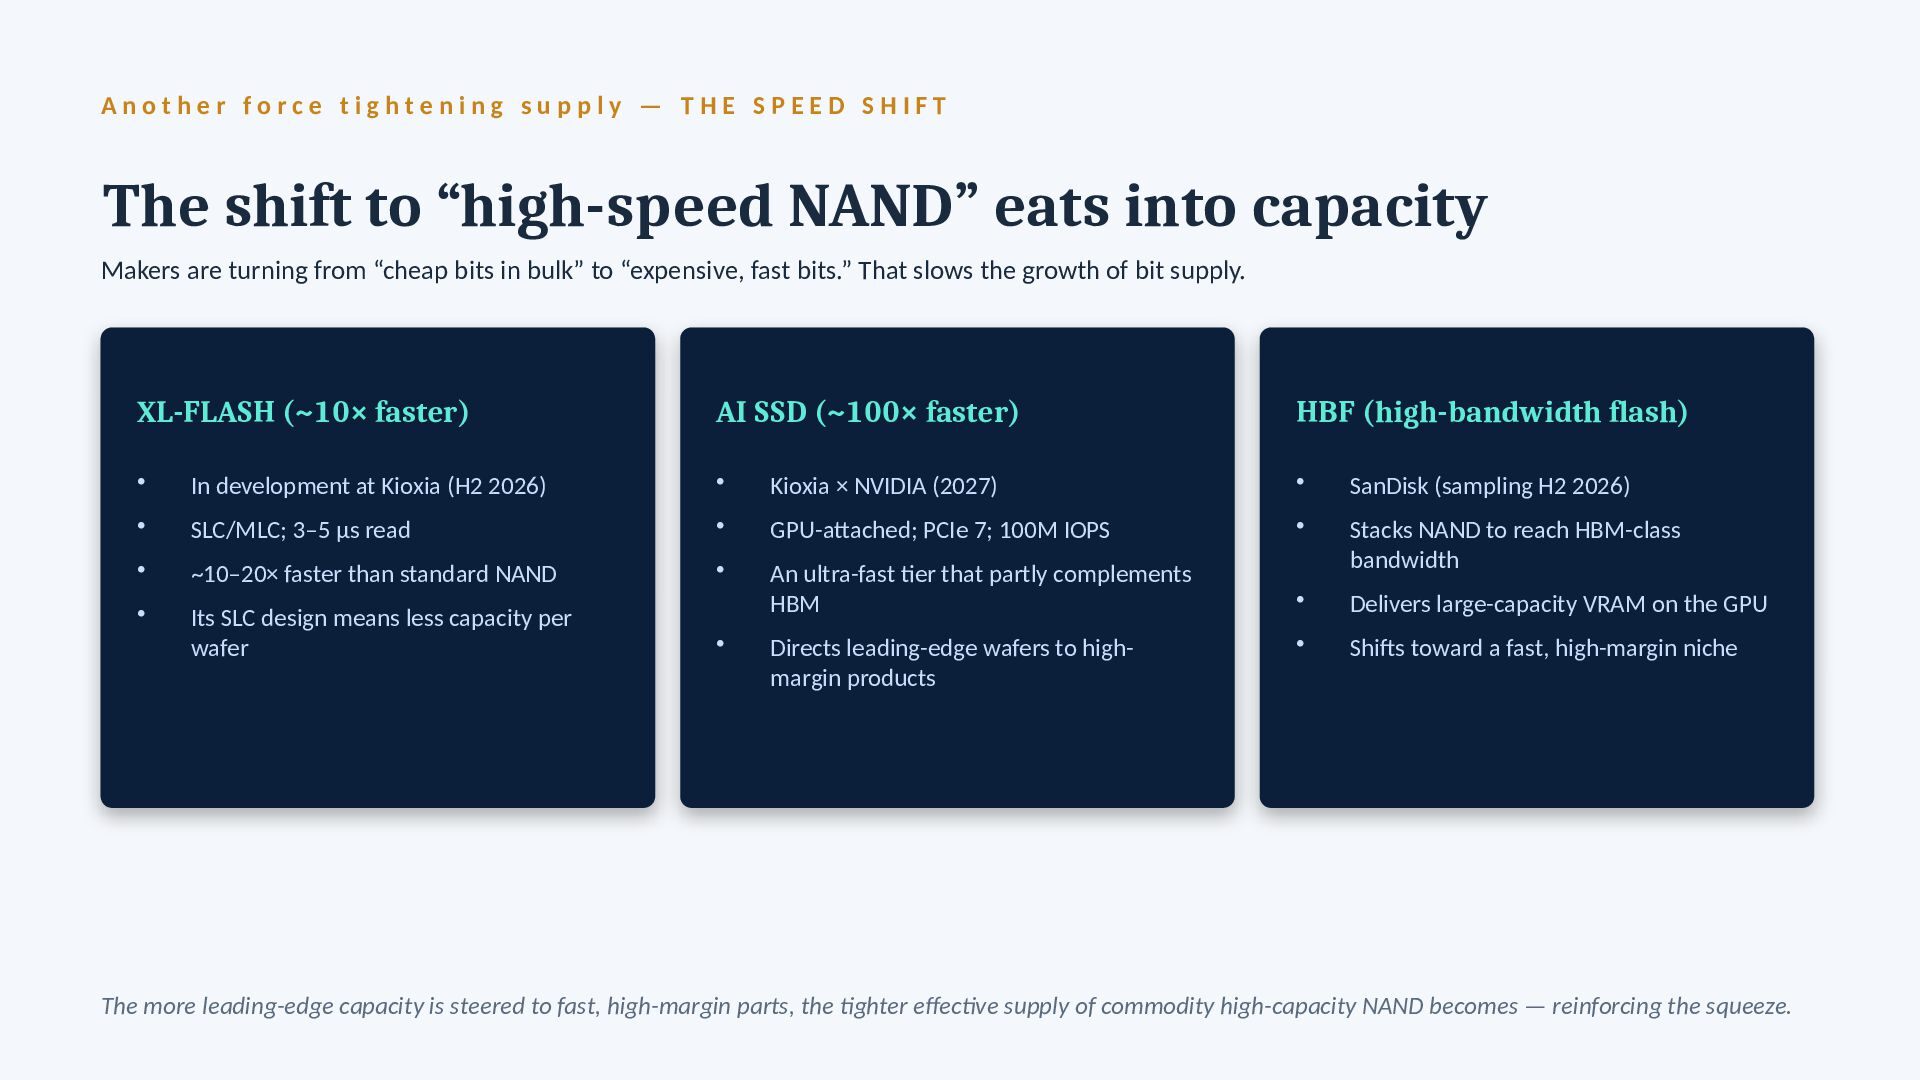
c e t i g h t e n i n g s u p p l y — T H E S P E E D S H I F T The shift to “high-speed NAND” eats into capacity Makers are turning from “cheap bits in bulk” to “expensive, fast bits.” That slows the growth of bit supply. XL-FLASH (~10× faster) • In development at Kioxia (H2 2026) • SLC/MLC; 3–5 μs read • ~10–20× faster than standard NAND • Its SLC design means less capacity per wafer AI SSD (~100× faster) • Kioxia × NVIDIA (2027) • GPU-attached; PCIe 7; 100M IOPS • An ultra-fast tier that partly complements HBM • Directs leading-edge wafers to high- margin products HBF (high-bandwidth flash) • SanDisk (sampling H2 2026) • Stacks NAND to reach HBM-class bandwidth • Delivers large-capacity VRAM on the GPU • Shifts toward a fast, high-margin niche The more leading-edge capacity is steered to fast, high-margin parts, the tighter effective supply of commodity high-capacity NAND becomes — reinforcing the squeeze.
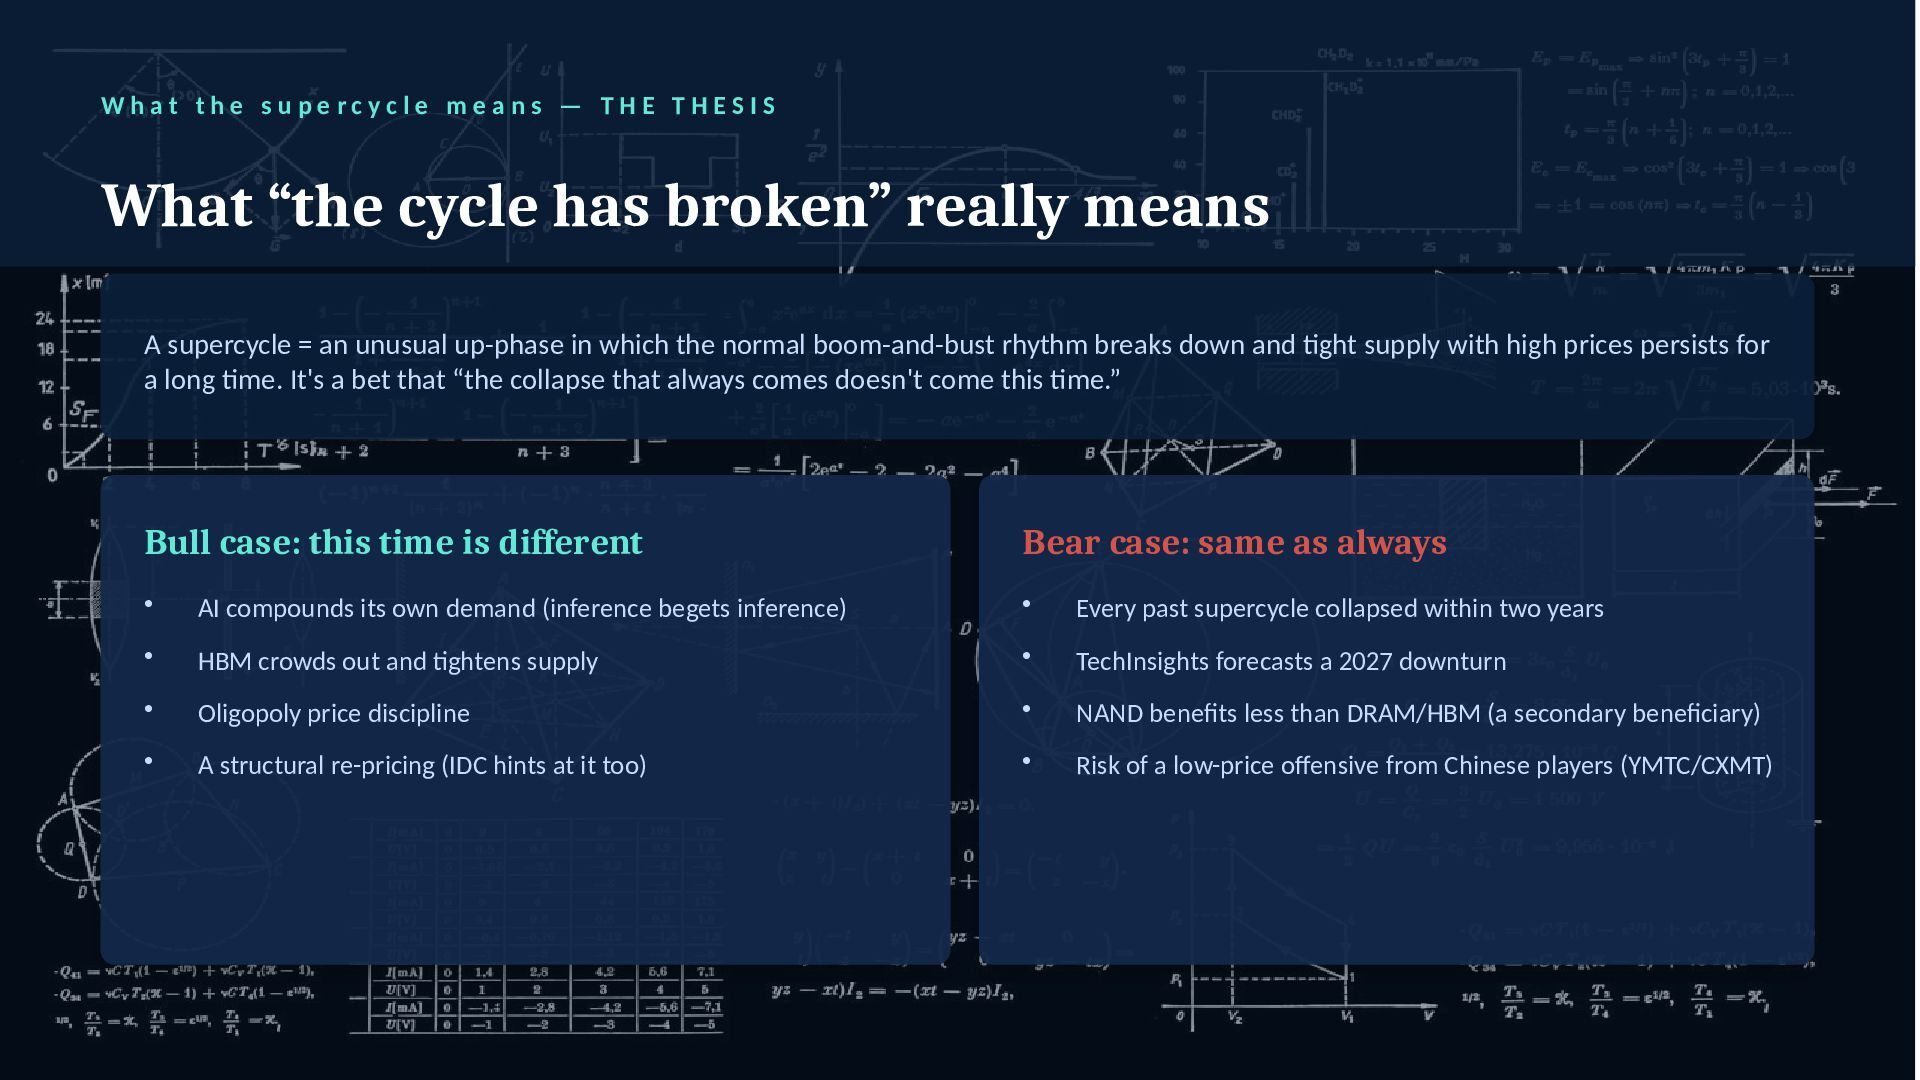
e r c y c l e m e a n s — T H E T H E S I S What “the cycle has broken” really means A supercycle = an unusual up-phase in which the normal boom-and-bust rhythm breaks down and tight supply with high prices persists for a long time. It's a bet that “the collapse that always comes doesn't come this time.” Bull case: this time is different • AI compounds its own demand (inference begets inference) • HBM crowds out and tightens supply • Oligopoly price discipline • A structural re-pricing (IDC hints at it too) Bear case: same as always • Every past supercycle collapsed within two years • TechInsights forecasts a 2027 downturn • NAND benefits less than DRAM/HBM (a secondary beneficiary) • Risk of a low-price offensive from Chinese players (YMTC/CXMT)
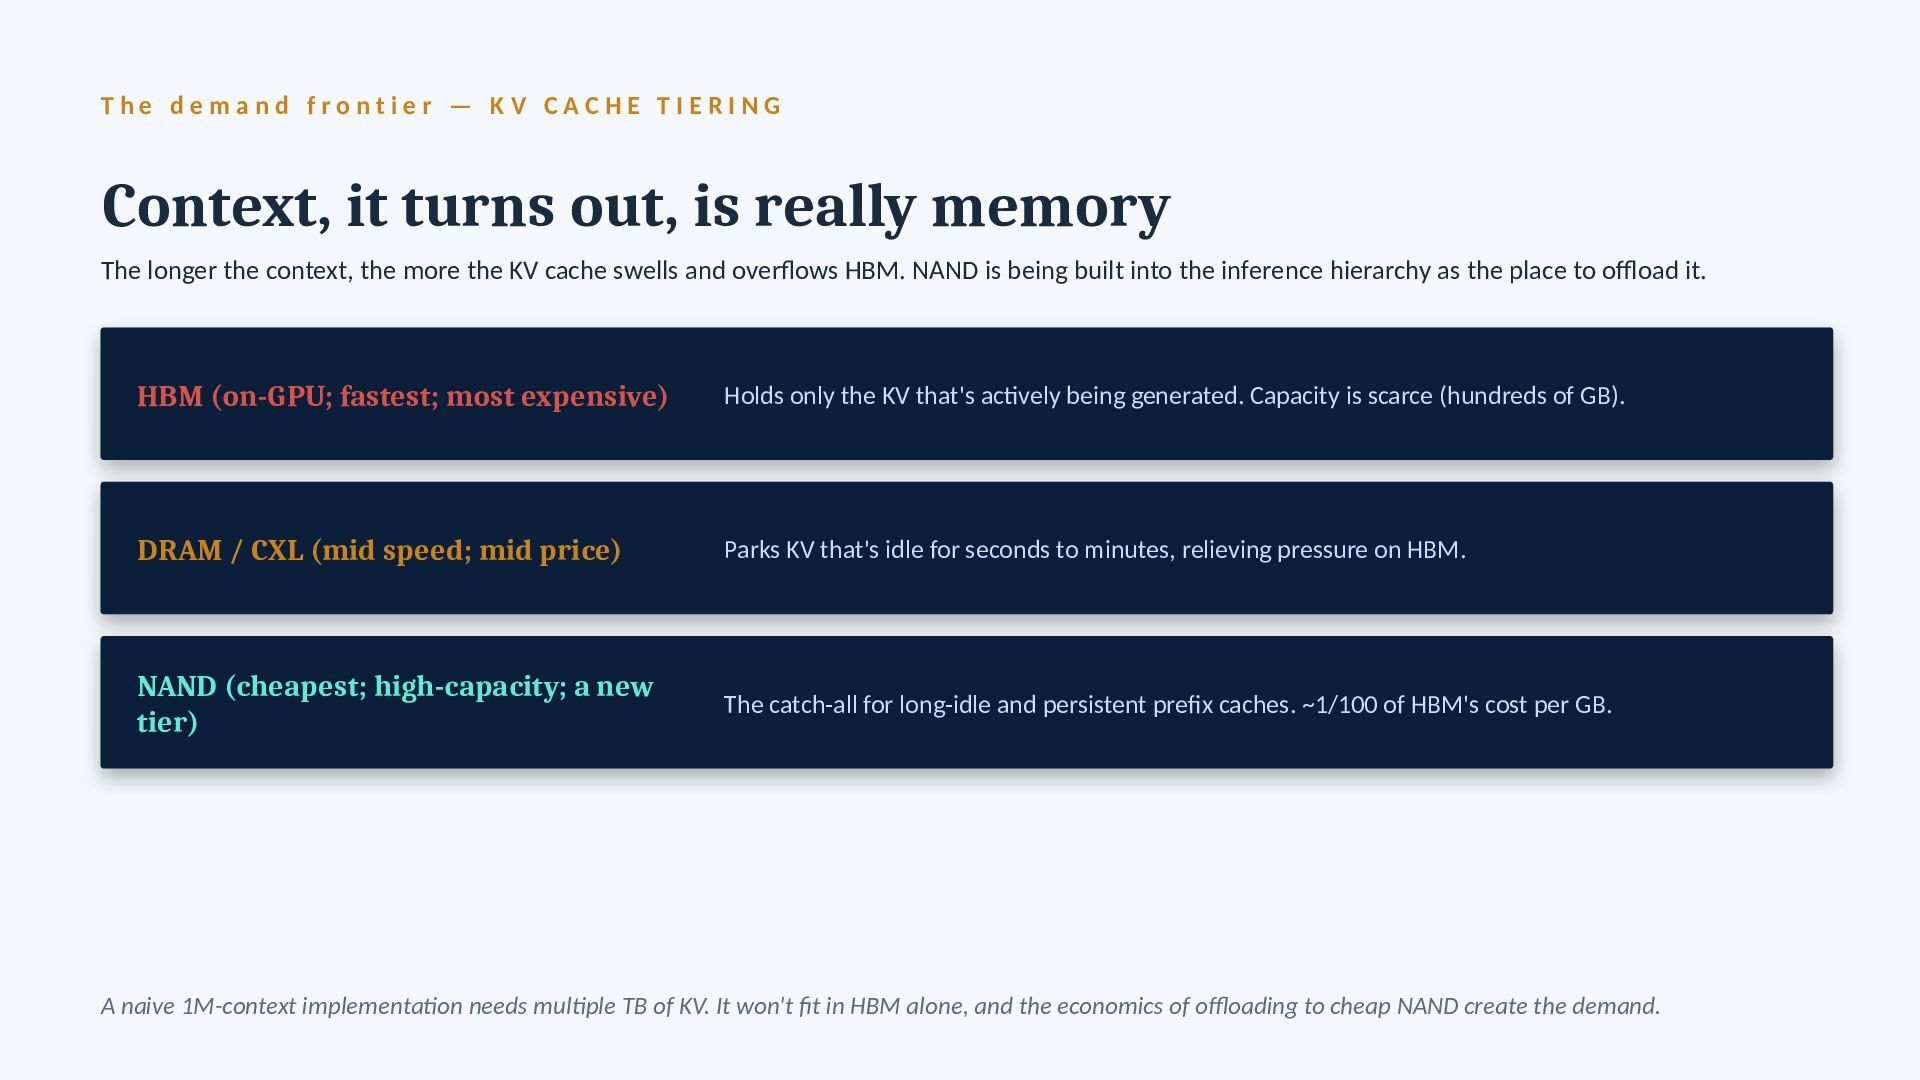
r o n t i e r — K V C A C H E T I E R I N G Context, it turns out, is really memory The longer the context, the more the KV cache swells and overflows HBM. NAND is being built into the inference hierarchy as the place to offload it. HBM (on-GPU; fastest; most expensive) Holds only the KV that's actively being generated. Capacity is scarce (hundreds of GB). DRAM / CXL (mid speed; mid price) Parks KV that's idle for seconds to minutes, relieving pressure on HBM. NAND (cheapest; high-capacity; a new tier) The catch-all for long-idle and persistent prefix caches. ~1/100 of HBM's cost per GB. A naive 1M-context implementation needs multiple TB of KV. It won't fit in HBM alone, and the economics of offloading to cheap NAND create the demand.
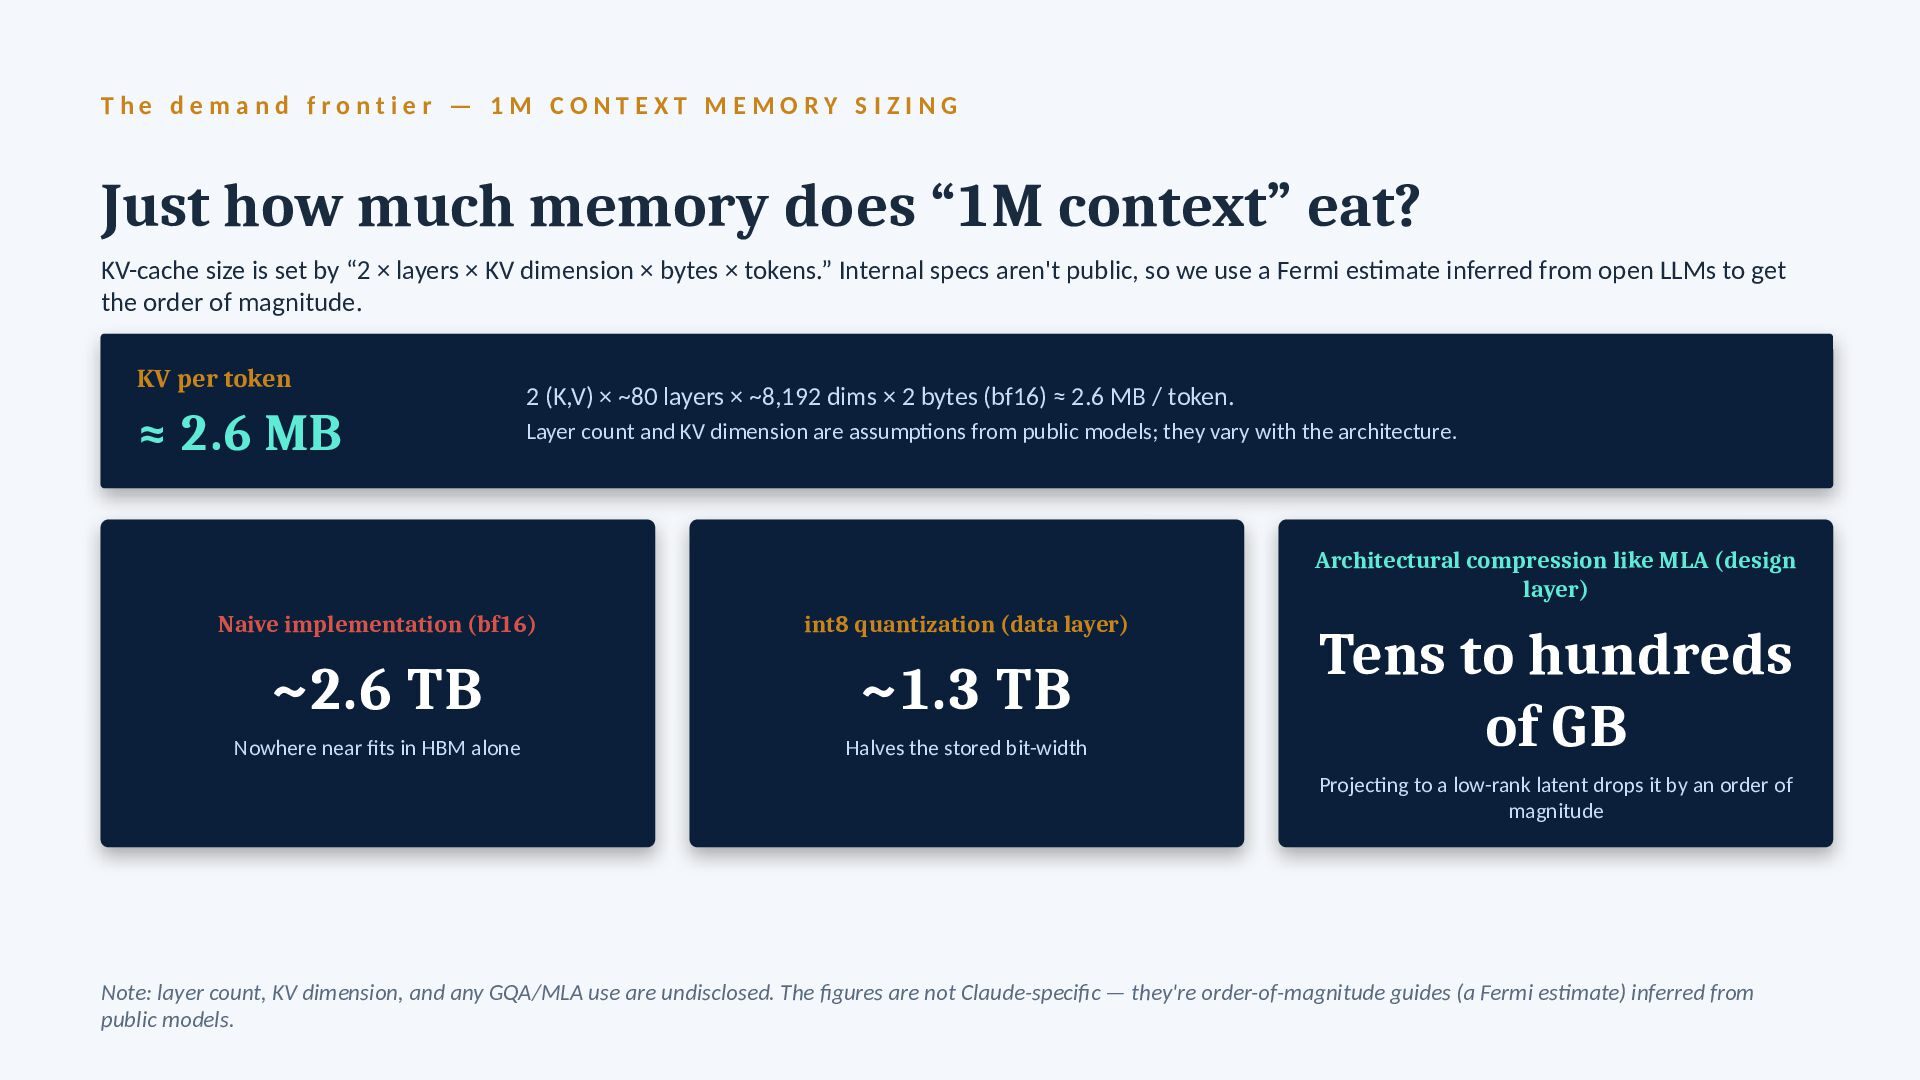
r o n t i e r — 1 M C O N T E X T M E M O R Y S I Z I N G Just how much memory does “1M context” eat? KV-cache size is set by “2 × layers × KV dimension × bytes × tokens.” Internal specs aren't public, so we use a Fermi estimate inferred from open LLMs to get the order of magnitude. KV per token ≈ 2.6 MB 2 (K,V) × ~80 layers × ~8,192 dims × 2 bytes (bf16) ≈ 2.6 MB / token. Layer count and KV dimension are assumptions from public models; they vary with the architecture. Naive implementation (bf16) ~2.6 TB Nowhere near fits in HBM alone int8 quantization (data layer) ~1.3 TB Halves the stored bit-width Architectural compression like MLA (design layer) Tens to hundreds of GB Projecting to a low-rank latent drops it by an order of magnitude Note: layer count, KV dimension, and any GQA/MLA use are undisclosed. The figures are not Claude-specific — they're order-of-magnitude guides (a Fermi estimate) inferred from public models.
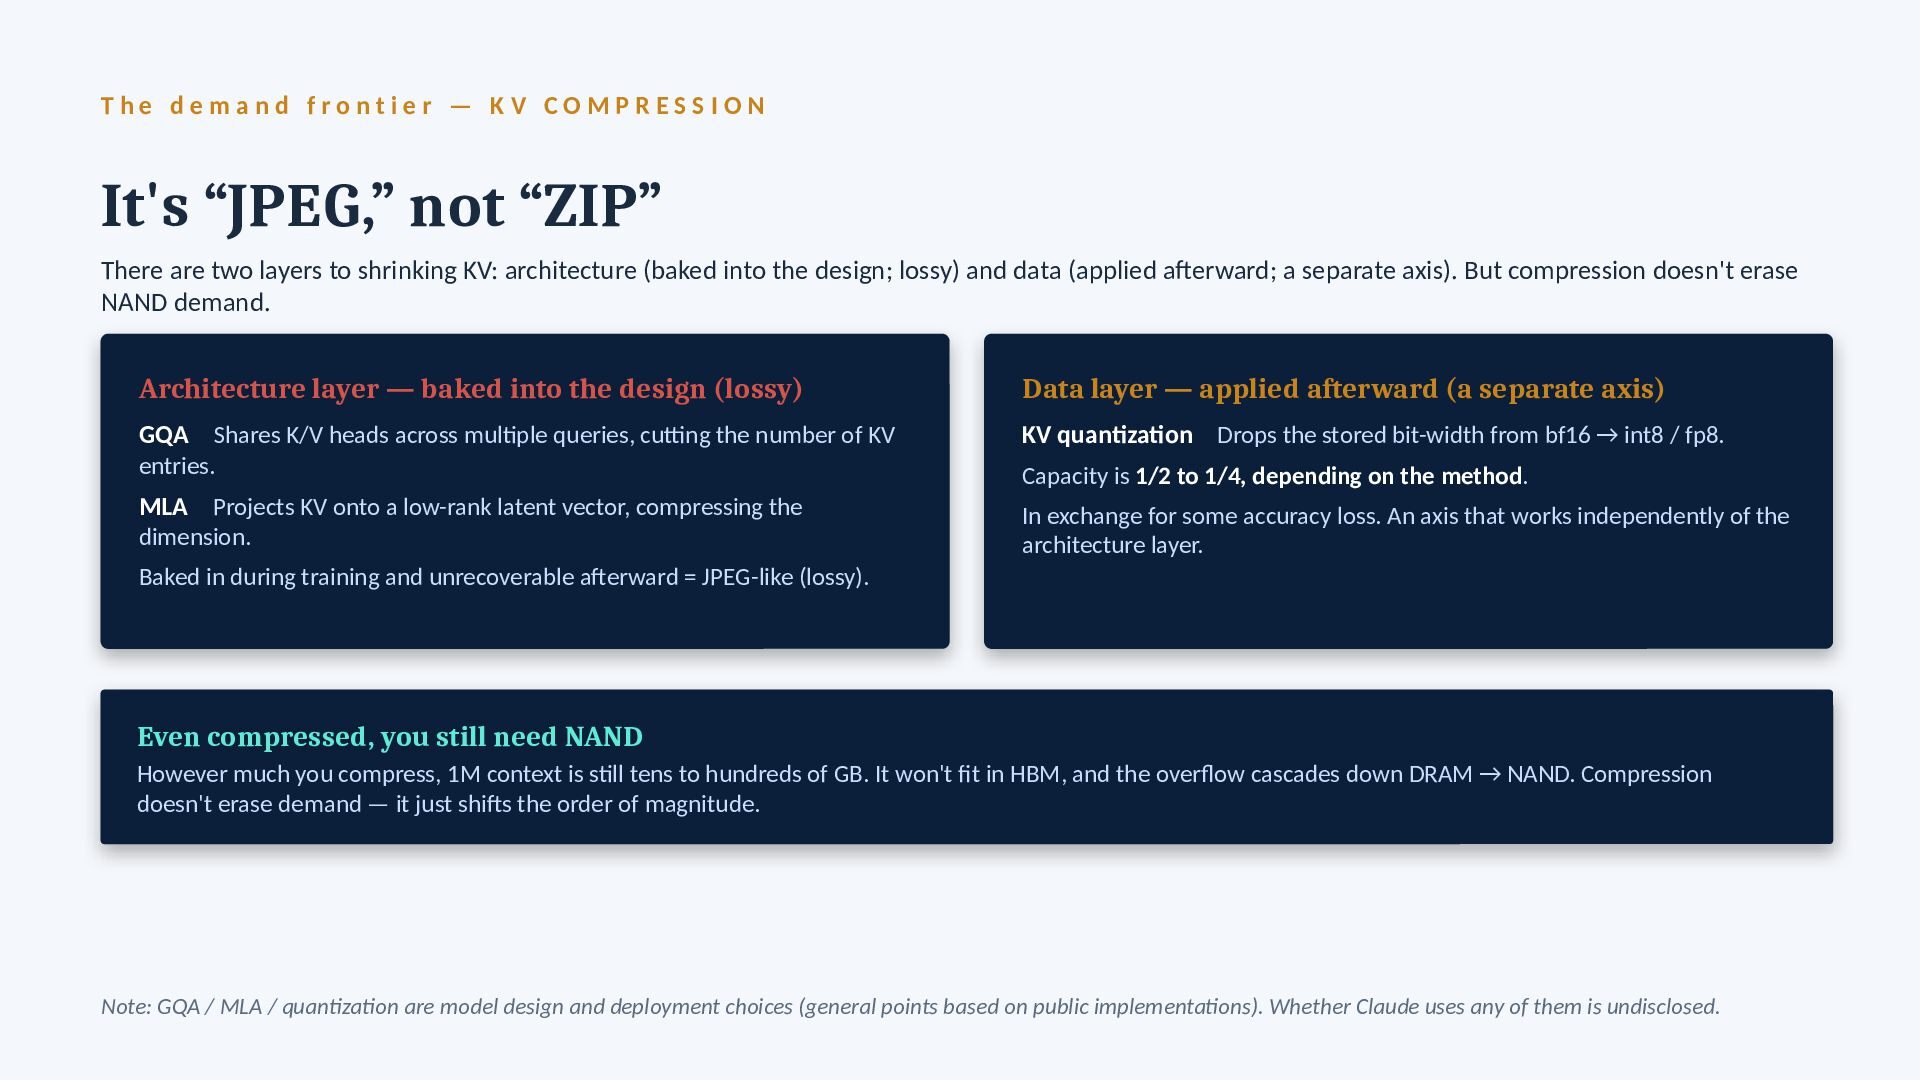
r o n t i e r — K V C O M P R E S S I O N It's “JPEG,” not “ZIP” There are two layers to shrinking KV: architecture (baked into the design; lossy) and data (applied afterward; a separate axis). But compression doesn't erase NAND demand. Architecture layer — baked into the design (lossy) GQA Shares K/V heads across multiple queries, cutting the number of KV entries. MLA Projects KV onto a low-rank latent vector, compressing the dimension. Baked in during training and unrecoverable afterward = JPEG-like (lossy). Data layer — applied afterward (a separate axis) KV quantization Drops the stored bit-width from bf16 → int8 / fp8. Capacity is 1/2 to 1/4, depending on the method. In exchange for some accuracy loss. An axis that works independently of the architecture layer. Even compressed, you still need NAND However much you compress, 1M context is still tens to hundreds of GB. It won't fit in HBM, and the overflow cascades down DRAM → NAND. Compression doesn't erase demand — it just shifts the order of magnitude. Note: GQA / MLA / quantization are model design and deployment choices (general points based on public implementations). Whether Claude uses any of them is undisclosed.
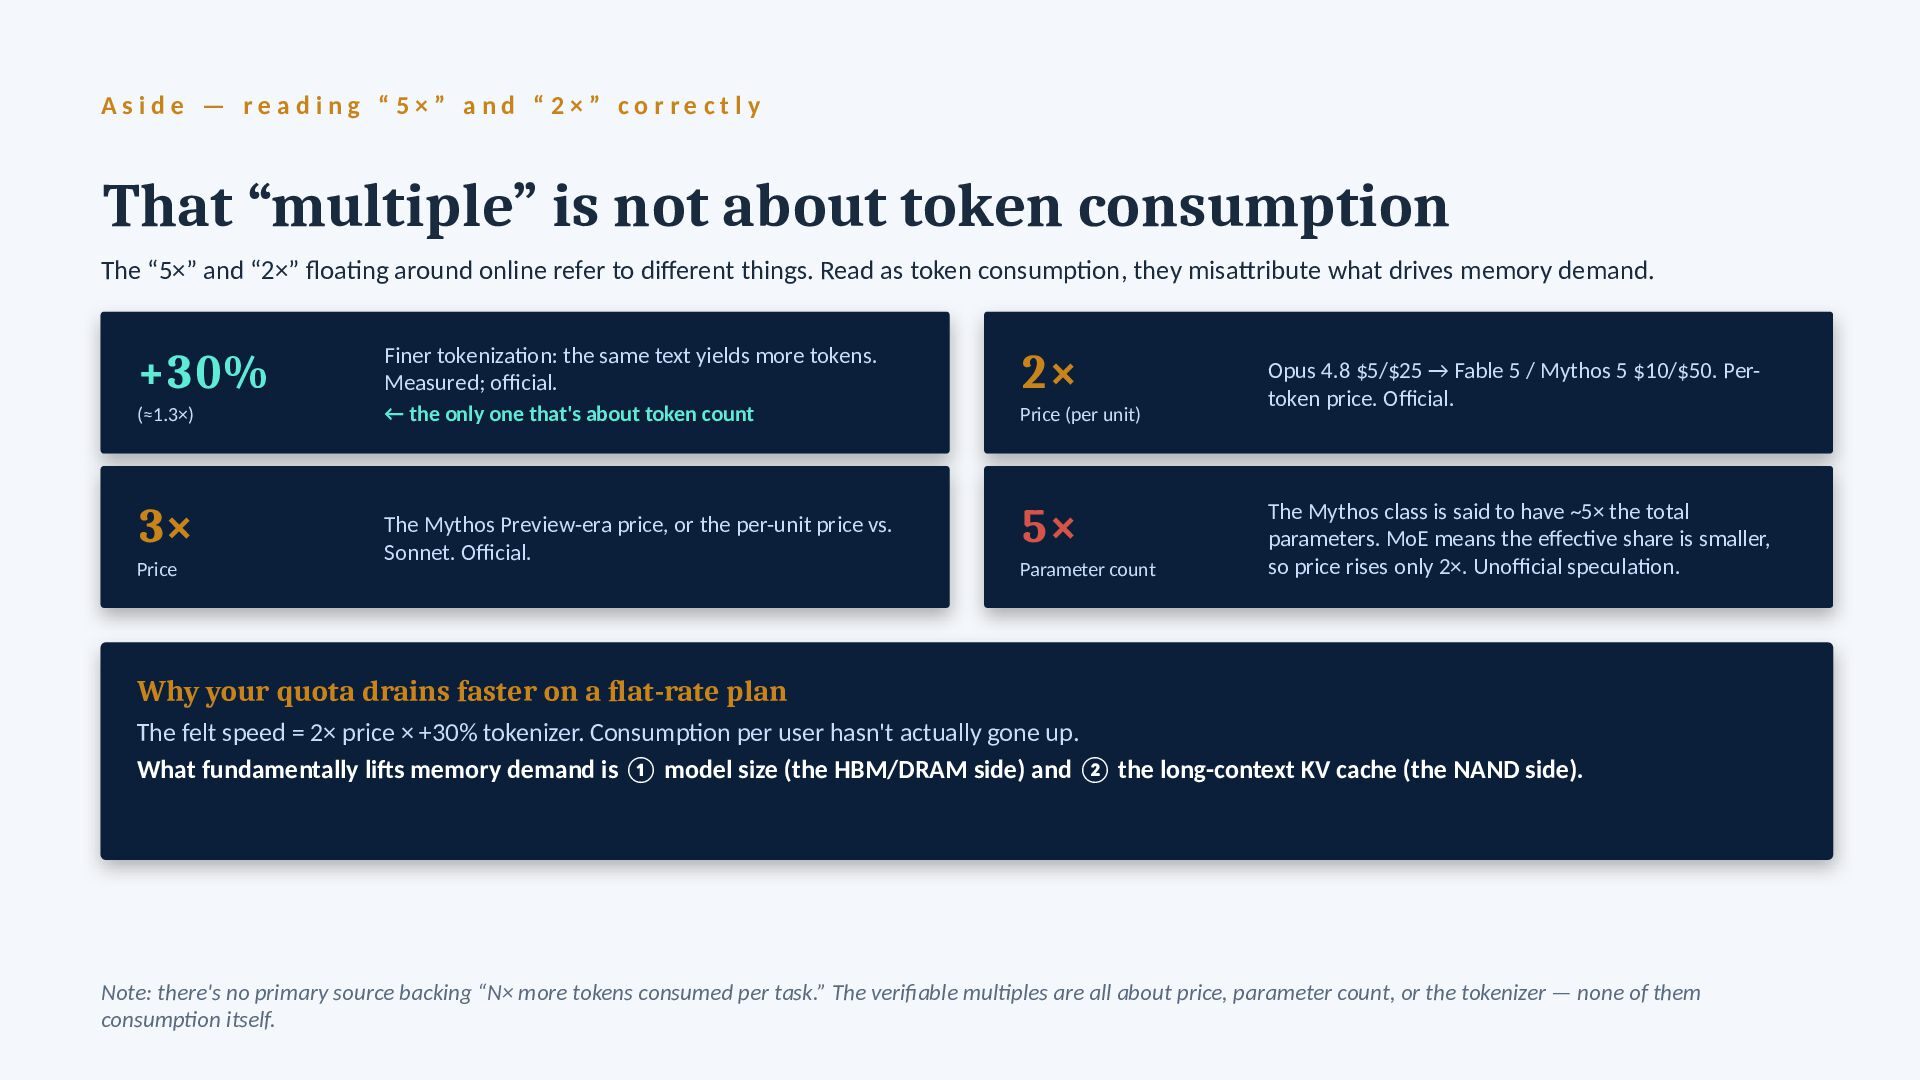
i n g “ 5 × ” a n d “ 2 × ” c o r r e c t l y That “multiple” is not about token consumption The “5×” and “2×” floating around online refer to different things. Read as token consumption, they misattribute what drives memory demand. +30% (≈1.3×) Finer tokenization: the same text yields more tokens. Measured; official. ← the only one that's about token count 2× Price (per unit) Opus 4.8 $5/$25 → Fable 5 / Mythos 5 $10/$50. Per- token price. Official. 3× Price The Mythos Preview-era price, or the per-unit price vs. Sonnet. Official. 5× Parameter count The Mythos class is said to have ~5× the total parameters. MoE means the effective share is smaller, so price rises only 2×. Unofficial speculation. Why your quota drains faster on a flat-rate plan The felt speed = 2× price × +30% tokenizer. Consumption per user hasn't actually gone up. What fundamentally lifts memory demand is ① model size (the HBM/DRAM side) and ② the long-context KV cache (the NAND side). Note: there's no primary source backing “N× more tokens consumed per task.” The verifiable multiples are all about price, parameter count, or the tokenizer — none of them consumption itself.
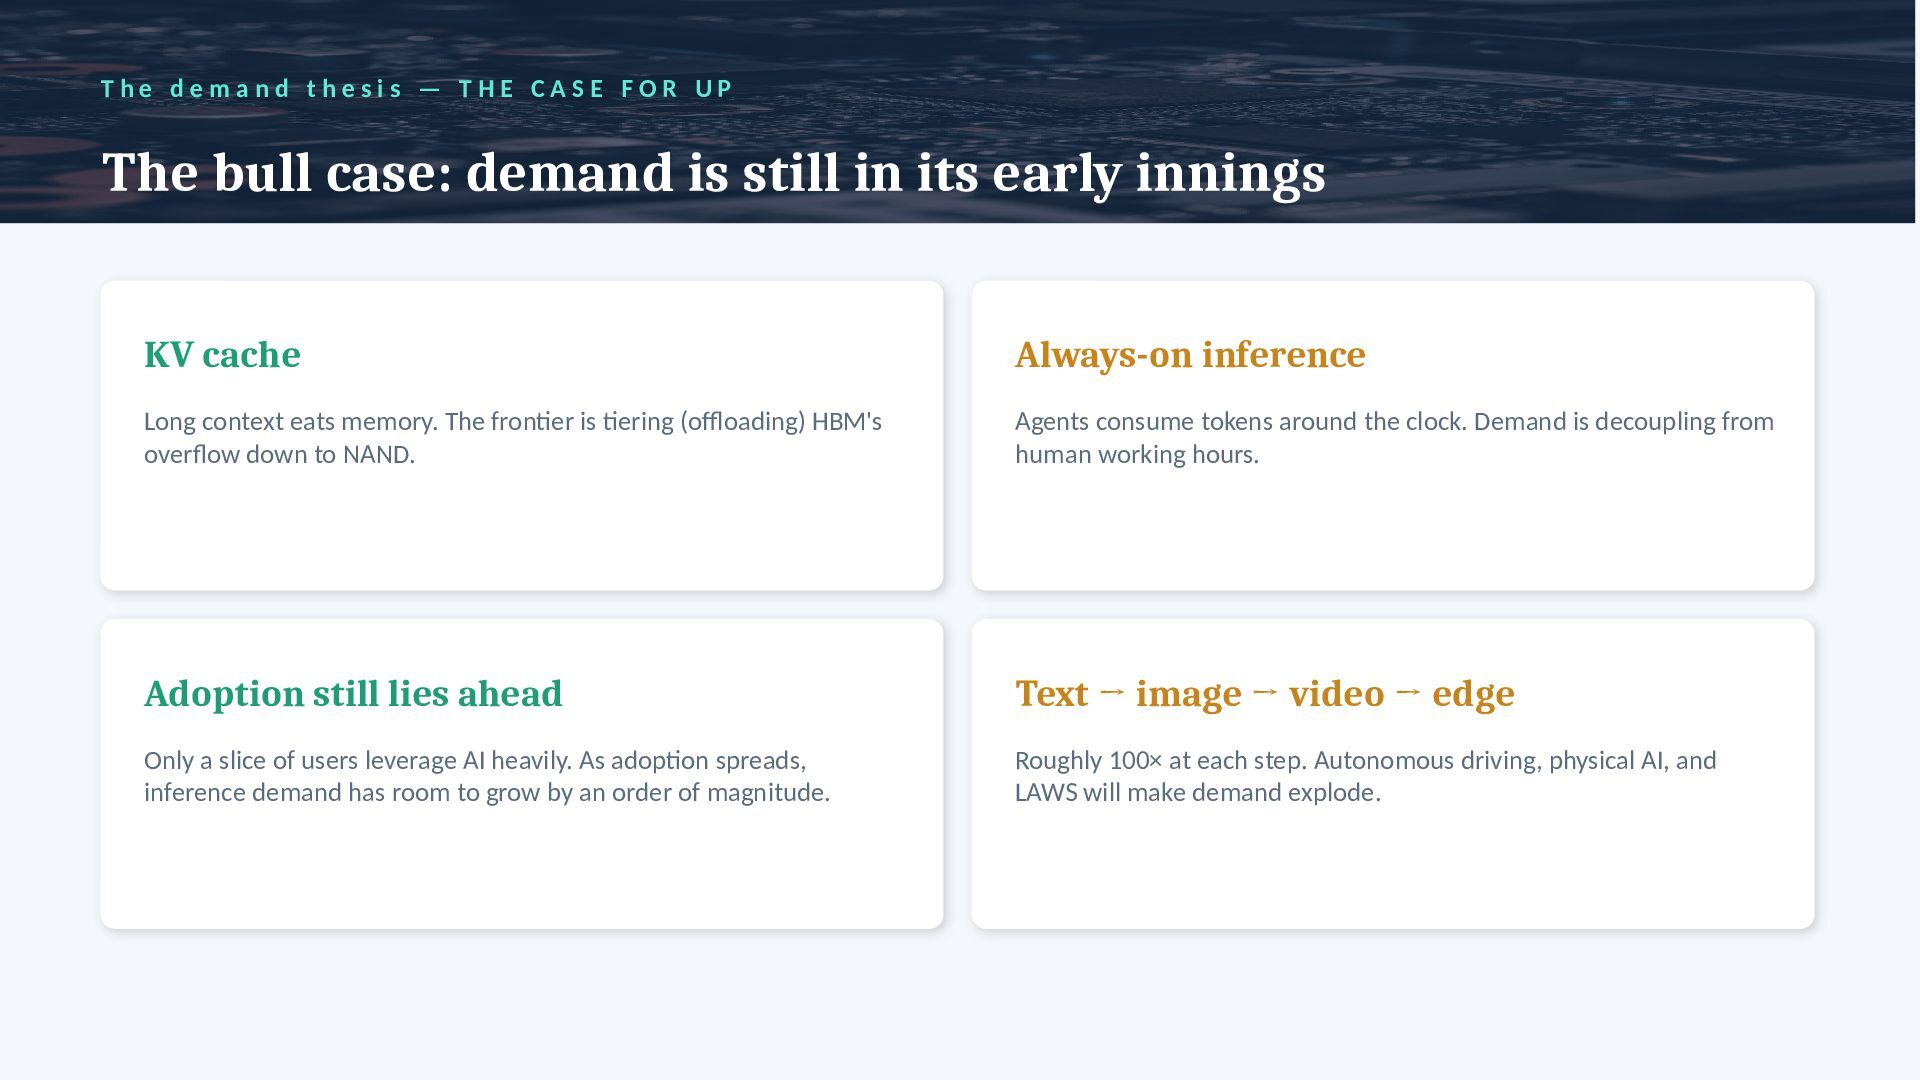
h e s i s — T H E C A S E F O R U P The bull case: demand is still in its early innings KV cache Long context eats memory. The frontier is tiering (offloading) HBM's overflow down to NAND. Always-on inference Agents consume tokens around the clock. Demand is decoupling from human working hours. Adoption still lies ahead Only a slice of users leverage AI heavily. As adoption spreads, inference demand has room to grow by an order of magnitude. Text → image → video → edge Roughly 100× at each step. Autonomous driving, physical AI, and LAWS will make demand explode.
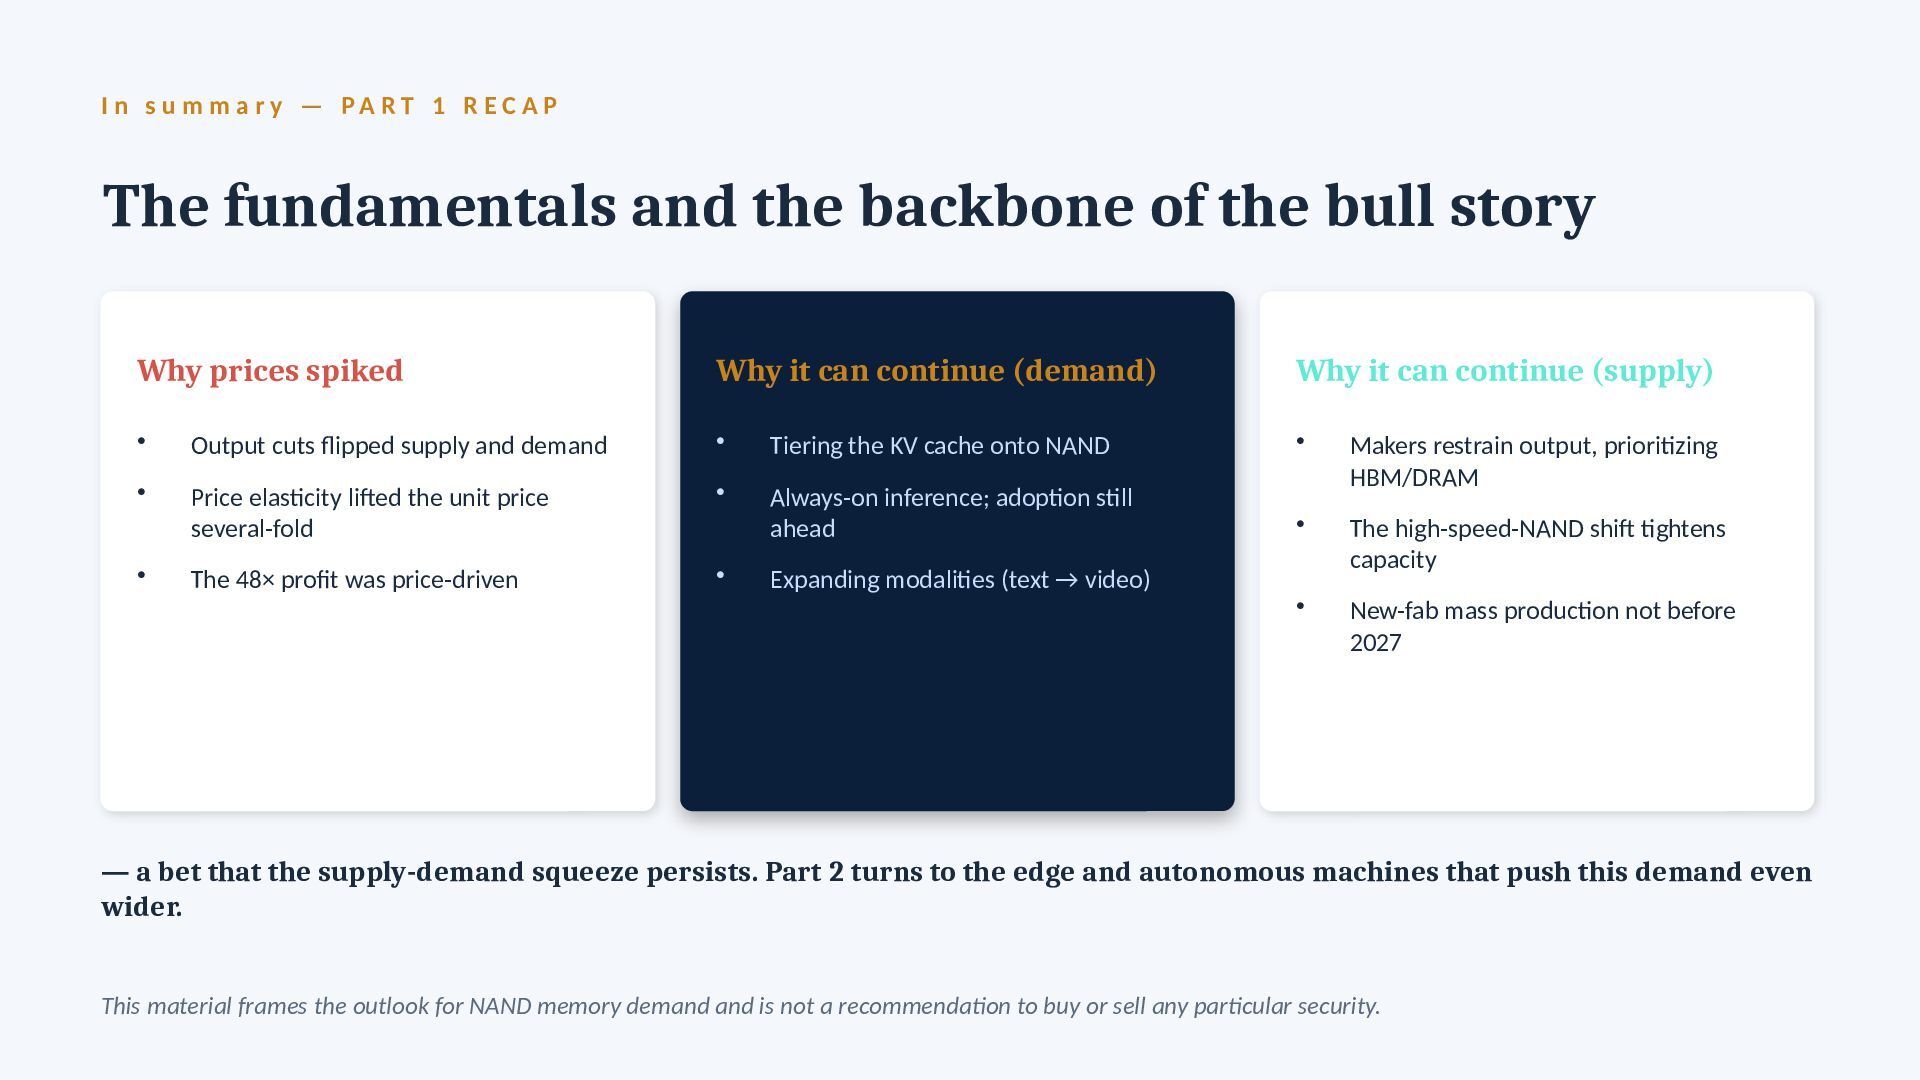
P A R T 1 R E C A P The fundamentals and the backbone of the bull story Why prices spiked • Output cuts flipped supply and demand • Price elasticity lifted the unit price several-fold • The 48× profit was price-driven Why it can continue (demand) • Tiering the KV cache onto NAND • Always-on inference; adoption still ahead • Expanding modalities (text → video) Why it can continue (supply) • Makers restrain output, prioritizing HBM/DRAM • The high-speed-NAND shift tightens capacity • New-fab mass production not before 2027 — a bet that the supply-demand squeeze persists. Part 2 turns to the edge and autonomous machines that push this demand even wider. This material frames the outlook for NAND memory demand and is not a recommendation to buy or sell any particular security.


 topaz2
 kentapapa
 riyaamemiya
 yut0naga1_fa
 teamlab
 nttcom
 odashi
 mhrtech
 yahonda
 carta_engineering
 koukihosaka
 persolserverworks
 occhi
 eileencodes
 soysaucechin
 tomoyanonymous
 danielanewman
 rkaga
 varn
 shlominoach
 eitanlees
 baasie
 aleyda
 axbom
 lauravandoore